ISSN 2288-1069 (Online)
http://dx.doi.org/10.12925/jkocs.2013.30.4.602
Nanoemulsions containing Vitamin E acetate prepared by PIC(phase inversion composition) methods:
Factors affecting droplet sizes
Eun-Hee Kim ․Wan-Goo Cho
✝Basic Medicine Department, College of Medical Science, Jeonju University, 303 Cheonjam-ro, Wansan-gu, Jeonju, 560-759, Korea
(Received December 4, 2013 ; Revised December 19, 2013 ; Accepted December 19, 2013)
Abstract : We have investigated the influence of system composition and preparation conditions on the particle size of vitamin E acetate (VE)-loaded nanoemulsions prepared by PIC(phase inversion composition) emulsification. This method relies on the formation of very fine oil droplets when water is added to oil/surfactant mixture. The oil-to-emulsion ratio content was kept constant (5 wt.%) while the surfactant-to-oil ratio (%SOR) was varied from 50 to 200 %. Oil phase composition (vitamin E to medium chain ester ratio, %VOR) had an effect on particle size, with the smallest droplets being formed below 60 % of VOR. Food-grade non-ionic surfactants (Tween 80 and Span 80) were used as an emulsifier. The effect of f on the droplet size distribution has been studied. In our system, the droplet volume fraction, given by the oil volume fraction plus the surfactant volume fraction, was varied from 0.1 to 0.3. The droplet diameter remains less than 350 nm when O/S is fixed at 1:1. The droplet size increases gradually as the increasing the volume fraction. Particle size could also be reduced by increasing the temperature when water was added to oil/ surfactant mixture. By optimizing system composition and homogenization conditions we were able to form VE-loaded nanoemulsions with small mean droplet diameters (d < 50 nm). The PIC emulsification method therefore has great potential for forming nanoemulsion-based delivery systems for food, personal care, and pharmaceutical applications.
Keywords : Foods, Nanoemulsion, PIC, Ostwald ripening, Cosmetics
1. Introduction
The food and cosmetic industries are interested in the development of colloidal delivery systems to encapsulate lipophilic
✝
Corresponding author (E-mail: [email protected])
functional ingredients, such as bioactive lipids, flavor oils or oil-soluble-vitamins (e.g.
Vitamin E) [1]. In this study, we focused on
the encapsulation of an oil-soluble vitamin
(vitamin E). The form of vitamin E with the
highest abundance and biological activity is
a-tocopherol [2]. This form of vitamin E is a
lipophilic antioxidant which scavenges free
radicals and protects membrane lipids from
oxidation [2]. Vitamin E (a -tocopherol) is highly susceptible to oxidation due to its polyunsaturated structure and therefore it is usually utilized in its esterified form: Vitamin E acetate (a-tocopherol acetate). Vitamin E acetate has a low water-solubility and therefore it is necessary to encapsulate it within colloidal delivery systems if it is going to be incorporated into aqueous-based products [3]. Emulsion-based delivery systems are particularly suited for the encapsulation of bioactive lipids [3].
The most commonly used emulsion-based delivery systems are emulsions, nanoemulsions and microemulsions, which can be distinguished by their particle dimensions and thermodynamic stability [4]. Microemulsions are thermodynamically stable systems that typically have particle radii <100 nm [5]. In contrast, emulsions and nanoemulsions are thermodynamically unstable systems with particle radii >100 nm and <100 nm, respectively. Differences in particle dimensions lead to differences in the functional performance of emulsion-based delivery systems. The smaller droplets in nanoemulsions means that they tend to have higher stability to gravitational separation, flocculation, and coalescence than equivalent conventional emulsions [6]. The intensity of light scattering by oil droplets decreases with decreasing droplet size, and so nanoemulsions are less turbid than conventional emulsions with similar oil contents. Finally, the bioavailability of encapsulated compounds has been reported to increase with reduced particle sizes [7].
Nanoemulsions can be prepared using a number of different approaches, which are usually categorized as either high-energy or low-energy methods [8]. High-energy methods utilize mechanical devices that are capable of disrupting and intermingling the oil and aqueous phases into tiny oil droplets dispersed in water. They are currently the most widely used means of forming macroemulsions and nanoemulsions in the food industry, and
include devices such as high pressure valve homogenizers, microfluidizers, and sonicators [9]. Low-energy methods mainly rely on control of interfacial phenomenon at the boundary between oil–.water phases and depend strongly on the nature of any surface active molecules present, e.g., their solubility and molecular geometry [9]. These methods are not widely used in the food industry at present, and where they are used there is still a relatively poor understanding of the factors affecting their performance. Nevertheless, studies have shown that low-energy methods are often more efficient in producing small droplet sizes than high-energy ones [10].
Low-energy methods also have some advantages in terms of industrial utilization since no expensive equipment is required [10].
A number of different low-energy approaches have been developed to form nanoemulsions, including spontaneous emulsification, phase inversion temperature (PIT), and PIC methods [8]. One of the major objectives of the current study was to investigate the potential of using the PIC method to form emulsions and nanoemulsions containing vitamin E acetate.
This method simply involves titrating an aqueous phase into an organic phase containing oil and a hydrophilic surfactant with constant stirring [11].
In this study, we have examined a number of factors that impact the formation and properties of vitamin E-loaded nanoemulsions prepared using a low-energy (PIC) method.
2. Materials and Experimentals 2.1. Materials
Vitamin E acetate (VE) was purchased from
BASF (Ludwigshafen, Germany). Isononyl
isononanoate (KAK 99), liquid paraffin,
caprylic/capric triglyceride, methyl phenyl
polysiloxane, isocetyl myristate, methyl
polysiloxane 200, octyl dodecanol, squalane,
shea butter, octyldodecyl myristate were
purchased from Dongnamyuhwa (Korea), Greenwell (USA), Dow Corning (USA), Kokyu Alcohol (Japan), Dow Corning (USA), BASF (Germany), Kishimoto (Japan), AAK (Sweden), Kokyu Alcohol (Japan), respectively. Non-ionic surfactants (Tween 80 and Span 80) and ethylenediaminetetraacetic acid disodium salt (EDTA-2Na) were provided by Sigma–Aldrich Co. (St. Louis, MO). Water was deionized and Milli-Q filtered.
2.2. Emulsion preparation
Phase inversion composition (PIC) was used as a low-energy method to prepare emulsions and nanoemulsions. Initially, an organic phase containing carrier oil, surfactant and vitamin E was stirred for 5 min (300 rpm). Then the water phase with 0.02 wt. % of EDTA-2Na was added dropwise to the oil solution with constant stirring (300 rpm) at a flow rate of 10 drops per 1 minute using a spoide. After the emulsification, the samples were cooled at room temperature (-25
oC). The effect of temperature on particle size was investigated by varying the emulsifying temperatures (25-85
o
C).
In the first approach, the effect of oil type on droplet size was investigated. The type of oils was varied, while keeping the total surfactant (Tween 80 + Span 80) constant (5 wt.%).
In the second approach, the surfactant-to- oil ratio (SOR) was varied, while keeping the total oil constant (5 wt.%):
%SOR = 100xm
S/m
O(1) In the third approach, the VE-to-oil ratio (VOR) was varied, while keeping the total water constant (90 wt.%):
%VOR = 100xm
v/m
O(2) This was achieved by varying the relative amounts of surfactant and oil present in the organic phase.
2.3. Particle size measurements
Dynamic light scattering: Systems containing relatively small droplets (d < 3000 nm) were analyzed by dynamic light scattering (DLS).
The particle size distribution, mean particle diameter, and polydispersity index (PDI) of samples were measured using a commercial DLS instrument (ELS-8000, Otsuka, Japan). A 200 mW green laser (λ = 532 nm) with variable intensity was used, and measurements were carried out at room temperature with a scattering angle of 90°. The droplet size was measured directly without dilution. The average diameters were calculated from the intensity autocorrelation data with the cumulants method. The intensity−intensity time correlation functions were analyzed by the CONTIN method .
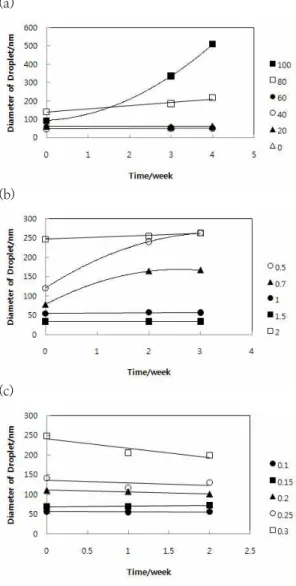
2.4. Long-term stability test
The long term stability of nanoemulsions was assessed by measuring the change of droplet size with time of storage. The samples were kept sealed at room temperature.
3. Results 3.1. Phase inversion point
We investigated the phase behavior of surfactant– oil–water (SOW) systems containing Tween 80 and Span 80 as the surfactants (S), VE + KAK 99 as the oil phase (O), and EDTA-2Na solution as the water phase (W).
SOR was fixed 1 and mixed surfactants were
Tween 80, 3.9 % and Span 80, 1.1 %. Oil
and surfactants were mixed together and then
water was titrated into this mixture while the
system was constantly stirred, until the final
water content was reached. The appearance,
shear viscosity, and electrical conductivity of
the samples were measured as increasing
amounts of water were added to the system
(Figure 1). The initial surfactant/oil mixtures
had a transparent appearance, a low electrical
conductivity and a relatively low shear
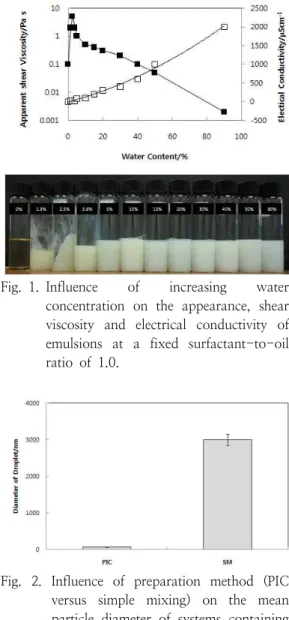
viscosity. Visually, they initially became hazy and less viscous, then a hazy viscous gel phase formed, and then hazy viscous gel phase became less viscous. The electrical conductivity remained relatively low when small amounts of water were added indicating that the continuous phase was oil, but then it increased steadily once a critical water level was exceeded, which is consistent with a W/O to O/W phase transition [15]. Initially, the shear viscosity increased steeply as the water content increased (due to an increase in the volume of water droplets in the W/O emulsion), then it reached a maximum value, and then it decreased with a further increase in water content (due to a decrease in the volume of oil droplets in the O/W emulsion). The highly viscous or gel-like material observed at intermediate water contents may be attributed to the formation of a liquid crystalline phase [14] and/or a multiple emulsion with a high disperse phase volume fraction. The water content where the electrical conductivity began to increase was somewhat lower than that where the maximum in the shear viscosity occurred, suggesting that the intermediate phase may have had a bicontinuous structure with some interconnected water regions that allowed ions to flow [12].
The water content at which the electrical conductivity first increased was 1.3 % for SOR = 1, whereas the water content at which the maximum in the apparent viscosity occurred was 2.5 % for SOR = 1.
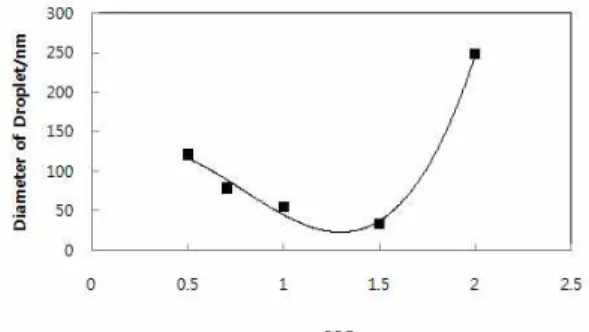
We also measured the mean droplet diameter of the nanoemulsions formed at the end of the PIC titration process (Figure 2).
The size of the droplets produced was compared with those produced by simply mixing the surfactant, oil, and water together at their final concentrations. Our results show that nanoemulsions cannot be formed by simply mixing all the components together.
Indeed, all of the emulsions formed by simple mixing contained very large droplets (d > 30 mm). On the other hand, nanoemulsions could
be formed using the PIC method under certain conditions (Figure 2): d = 60 nm.
Fig. 1. Influence of increasing water concentration on the appearance, shear viscosity and electrical conductivity of emulsions at a fixed surfactant-to-oil ratio of 1.0.
Fig. 2. Influence of preparation method (PIC versus simple mixing) on the mean particle diameter of systems containing 5% oil phase (KAK 99).
These results suggest that the formation of a
gel-like material at intermediate water contents
may be important in the formation of fine oil
droplets by the PIC method. Presumably, this
gel-like material was a liquid crystalline phase
or a multiple emulsion (O/W/O) with a high
disperse phase volume fraction. Nevertheless,
further studies are needed to determine the
structural organization of the surfactant, oil, and water molecules within this intermediate phase, and to determine the relationship between this structure and the size of the droplets produced in the O/W emulsions after phase inversion [13].
3.2. Influence of oil phase composition on particle size
In this series of experiments we examined the influence of sorts of and oil phase composition (vitamin E acetate-to-KAK 99 ratio) on the formation of nanoemulsions produced using the PIC method. This information is important for the rational design of nanoemulsion-based delivery systems for lipophilic nutraceuticals, such as oil-soluble vitamins. For these experiments, we used 5 wt% surfactant (Tween 80, 3.9 % +Span 80, 1.1 %), 5 wt% oil phase and 90 wt% water phase (EDTA-2Na).
We examined whether various oils could be form nanoemulsions using PIC method: liquid paraffin; caprylic/capric triglyceride; methyl phenyl polysiloxane; isocetyl myristate; methyl polysiloxane 200; octyl dodecanol; squalane;
shea butter; octyldodecyl myristate; KAK 99.
These systems were prepared using the same PIC method to produce namoemulsions, i.e., stepwise adding of phase into the surfactant/oil mixture with constant mixing at 75
oC.
The influence of oil type on the size of the droplets produced by the PIC method is shown in Figure 3. None of the oils tested was able to form nanoemulsions (d < 100 nm) except liquid paraffin and KAK 99. Indeed, the mean droplet diameters were all greater than 5 mm, which accounts for the very poor stability of these systems to gravitational separation. This result suggests that these oils did not have the molecular or physicochemical characteristics required to promote the spontaneous formation of oil droplets at oil–
water boundaries, e.g., solubility characteristics, molecular geometry, interfacial mobility, or interfacial tension.
Fig. 3. Influence of a sorts of oils on mean particle diameter of emulsions produced by PIC method. Emulsions were prepared using 5 wt% oil, 5wt%
surfactant (Tween 80 + Span 80) and 90 wt% water.
We also investigated the influence of VOR (vitamin E acetate-to-KAK 99 ratio) on the formation and stability of nanoemulsions produced using the PIC method.
Nanoemulsions (d < 100 nm) could be formed using the PIC method, however, the droplet size produced did not depend strongly on oil phase composition (Figure 4). The droplets were formed in the emulsions containing 0-60 wt% VE (d = 60 nm), whereas larger droplets were formed at higher vitamin E levels.
Fig. 4. Influence of oil composition on mean
particle diameter and poydispersity
index of emulsions produced by PIC
method. Emulsions were prepared
using 5 wt% oil (KAK 99 + VE),
5wt% surfactant (Tween 80 + Span
80) and 90 wt% water.
3.3. Influence of HLB on particle size
In this section, we examined the influence of HLB value and O/S on nanoemulsion formation. When the emulsion is stabilized by a mixture of nonionic surfactants, the mixed HLB value is considered to be the algebraic average of the HLB value of the individual surfactants.
In other words, the variation in the mixed HLB values was calculated according to the relationship
HLB
mix= HLB
A× A% + HLB
B× B% (3) where HLB
mixis the HLB value of the mixed surfactants, HLB
A/Bis the HLB value of surfactant A or B, and A% and B% are the weight percentages of A and B, respectively.
All the HLB values used are obtained at 25
o