pISSN 1598-2033 eISSN 2233-5706 Journal of the Korea Institute of Building Construction, Vol. 12, No. 1
http://dx.doi.org/10.5345/JKIBC.2012.12.1.087
www.jkibc.org
Estimation of Setting Time of Cement Mortar combined with Recycled Aggregate Powder and Cement Kiln Dust based on Equivalent Age
Han, Min-Cheol
*1)Department of Architectural Engineering, Cheongju University, Cheongju, 360-764, Korea
Abstract
This paper presents a method of estimating the setting time of cement mortar incorporating recycled aggregate powder (RP) and cement kiln dust (CKD) at various curing temperatures by applying an equivalent age method. To estimate setting time, the equivalent age using apparent activation energy (Ea) was applied. Increasing RP and CKD leads to a shortened initial and final set. Ea at the initial set and final set obtained by Arrhenius function showed differences in response to mixture type. These were estimated to be from 10∼19 KJ/mol in all mixtures, which is smaller than those of conventional mixture ranging from 30∼50 KJ/mol. Based on the application of Ea to Freisleben‐
Hansen and Pederson's equivalent age function, equivalent age is nearly constant, regardless of curing temperature and RP contents. This implies that the concept of maturity is applicable in estimating the setting time of concrete containing RP and CKD. A high correlation was observed between estimated setting time and measured setting time. A multi‐
regression model was provided to determine setting time reflecting RP and CKD. Thus, the setting time estimation method studied herein can be applicable to concrete incorporating RP and CKD in the construction field.
Keywords : recycled aggregate powder, cement kiln dust, equivalent age, setting time, curing temperature
1. Introduction
As the number of the urban re‐development projects has been on the rise and old building structures have been made obsolete, the amount of waste concrete has been sharply increased. In the recycling of resources, waste concrete is now used as a recycled aggregate material. In the process of producing recycled aggregate, about 40 percent of the recycled aggregate powder (RP) is scattered or left unused[1.2].
Since RP is usually composed of CaO and SiO
2,elements similar to cement, and some is used as a
Received : September 26, 2011 Revision received : October 19, 2011 Accepted : November 5, 2011
* Corresponding author : Han, Min-Cheol [Tel: 82-43-229-8484, E-mail: [email protected]]
ⓒ2012 The Korea Institute of Building Construction, All rights reserved.
landfill material or a cover material after combining it with soil, or is left unused or scatters, it triggers secondary environmental pollution. When disposed as waste, high disposal costs are involved[3]. In other countries, including Japan, research has been actively carried out in the utilization of RP for materials for workability improvement and concrete aggregate, while in Korea few studies have been conducted on the effective recycling of RP.
For instance, Kim et al.[1] reported the results of an assessment of the usability of cement panel as alternative material to silica sand. Hyeon[4]
suggested a method of manufacturing artificial lightweight aggregate by using the residue soil of construction. As well, Kang et al.[3] performed laboratory experiments on the properties by refiring in RP manufactured through a wet separation method, and assessed its usability.
However, as of yet there has been no research
conducted on recycling as aggregate to secure concrete setting and high early strength gain.
Thus, the researchers are studying the plan to utilize RP as early high strength aggregate for concrete by grading RP below 0.08 mm[5]. It is revealed that when RP was used as a portion of aggregate, the RP filled the pore space, and thus the strength of cement was increased. Here, when the cement kiln dust (hereinafter referred to as CKD), the powder generated in the process of cement manufacturing, is added, it is believed that the setting time can be reduced and the early high strength gain may also be improved, since CKD has a high amount of CaO, which facilitates hydration. In particular, according to Han et al.[6,7], CKD is reported to facilitate curing and improve strength under low‐temperature conditions due to its high hydration activity and its high fineness, which exceeds 8,000 ㎠/g.
On the other hand, considering construction sites in Korea, there are changes in temperature with the season, and the curing and strength of concrete is affected by such temperature change.
For this reason, it is important to have an accurate understanding of the effect of the setting temperature on concrete placement and maintenance.
However, there has been no quantitative analysis of the temperature dependence of the setting reaction of concrete mortar mixed with RP and CKD, so research should be done in this area to enable the effective utilization of recycled resources in the future.
Therefore, the RR below 0.08 mm in the process of manufacturing recycled aggregate was collected and substituted as a fine aggregate. To secure an additional early high strength gain, CKD generated in the process of manufacturing cement was also substituted to conduct a quantitative analysis on the effect of changes in the temperature on the
setting reaction of the cement mortar combined with RP and CKD, and to estimate the setting time by applying an equivalent age method.
2. Design of experiment and method
2.1 Experimental plan
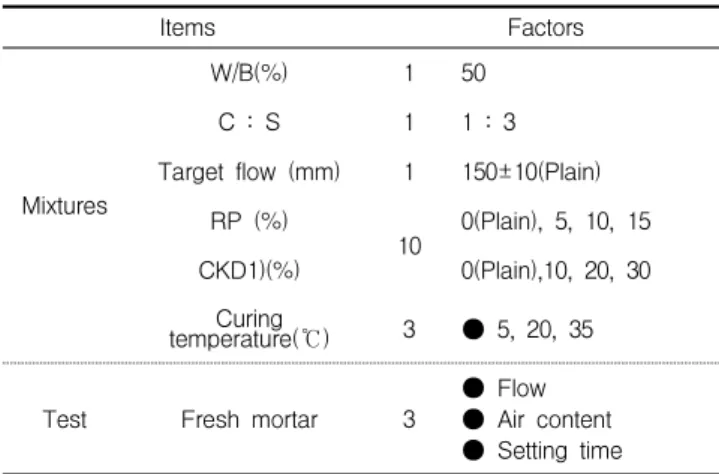
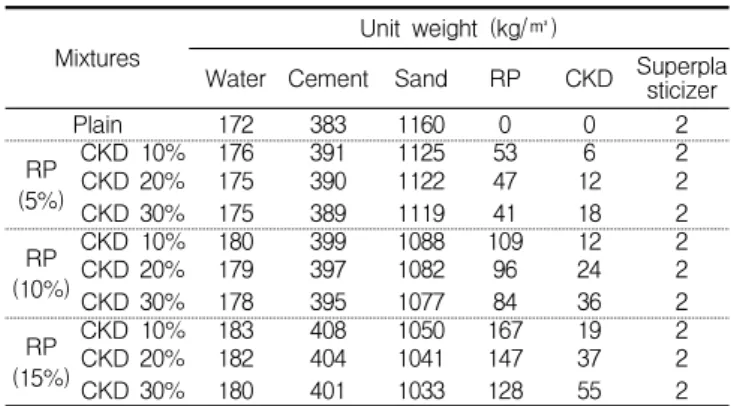
Table 1 indicates the experimental plan, and Table 2 shows the mixture proportions of mortar.
First of all, as experimental factors, W/B was fixed at 50%, the mixture ratio of cement and aggregate at 1:3, and the amount of SP was determined to satisfy the target flow for the plain mixture of 150±10 mm. The same amount of SP was used for the other concrete mortars. RP and CKD were substituted by mass based on the preceding study[5]. RP was substituted for fine aggregate in the proportion of 5%, 10% and 15%, respectively, while CKD was substituted for RP in the proportion of 10%, 20% and 30%, respectively.
Items Factors
Mixtures
W/B(%) 1 50
C : S 1 1 : 3
Target flow (mm) 1 150±10(Plain) RP (%)
10 0(Plain), 5, 10, 15 CKD1)(%) 0(Plain),10, 20, 30
Curing
temperature(℃) 3 ● 5, 20, 35
Test Fresh mortar 3 ● Flow
● Air content
● Setting time 1) substituted to RP by mass
Table 1. Experimental plan
The curing temperature to estimate the setting
was set at 5℃, 20℃ and 30℃, taking into account
normal Korean temperatures in winter and
summer. Flow, air content, and setting time were
to be measured.
Mixtures Unit weight (kg/㎥)
Water Cement Sand RP CKD Superplasticizer
Plain 172 383 1160 0 0 2
RP (5%)
CKD 10% 176 391 1125 53 6 2
CKD 20% 175 390 1122 47 12 2
CKD 30% 175 389 1119 41 18 2
(10%)RP
CKD 10% 180 399 1088 109 12 2
CKD 20% 179 397 1082 96 24 2
CKD 30% 178 395 1077 84 36 2
RP (15%)
CKD 10% 183 408 1050 167 19 2
CKD 20% 182 404 1041 147 37 2
CKD 30% 180 401 1033 128 55 2
Table 2. Mixture proportions of mortars
2.2 Materials
The cement used in this study is ordinary Portland cement manufactured by Company A in Korea. The properties of the cement are indicated in Table 3. Crushed sand and river sand from Jochiwon, Chuncheongnamdo were used as aggregate by combining them in a 1:1 ratio. Table 4 shows the properties of each of the sands.
RP was collected from the production line of Company A using the dry separation method. RP below 0.08 mm was collected, and the properties of RP are indicated in Table. 5. In Table 5, the properties of CKD, fine powder collected from the pre‐heater section of Cement Company B, are also shown.
Polyocarboxylic acid superplasticizer manufactured in Company B was used, whose properties are shown in Table 6.
Table 3. Physical properties of cement Density(
g/㎤) Blaine (㎠/g)
Soundn ess (%)
Setting time
(min.) Compressive
strength(MPa) Initial Final 3 days 7 days 28 days
3.15 3 165 0.07 232 429 24.5 33.1 43.9
Table 4. Physical properties of fine aggregates Type Density
(g/㎤) Fineness modulus
Absorption ratio
(%)
Unit weight (kg/㎥)
Passing amount of
0.08 mm sieve(%) River
sand 2.5 2.86 0.46 1518 0.30
Crushed
sand 2.58 2.90 0.46 1684 0.32
admi-x ture Density
(g/㎤) Blaine
(㎠/g) L.O.I
(%)
Chemical composition SiO2 Fe2O3 Al2O3 CaO RP 2.30 6 443 20.26 27.35 6.66 5.99 33.87
CKD 2.55 8 200 - 9.65 3.70 1.54 43.60
Table 6. Physical and chemical properties of high range water reducing agent
Type Basis Appearance Density
(g/㎤) High range
water reducing
agent Polycarboxylate Liquid, Dark brown 1.05 Table 5. Physical and chemical composition of RP and CKD
2.3 Experiment method
Mortar was mixed according to KS L 5109, and the flow of fresh mortar, air content, and the setting time were measured according to KS L 5105, KS F 2421 and KS F 2436, respectively. The setting time was measured in a chamber whose temperature was kept at 5℃~35℃ after the mould was set.
3. Results and discussion
3.1 Flow of fresh mortar and air content
Figure 1 shows the flow values according to
substitution by combining RP and CKD. First, the
plain mixture satisfied the target flow, but as
indicated in Figure 1, the higher the RP was, the
lower the flow became. This seems to be because
the substitution rate was increased as more RP
was replaced for fine aggregate, and the viscosity
accordingly became thicker. However, there were
no significant differences in the flow values
according to the substitution of CKD, which
implies that although CKD was substituted for
some of RP, it did not affect the overall powder
content.
Plain 5 10 15 100
110 120 130 140 150 160 170 180
RP contents (%)
Plain CKD 10%
CKD 20%
CKD 30%
Fl ow (m m )
20 2.0 0 5 10 15 20
2.5 3.0 3.5 4.0 4.5 5.0
CKD10%
CKD20%
CKD30%
Air contents (%)
RP contents (%) Plain
Figure 1. Flow with the contents of RP Figure 2. Air content with the contents of RP
0 10 20 30
0 5 10 15 20
0 10 20 30 0 10 20 30
Initial Final
Setting time(hr.)
CKD contents(%)
RP5 5℃ 20℃ 35℃
0 10 20 30
0 5 10 15 20
0 10 20 30 0 10 20 30
initial final
5℃
CKD contents(%)
Setting time(hr.)
RP10 20℃ 35℃
0 10 20 30
0 5 10 15 20
0 10 20 30
0 10 20 30
Initial Final 5℃
CKD contents (%)
Setting time(hr.)
RP15 20℃ 35℃
Figure 3. Setting time with the contents of RP and CKD
Figure 2 indicates air content according to changes in the substitution rate of RP and CKD.
Overall, the more RP was substituted, the less the estimated air content, due to the effect of filling pore space. However, when more CKD was substituted, a slight decrease in air content was observed, but the overall decrease was within the error range, and the target air content was met.
3.2 Properties of setting according to curing temperature
Figure 3 shows the setting time by curing
temperature according to changes in the
substitution rate of RP and CKD. Overall, the
higher the curing temperature, the more shortened
the initial and final time was found to be, which
means that hydration reaction is affected by the
temperature. In other words, the higher the
temperature becomes, the sooner the hydration
reaction takes place. On one hand, there were no
significant differences found according to the
substitution rate of RP. This implies that although
RP contains a lot of CaO, it does not facilitate
hydration activity, and there is no significant
change in the amount of cement mortar depending
on the substation of aggregate. On the other hand,
the more the CKD was substituted, the sooner the
cement was cured. When the proportion was up to
10%, the setting time was rapidly reduced
compared to that of plain mixture, and was
gradually reduced thereafter. It is believed that
unlike that in RP, CaO in CKD facilitated the
setting[4]. This was obvious at the curing
temperature of 5℃, which confirmed the research
finding of Han et al. that CKD facilitated the
setting under a low‐temperature condition.
3.3 Estimation of setting time
3.3.1 Procedure for estimating setting time
To conduct a quantitative analysis on the effect of changes in curing temperature on the setting reaction of cement mortar, the estimation method using equivalent age is discussed in this section.
For an interpretation of setting time, apparent activation energy (E
a)should first be calculated. In ASTM C 1074[7], the apparent activation energy was obtained by using Eq. (1). Setting and compressive strength of the cement mortar set at three different temperatures were measured by each age, a regression analysis was carried out with reciprocal strength and reciprocal age (at 2, 4, 8, 16, 32, and 64 times the setting time) to get the first regression equation. Then, the intercept of the regression line was divided by the slope to obtain the reaction rate constant, k
T.
· exp
--- (1) ln
ln
·
--- (2)
E
acan be calculated using Eq. (2). Obtained by a linear regression with the values of ln(k
T) and 1/T from experiment data, the slope of the first regression equation is E
a/R, and from this value, E
acan be obtained.
However, the Freisleban‐Hansen equivalent age equation to be applied in this research is expressed as Eq. (3) using Arrhenius function. The equivalent age means the setting time at the standard temperature (20℃) where accumulated temperature becomes identical in an actual concrete setting.
exp
--- (3)
Where,
E
a: apparent activation energy(KJ/mol)
R : gas constant(8.341 J/mol․K) t
e: equivalent age
T
r: absolute temperature at 20℃(293 °K) T : curing temperature(t+273 °K)
To estimate the setting time based on equivalent age, a couple of processes and hypotheses are required. First of all, Ea at initial and final set should be obtained. At this time, it is assumed that fine structure is developed by the hydration reaction of concrete to some degree, even at initial and final set[9]. That is, if the degree of hydration is expressed as a
iand a
fat initial and final set, respectively, the following are the hypotheses that can be derived.
1) The time spent in the initial set is the same as the time taken to reach a
i.
2) The time spent in the final set is the same as the time taken to reach a
f.
Here, the sooner the hydration reaction takes place, the shorter the initial and final time is. That is why the time taken to reach initial and final set is in inverse proportion to the hydration reaction constant (k
T∝1/t
i). Under the condition and hypothesis above, Ea at initial and final set can be calculated using Arrhenius. Using the method proposed in ASTM C 1074, ln (1/ti) is replaced with ln (1/ti), the function relation with the reciprocal of the absolute temperature (T) is obtained, and a regression analysis is conducted on it to obtain E
a. The Ea obtained in this manner is substituted in Freisleben‐Hansen equivalent age function to get Ea at initial and final set[10].
3.3.2 Estimation results of setting time
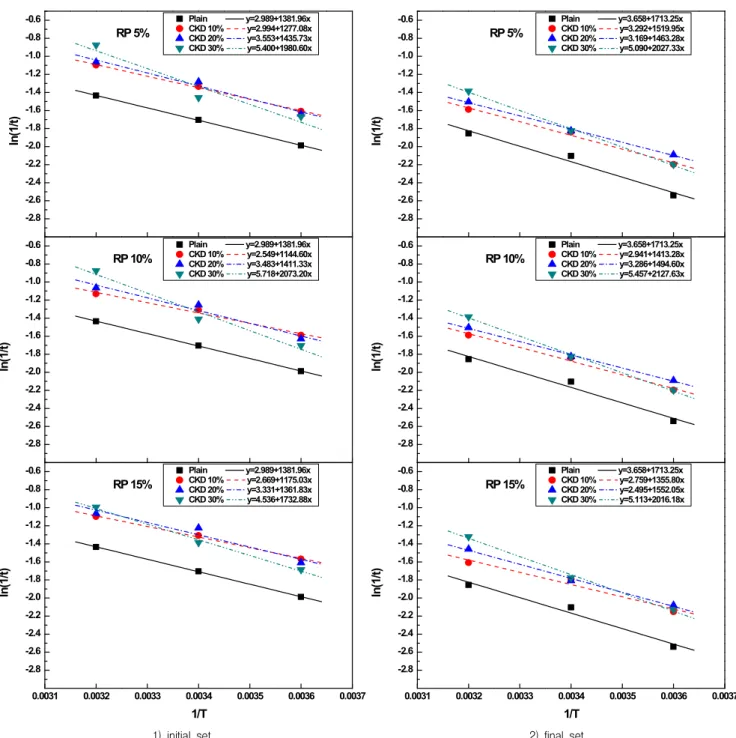
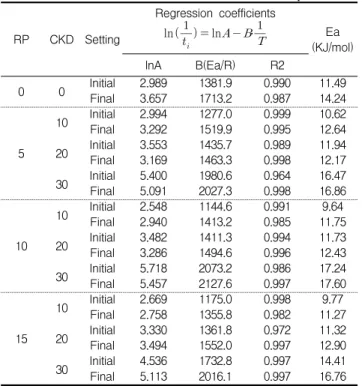
Figure 4 and Table 7 present the results of
regression analysis of Arrhenius plot obtained
using Eq. (2). Overall, the reciprocals of the
measured setting time are shown to be proportional
-2.8 -2.6 -2.4 -2.2 -2.0 -1.8 -1.6 -1.4 -1.2 -1.0 -0.8 -0.6 -2.8 -2.6 -2.4 -2.2 -2.0 -1.8 -1.6 -1.4 -1.2 -1.0 -0.8 -0.6
0.0031 0.0032 0.0033 0.0034 0.0035 0.0036 0.0037
-2.8 -2.6 -2.4 -2.2 -2.0 -1.8 -1.6 -1.4 -1.2 -1.0 -0.8 -0.6
RP 10%
Plain y=2.989+1381.96x CKD 10% y=2.549+1144.60x CKD 20% y=3.483+1411.33x CKD 30% y=5.718+2073.20x
In(1/t)
RP 5%
Plain y=2.989+1381.96x CKD 10% y=2.994+1277.08x CKD 20% y=3.553+1435.73x CKD 30% y=5.400+1980.60x
In(1/t)
RP 15%
Plain y=2.989+1381.96x CKD 10% y=2.669+1175.03x CKD 20% y=3.331+1361.83x CKD 30% y=4.536+1732.88x
1/T
In(1/t)
-2.8 -2.6 -2.4 -2.2 -2.0 -1.8 -1.6 -1.4 -1.2 -1.0 -0.8 -0.6 -2.8 -2.6 -2.4 -2.2 -2.0 -1.8 -1.6 -1.4 -1.2 -1.0 -0.8 -0.6
0.0031 0.0032 0.0033 0.0034 0.0035 0.0036 0.0037
-2.8 -2.6 -2.4 -2.2 -2.0 -1.8 -1.6 -1.4 -1.2 -1.0 -0.8 -0.6
RP 10%
Plain y=3.658+1713.25x CKD 10% y=2.941+1413.28x CKD 20% y=3.286+1494.60x CKD 30% y=5.457+2127.63x
In(1/t)
Plain y=3.658+1713.25x CKD 10% y=3.292+1519.95x CKD 20% y=3.169+1463.28x CKD 30% y=5.090+2027.33x
In(1/t)
RP 5%
RP 15%
Plain y=3.658+1713.25x CKD 10% y=2.759+1355.80x CKD 20% y=2.495+1552.05x CKD 30% y=5.113+2016.18x
1/T
In(1/t)
1) initial set 2) final set
Figure 4. Arrhenius plot depending on RP and CKD contents
to the reciprocals of temperature, a finding that is similar to the results of preceding research. Ea was calculated to be 9.64 ∼ 15.47 kJ/mol at initial set and 11.27 ∼ 17.76 kJ/mol at final set, which is smaller than the results of around 20 kJ/mol obtained by Han et al.[11,12]. It is believed that the differences resulted from the difference in
the hydration reaction rate due to the substitution of RP and CKD.
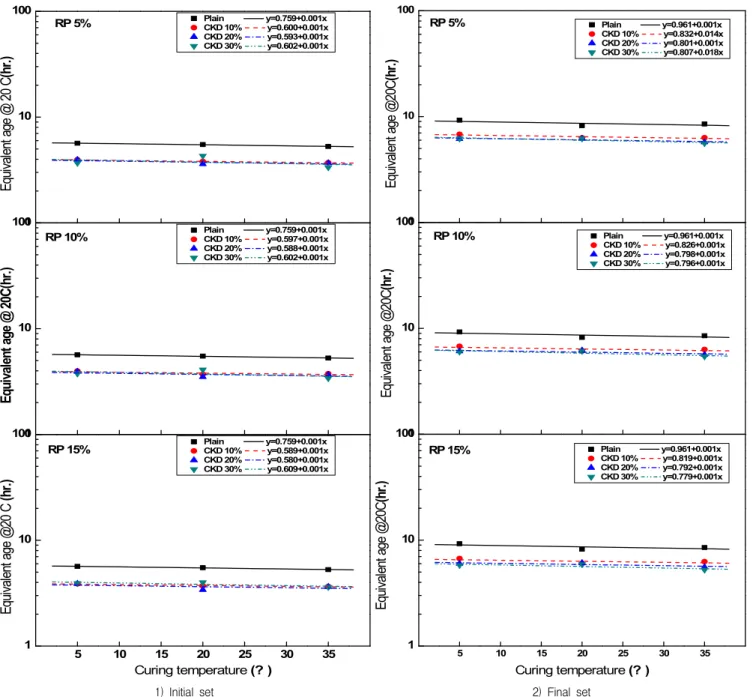
On the other hand, Figure 5 and Table 8 show
equivalent age by curing temperature calculated
using E
aaccording to the substitution rate of PR
and CKD. Overall, equivalent age by curing
temperature was shown to be similar regardless of
1 10 1001 10 100
5 10 15 20 25 30 35
1 10 100
RP 10% Plain y=0.759+0.001x CKD 10% y=0.597+0.001x CKD 20% y=0.588+0.001x CKD 30% y=0.602+0.001x
Equivalent age @ 20C(hr.)
RP 5% Plain y=0.759+0.001x CKD 10% y=0.600+0.001x CKD 20% y=0.593+0.001x CKD 30% y=0.602+0.001x
Equivalent age @ 20 C(hr.)
RP 15% Plain y=0.759+0.001x CKD 10% y=0.589+0.001x CKD 20% y=0.580+0.001x CKD 30% y=0.609+0.001x
Equivalent age @20 C (hr.)
Curing temperature (? )
1 10 1001 10 100
5 10 15 20 25 30 35
1 10 100
RP 10% Plain y=0.961+0.001x CKD 10% y=0.826+0.001x CKD 20% y=0.798+0.001x CKD 30% y=0.796+0.001x
Equivalent age @20C(hr.)
RP 5% Plain y=0.961+0.001x CKD 10% y=0.832+0.014x CKD 20% y=0.801+0.001x CKD 30% y=0.807+0.018x
Equivalent age @20C(hr.)Equivalent age @20C(hr.)
RP 15% Plain y=0.961+0.001x CKD 10% y=0.819+0.001x CKD 20% y=0.792+0.001x CKD 30% y=0.779+0.001x
Curing temperature (? )
1) Initial set 2) Final set
Figure 5. Relationship between equivalent age and curing temperature
the substitution rate of RP and CKD, which suggests that the setting time estimation using the equivalent age method is effective and significant based on the fact that the result satisfied the concept of equivalent age, and that the experiment result was similar to that of preceding study[11].
However, to provide a multi‐regression model to
determine setting time reflecting RP and CKD based on the results from the processes above, a multiple regression/correlation analysis was conducted using the data shown in Table 9, and then Eqs. (4) and (5) were drawn, which were converted into Eqs. (6) and (7) to use equivalent day for setting time estimation.
That is, if the substitution rate of RP and CKD
and setting temperature are known, initial and final set time can be estimated using Eqs. (6) and (7).
1) Equivalent age at initial set
(4) 2) Equivalent age at final set
(5) 3) Estimating equation of initial setting time
exp
-- (6)
4) Estimating equation of final setting time
exp
-- (7)
Where,
t
e: equivalent age (hr.)
: initial and final setting time (hr.) RP : recycled aggregate powder (%) CKD : cement kiln dust (%)
E
a: apparent activation energy (KJ/mol) T : absolute temperature (°K)
Table 7. Calculation of Ea based on Arrhenius equation RP CKD Setting
Regression coefficients ln
ln ․
Ea
(KJ/mol)
lnA B(Ea/R) R2
0 0 Initial 2.989 1381.9 0.990 11.49
Final 3.657 1713.2 0.987 14.24
5
10 Initial 2.994 1277.0 0.999 10.62
Final 3.292 1519.9 0.995 12.64
20 Initial 3.553 1435.7 0.989 11.94
Final 3.169 1463.3 0.998 12.17
30 Initial 5.400 1980.6 0.964 16.47
Final 5.091 2027.3 0.998 16.86
10
10 Initial 2.548 1144.6 0.991 9.64
Final 2.940 1413.2 0.985 11.75
20 Initial 3.482 1411.3 0.994 11.73
Final 3.286 1494.6 0.996 12.43
30 Initial 5.718 2073.2 0.986 17.24
Final 5.457 2127.6 0.997 17.60
15
10 Initial 2.669 1175.0 0.998 9.77
Final 2.758 1355.8 0.982 11.27
20 Initial 3.330 1361.8 0.972 11.32
Final 3.494 1552.0 0.997 12.90
30 Initial 4.536 1732.8 0.997 14.41
Final 5.113 2016.1 0.997 16.76
Table 8. Calculation of equivalent age RP-
CKD
Curing temperatur
e (℃)
Setting
time(hr.) Equivalent age @20℃
Initial Final Initial Average Final Average
Plain
5 7.30 12.70 5.66
5.48 9.26
8.66
20 5.50 8.20 5.50 8.20
35 4.20 6.40 5.28 8.51
5-10
5 5.00 9.00 3.95
3.82 6.80
6.47
20 3.80 6.30 3.80 6.30
35 3.00 4.90 3.71 6.31
5-20
5 5.15 8.08 3.95
3.75 6.17
6.04
20 3.60 6.20 3.60 6.20
35 2.90 4.50 3.68 5.74
5-30
5 5.30 9.00 3.68
3.77 6.20
20 4.30 6.20 4.30 6.20 6.00
35 2.40 4.00 3.34 5.60
10-10
5 4.90 8.80 3.97
3.81 6.78
6.40
20 3.70 6.10 3.70 6.10
35 3.10 5.00 3.75 6.32
10-20
5 5.10 8.00 3.93
3.70 6.08
5.97
20 3.50 6.20 3.50 6.20
35 2.90 4.40 3.67 5.64
10-30
5 5.50 8.90 3.75
3.75 6.01
5.84
20 4.10 6.10 4.10 6.10
35 2.40 3.80 3.39 5.41
15-10
5 4.80 8.60 3.87
3.74 6.70
6.32
20 3.70 6.00 3.70 6.00
35 3.00 5.00 3.65 6.26
15-20
5 5.00 8.00 3.89
3.64 6.01
5.89
20 3.40 6.10 3.40 6.10
35 2.90 4.30 3.64 5.57
15-30
5 5.40 8.40 3.92
3.84 5.79
5.65
20 4.00 5.90 4.00 5.90
35 2.70 3.75 3.60 5.24
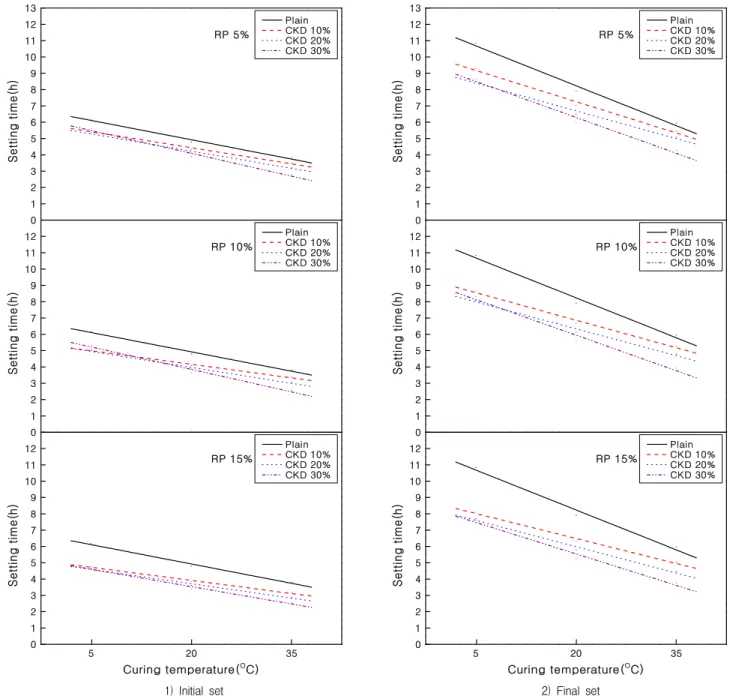
Figure 6 illustrates the estimated setting time using Eqs. (6) and (7) using curing temperature according to substitution rate of RP and CKD.
Overall, the setting time became more reduced when RP and CKD were substituted. In particular, the setting time was found to be much more significantly reduced at low‐temperature (5C°).
Based on the research findings, the initial and
final set time by curing temperature according to
substitution rate of RP and CKD can be estimated,
enabling a more effective quality control in
relation to setting reaction to be performed in the
field in the future.
0 1 2 3 4 5 6 7 8 9 10 11 12 13
0 1 2 3 4 5 6 7 8 9 10 11 12
0 5 10 15 20 25 30 35 40
0 1 2 3 4 5 6 7 8 9 10 11 12
RP 5%
Setting time(h)
Plain CKD 10%
CKD 20%
CKD 30%
RP 10%
Setting time(h)
Plain CKD 10%
CKD 20%
CKD 30%
RP 15%
Setting time(h)
Plain CKD 10%
CKD 20%
CKD 30%
Curing temperature(OC)
0 1 2 3 4 5 6 7 8 9 10 11 12 13
0 1 2 3 4 5 6 7 8 9 10 11 12
0 5 10 15 20 25 30 35 40
0 1 2 3 4 5 6 7 8 9 10 11 12
RP 5%
Plain CKD 10%
CKD 20%
CKD 30%
Setting time(h)
RP 10%
Plain CKD 10%
CKD 20%
CKD 30%
Setting time(h)
RP 15%
Plain CKD 10%
CKD 20%
CKD 30%
Curing temperature(OC)
Setting time(h)
1) Initial set 2) Final set
Figure 6. Relationship between curing temperature and setting time with the contents of RP and CKD
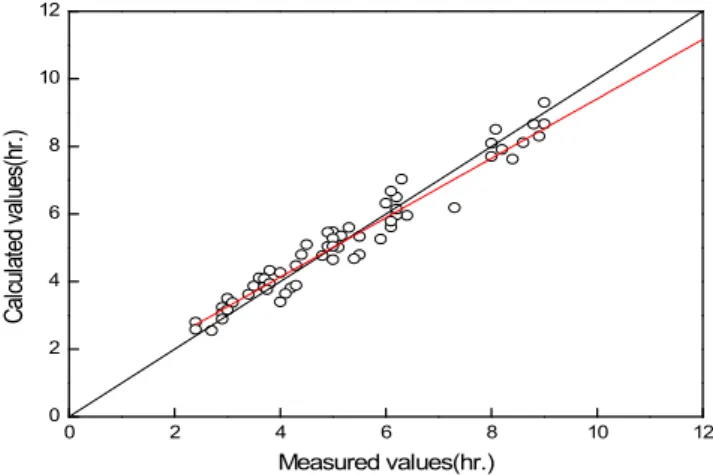
The results of a comparative analysis of the measured and estimated setting time data are shown in Figure 7. The setting time estimated in this research was shown to be similar to the measured one, on which basis the validity of the setting estimation model proposed in this research was verified. However, to perform a more accurate estimation than the model proposed in this study,
additional validation is also required by conducting a comparative analysis between the data obtained in this research and the measured setting time data using a different substitution rate of the same materials.
4. Conclusion
0 2 4 6 8 10 12 0
2 4 6 8 10 12
Calculated values(hr.)
Measured values(hr.)
Figure 7. Comparison of measured and calculated values
This paper proposes a method of estimating the setting time of cement mortar by reflecting the substitution rate of RP and CKD under various curing conditions. The research findings are as follows.
1) Although the substitution rate of RP was higher, there were no significant differences in setting time, though the setting time was shown to be reduced as the substitution rate of CKD became higher. In particular, at 5℃, a low curing temperature, when the RP and CKD were mixed, the setting time was found to be much more significantly reduced than f or plan mixture. When the mixture of RP and CKD is used in a low‐temperature condition, the setting time is expected to be shortened.
2) To estimate the setting time, E
awas calculated to be 9~18 KJ/mol, Ea of cement mortar with the mixture of RP and CKD was shown to be similar to or slightly higher than that of plan cement mortar, or to be slightly lower than or similar to that of cement mortar obtained in a previous study, which found that changes in Ea are not significant according to the substitution rate of RP and CKD.
3) Setting time estimation model and graphs using
equivalent age of cement mortar with a mixture of RP and CKD were presented, and a high correlation was found between the actually measured data and the estimations. This is expected to serve as useful data for the effective management of the setting time in the field in the future.
References
1. Kim JM, Kim KS, La JM, Choi DJ. Application of waste concrete powder as silica powder of cement extruding panel.
Journal of the Korean Recycled Construction Resources Institute. 2011 Mar;6(1):88‐94.
2. Hyeon C. Development and basic tests of lightweight aggregate made from waste concrete powder and spoil surplus earth for concrete. Journal of the Architectural Institute of Korea Structure & Construction. 2007 July;23(7):69‐77.
3. Choi MS. Status of disposal of construction waste and recycling. Symposium of construction waste disposal and production. In Proceeding of Technical Workshop on Manufacturing and Application of Construction Waste and Recycled Aggregates 2006. Seoul(Korea); KOREC:2006. p.1‐
30.
4. Kang SP, Cho KY, Lee J, Kim CO. A study on the properties of mortar using wet type waste sludge according to heating temperature. Journal of the Korean Recycled Construction Resources Institute. 2011 Mar;6(1):111‐19.
5. Han MC, Jeon KN. Effect of maximum size and contents method of recycled aggregate powder on engineering properties of the cement mortar. Journal of the Korean Recycled Construction Resources Institute. 2010 Dec;5(4):129‐
36.
6. Han CG, Kim SS, Hwang IS, Cha CS. Physical properties of cement kiln dust(CKD) and engineering properties of cement mortar incorporating CKD. Journal of the Architectural Institute of Korea Structure & Construction. 2004 Nov;20(11):83‐91.
7. Han CG, Kim SS, Hwang IS, Cha CS. Engineering properties of concrete with the replacement method of cement kiln dust.
Journal of the Architectural Institute of Korea Structure &
Construction. 2004 Mar;20(4):93‐1.
8. ASTM, Standard practice for estimating concrete strength by
maturity method(ASTM C 1074). Annual Book of ASTM Standards, Pennsylvania (US): ASTM; 2004. p. 273‐9.
9. Freisleben HP, Pederson J. Maturity computer for controlled curing and hardening of concrete strength. Nordisk Betong, 1977 Nov;1(19):21‐5.
10. Pinto RCA. Hover KC. Application of maturity approach to setting times. ACI Materials Journal. 1999 June;96(6):686‐91.
11. Han MC. Prediction of setting time of super retarding concrete incorporating blast furnace slag. Journal of the Architectural Institute of Korea Structure & Construction, 2006 Dec;22(12):87‐96.
12. Han MC, Han CG. Prediction of setting time of concrete using super retarding agent with maturity method. Journal of the Architectural Institute of Korea Structure &
Construction, 2005 May;21(5):105‐13.