A CFD ANALYSIS ON THE INFLUENCE OF OPERATING CONDITIONS AND EJECTOR CONFIGURATION ON THE
HYDRODYNAMICS AND MASS TRANSFER CHARACTERISTICS OF GAS-LIQUID EJECTOR
Tony Utomo *1 , Zen Hua Jin 1 , Chung Seub Yi 2 , Hyo Min Jeong 3 , Han Shik Chung 3
1 Graduate School, Department of Mechanical and Precision Engineering, Gyeongsang National University, Tongyeong, KOREA
2 Eco-Friendly Heat and Cold Energy Mechanical Research Team, Gyeongsang National University, Tongyeong, KOREA
3 School of Mechanical and Aerospace Engineering, Gyeongsang National University, Institute of Marine Science, Tongyeong, KOREA
[email protected]
Abstract
The purpose of this paper is to study the influence of operating condition and ejector geometries on the hydrodynamics and on the mass transfer characteristic of ejector. The CFD results were validated with available experimental data. Flow field analyses and predictions of ejector performance were also carried out. Variation on the operating conditions was made by varying the gas-liquid flow rate ratio in the range of 0.2 to 1.2. The ejector configuration was also varied on the length to diameter ratio of mixing tube (L M /D M ) in the range of 4 to 10. CFD studies show that at L M /D M 5.5, the volumetric mass transfer coefficient increases with respect to gas flow rates. Meanwhile, at L M /D M 4, the plot of volumetric mass transfer coefficient to gas-liquid flow rates ratio reach maximum at gas-liquid flow rates ratio of 0.6. This study also shows that volumetric mass transfer coefficient decrease with respect to the increase of mixing tube length.
INTRODUCTION
In the field of chemical and biochemical reaction engineering there has been increasing interest in jet loop reactors during the last decade, because of their high efficiency in gas dispersion resulting in high mass transfer rates. Hydrogenation and chlorination are examples of such application in chemical process industry that utilize jet loop reactor.
Other examples concerning the utilization of jet loop reactor can also be found in papers
[1, 2].
A standard ejector, shown schematically in Fig. 1, consists of a nozzle, suction chamber, mixing tube, diffuser and draft tube. Primary or motive fluid, typically liquid, is pumped into the system at high velocity through a nozzle. According to Bernoulli’s principle, a low-pressure region is created in the suction chamber. The secondary or entrained fluid, typically gas phase, gets sucked into this chamber. The gas and liquid phases get mixed and a gas-liquid dispersion is created in the mixing tube. A diffuser at the exit of the mixing tube helps in pressure recovery.
The effects of different operating conditions and ejectors geometry parameters on the performance of ejectors have been experimentally investigated by several researchers [3, 4]. Recently, with the rapid development of numerical solution method, some researchers attempted to apply Computational Fluid Dynamics (CFD) in modeling the flow within ejectors [5, 6]. However, most of them modeled the ejector in two- dimensional modeling.
In this study, a CFD package (STAR CD) was used to analyse a small water ejector which was equipped in an experimental mixing loop reactor. The ejector is modeled in three-dimensional geometry in order to get better agreement between simulation results and the real condition. The effects of operating conditions and geometries on its hydrodynamics and mass transfer characteristics were investigated and validated with actual values obtained from experiment.
CFD MODELING
In this research, 5 different model of ejector was build to investigate the influence of mixing tube length on the mass transfer characteristics. The ejector configuration used in the present study had a mixing tube diameter (D) of 22 mm and diffuser outlet diameter of 40 mm (i.e. diffuser angle of 3.5) and a draft tube length (L) of 100 mm.
The mixing tube lengths were varied as 88, 120, 150, 176 and 220 mm. The nozzle diameter used was 8.5 mm. The ejector geometry was modeled in a commercial CAD software package as describe in Fig. 2 with 395,240 cells.
The thermo physical properties of the working fluids were obtained at 293 K and 300 K respectively for water and air. The velocity applied at the inlet was based on the experimental measured volumetric flow rate which was 4 m 3 /h of water. The velocity of air was based on the Q G /Q L ratio in the range of 0.2 to 1.2.
Based on their experimental results, Dirix and van de Wiele [7] recommend empirical
correlations for mass transfer coefficient on the liquid side for a down flow ejector as
66 . 0 66
. 0 3 ( ) 10 4 .
5 ⎟⎟
⎠
⎜⎜ ⎞
⎝
∈ ⎛
×
= −
D N G
L d
a d
k ε (1)
RESULT AND DISCUSSION
Fig. 3 shows the effect of liquid flow rates on the inlet pressure, outlet pressure and suction pressure of the ejector. The circle dot mark represents the experiment data, while the solid line is obtained from CFD simulation. It can be seen that there is a good agreement between experiment and CFD data. Thus, the hydrodynamic parameter of CFD data is validated with respect to experiment data.
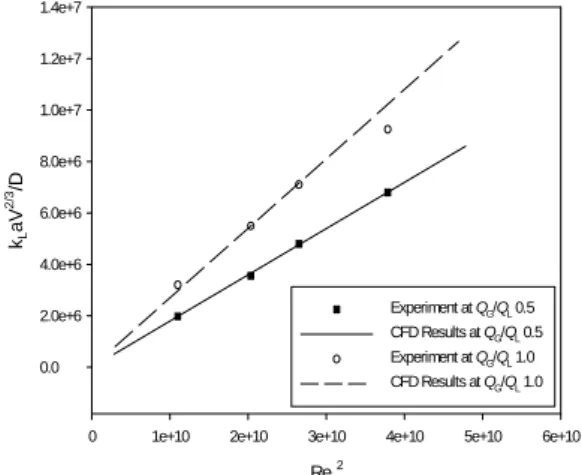
Fig. 4 shows the influence of Reynolds number at nozzle on the mass transfer number in the ejector. This graph is used to validate the CFD data in the manner of mass transfer characteristic. The experimental data is obtained from Dirix and Van de Wiele [7]. The results obtained from CFD have a good agreement with that of experiment. All of those validation data, hydrodynamic and mass transfer, indicate that the codes of simulation that have been used in this CFD studies are valid.
Fig. 5 shows the predicted pressure distribution at the centerline of the ejector for various Q G /Q L , with the axial locations from the tip of nozzle to the outlet of draft tube.
On the top of Fig. 5, mixing tube, diffuser and draft tube of ejector are also drawn. This graph indicates that the gas-liquid flow rate ratio influencing the jet break-up and the position of the mixing shock zone in the mixing tube.
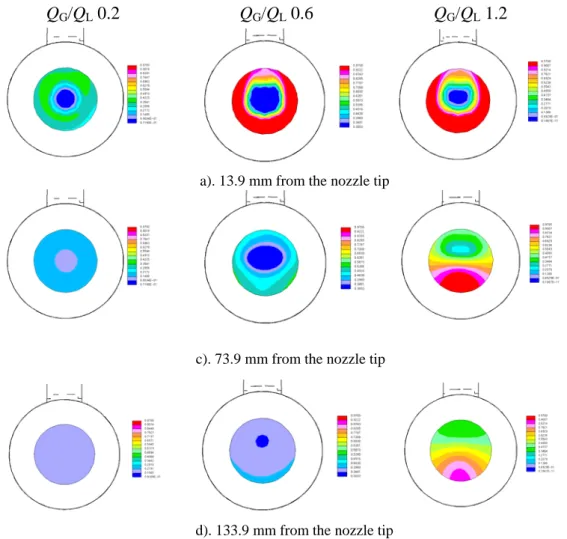
Fig. 6 shows the contour of air fraction as a secondary fluid in the water at various axial locations for Q G /Q L 0.2, 0.6 and 1.2. The axial locations are at 13.9, 73.9 and 133.9 mm down stream of the nozzle tip. At the entrance of mixing tube, the dispersion of gas phase into liquid phase is almost complete at Q G /Q L 0.2, while at Q G /Q L 0.6 and Q G /Q L 1.2 the gas phase build the coaxial annular gas flow around the core of primary fluid jet. However, the dispersion of a small part of gas takes place at the top side of the mixing tube. When the cross sectional area of observation is shifted down stream at 73.9 mm from the nozzle tip, or in the middle of the mixing tube, the two phases are completely mixed and become homogeneous flow at Q G /Q L 0.2. Meanwhile at Q G /Q L
0.6 the mixing phenomenon is almost complete, at Q G /Q L 1.2 the gas stream at the bottom of the illustration figure of mixing tube decrease to smaller part and the mixing is still growing up on process. Finally, at the exit of mixing tube, the flow become completely homogeneous for Q G /Q L 0.2 as mentioned previously and also for Q G /Q L
0.6. In contrast with the results from those gas-liquid flow rates ratios, at Q G /Q L 1.2, the
flow pattern describes that the mixing is still in progress and homogeneous flow is not yet obtained.
Fig. 7 clearly illustrates that the ejector with longer mixing tube ratio creates lower volumetric mass transfer coefficients compared to the ejector with a shorter mixing tube.
CONCLUSIONS
From this study, it can be concluded that the gas-liquid flow rates ratio has a significant effect on the hydrodynamics and mass transfer characteristics of ejector. In this research, the volumetric mass transfer coefficient increases with respect to the gas flow rates on the ejector with the minimum length of mixing tube of 120 mm (L M /D M 5.5). At the ejector with mixing tube length of 88 mm (L M /D M 4), the volumetric mass transfer coefficient reach maximum at gas-liquid flow rates ratio of 0.6. Further increase of gas- liquid flow rates ratio resulted in the volumetric mass transfer coefficient reduction.
From the present investigation, it also can be concluded that the mixing tube length influences the volumetric mass transfer coefficient of ejector. The volumetric mass transfer coefficient decreases proportional to the increase of mixing tube length.
ACKNOWLEDGEMENT
The authors gratefully acknowledge the financial support provided by Korea Heat and Fluid Technology, The Ministry of Commerce, Industry and Energy (MOCIE) and Korea Industrial Technology Foundation (KOTEF) through The Human Resource Training Project for Regional Innovation and Second Phase of BK21 project in GSNU.
REFERENCES
[1] Cramers P.H.M.R., Beeneckers A.A.C.M.and van Direndonck L.L., 1992,”Hydrodynamics and Mass Transfer Characteristics of Loop-Venturi Reactor with a Downflow liquid Jet Ejector,” Chem. Engng Sci. Vol. 47, pp.
3557~3564.
[2] Jeong, H.M., Chung, H.S., Bae, K.Y., Kim, S.H. and Shin, Y.S., 2005, “Water cooling characteristics in an enclosed vacuum tank by water driven ejector,” Journal of Mechanical Science and Technology, Vol. 19, No. 1, pp. 164~172.
[3] Cramers P.H.M.R., van Direndonck L.L. and Beeneckers A.A.C.M., 1992,”Influence of the gas density on the
gas entrainment rate and gas hold-up in loop-venture reactors,” Chem. Engng Sci. Vol. 47, pp. 2251~2256.
[4] Cramers P.H.M.R. and Beeneckers A.A.C.M., 2001, “Influence of the ejector configuration, scale and the gas density on the mass transfer characteristics of gas-liquid ejectors,” Chem. Engng Sci. Vol. 82, pp. 131~141.
[5] Riffat, S.B. and Omer, S.A., 2001, “CFD modeling and experimental investigation of an ejector refrigeration system using methanol as the working fluid,” International Journal of Energy Reservation, Vol. 25, pp.
115~128.
[6] Sriveerakul, T., Aphornratana, S.,and Chunnanond, K., 2006, “Performance prediction of steam ejector using computational fluid dynamics: Part 1. Validation of the CFD results,” International Journal of Thermal Sciences, The SCI. 2553, Article in press.
[7] Dirix C.A.M.C. and K. van der Wiele, 1990, “Mass Transfer in Jet Loop Reactor,” Chem. Engng Sci., Vol. 45, pp. 2333~2340.
Fig. 1. Scheme of ejector .
Q
L(lpm)
65 70 75 80 85 90 95
Pres sure (bar)
0.0 0.5 1.0 1.5 2.0 2.5 3.0 3.5
Q
L(lpm) vs P inlet ( Experiment) Q
L(lpm) vs P inlet (CFD) Q
L(lpm) vs P outlet (Experiment) Q
L(lpm) vs P outket (CFD) Q
L(lpm) vs P suction (Experiment) Q
L(lpm) vs P suction (CFD)
Fig. 3. The influence of liquid flow rate on inlet pressure, outlet pressure and suct ion pressure of ejector.
Fig. 2. The ejector model with trim cell mesh eneration (inset: real ejector).
Re
n20 1e+10 2e+10 3e+10 4e+10 5e+10 6e+10
k
LaV
2/3/D
0.0 2.0e+6 4.0e+6 6.0e+6 8.0e+6 1.0e+7 1.2e+7 1.4e+7
Experiment at Q
G/Q
L0.5 CFD Results at Q
G/Q
L0.5 Experiment at Q
G/Q
L1.0 CFD Results at Q
G/Q
L1.0
Fig. 4. Influence of Reynolds number on mass transfer in the ejector.
Diffuser
Mixing tube Nozzle
Gas suction chamber
Draft tube Gas
Liquid
Axial distanace along ejector (m)
0.0 0.1 0.2 0.3
Pr es sure (P a)
4.0e+4 6.0e+4 8.0e+4 1.0e+5 1.2e+5 1.4e+5 1.6e+5
QG
/Q
L0.2
QG/Q
L0.4
QG/Q
L0.6
QG/Q
L0.8
QG/Q
L1.0
QG/Q
L1.2
Fig. 5. Pressure distribution along the eje ctor for various QG/QL.
Gas-liquid flow rates ratio
0.2 0.4 0.6 0.8 1.0 1.2
k
La (1 /s )
0.02 0.03 0.04 0.05 0.06 0.07 0.08
LM/DM 4.0 LM/DM 5.5 LM/DM 6.8 LM/DM 1.0 LM/DM 1.2