JNM Journal of Neurogastroenterology and Motility
Constipation Misperception Is Associated With Gender, Marital Status, Treatment Utilization and Constipation Symptoms Experienced
Tae Hee Lee,1 Suck Chei Choi,2* Moo In Park,3 Kyung Sik Park,4 Jeong Eun Shin,5 Seong-Eun Kim,6 Kee Wook Jung,7 Hoon Sup Koo,8 Wan Jung Kim,9 Young Kwan Cho,10 Yeon Soo Kim11 and Ji Sung Lee12; Constipation Group of the Korean Society of Neurogastroenterology and Motility
1Institute for Digestive Research, Digestive Disease Center, Soonchunhyang University Hospital, Seoul, Korea; 2Department of Internal Medicine and Digestive Disease Research Institute, Wonkwang University College of Medicine, Iksan, Korea;3Department of Internal Medicine, Kosin University College of Medicine, Busan, Korea; 4Department of Internal Medicine, Keimyung University College of Medicine, Daegu, Korea;
5Division of Gastroenterology, Department of Internal Medicine, Dankook University Hospital, Dankook University College of Medicine, Cheonan, Chungcheongnam-do, Korea;6Department of Internal Medicine, Ewha Mokdong Hospital, Ewha Womans University School of Medicine, Seoul, Korea: 7Asan Digestive Disease Research Institute, Department of Gastroenterology, Asan Medical Center, University of Ulsan College of Medicine, Seoul, Korea; 8Department of Internal Medicine, Konyang University College of Medicine, Daejeon, Korea; 9Department of Internal Medicine, Soonchunhyan University Gumi Hospital, Gumi, Korea;10Department of Internal Medicine, Eulji General Hospital, Eulji University College of Medicine, Seoul, Korea; 11Department of Internal Medicine, Hallym University College of Medicine, Chuncheon Sacred Heart Hospital, Gangwon-do, Korea; and 12Biostatistical Consulting Unit, Soonchunhyang University Medical Center, Seoul, Korea
Background/Aims
It is essential that clinicians have an understanding of patients’ perceptions of constipation as well as constipation mis- perception (CM), which can be defined as failure to recognize the six constipation symptoms (infrequency, straining, hard stool, incomplete evacuation, anorectal obstruction or manual maneuver). The aims of our study were to identify the prevalence of CM and its association with demographics and clinical features.
Methods
This nationwide survey included 625 self-reported constipated subjects (431 females; mean age, 41.2 years) among random participants in the National Health Screening Program. The prevalence of CM for each constipation symptom was estimated, and the participants were classified into nil (0), low (1-2), mid (3-4) and high (5-6) level CM subgroups according to the num - ber of misperceived symptoms.
Results
The highest rate of CM was observed for manual maneuver (48.3%), followed by anorectal obstruction (38.4%), stool in- frequency (34.6%), incomplete evacuation (32.2%), hard stool (27.2%) and straining (25.4%). Among the nil (n = 153), low
Received: February 9, 2014 Revised: April 1, 2014 Accepted: April 1, 2014
CC This is an Open Access article distributed under the terms of the Creative Commons Attribution Non-Commercial License (http://creativecommons.
org/licenses/by-nc/3.0) which permits unrestricted non-commercial use, distribution, and reproduction in any medium, provided the original work is properly cited.
*Correspondence: Suck Chei Choi, PhD, MD
Department of Internal Medicine and Digestive Disease Research Institute, Wonkwang University College of Medicine, 460 Iksan-daero, Iksan 570-974, Korea
Tel: +82-63-859-2563, Fax: +82-63-855-2025, E-mail: [email protected] Financial support: None.
Conflicts of interest: None.
Author contributions: Tae Hee Lee and Suck Chei Choi contributed equally to this work. Tae Hee Lee, Suck Chei Choi, Moo In Park, Kyung Sik Park, Jeong Eun Shin, Seong-Eun Kim, Hoon Sup Koo, Wan Jung Kim and Young Kwan Cho collected data and drafted the paper;
Kee Wook Jung edited the paper; Yeon Soo Kim reviewed data analysis; Ji Sung Lee performed statistical analyses.
ORCID: Tae Hee Lee, http://orcid.org/0000-0003-3049-8252.
(n = 242), mid (n = 144) and high level (n = 86) subgroups, there were significant differences in the proportions of males (18.3%, 34.3%, 39.6% and 30.2%; P = 0.001, respectively), never-married status (25.7%, 38.2%, 36.8% and 45.9%; P = 0.030, respectively) and those who did not receive treatment for constipation (41.8%, 47.5%, 58.3% and 66.3%; P < 0.001, respectively). There was a significant linear trend of increasing degree of CM with decreasing symptoms experienced (P <
0.001).
Conclusions
CM is significantly associated with gender, marital status, treatment utilization and the range of constipation symptoms experienced.
(J Neurogastroenterol Motil 2014;20:379-387) Key Words
Constipation; Health surveys; Perception
Introduction
Constipation is a major public health issue because of its high prevalence, economic cost, and adverse effects on quality of life and health status.1 It is not a specific disease but a general term that describes a wide range of symptoms associated with strain- ing, hard stools, incomplete evacuation, anorectal obstruction, manual maneuvers or infrequent stools.2 Additionally, individuals experience symptoms of constipation differently.3,4 Although phy- sicians focus on the infrequency of stools, patients are more con- cerned with ease of passage and consistency of stools rather than frequency.5-8 Their perception of constipation might contribute to some of the variability in reported constipation symptoms. For example, some individuals with < 3 bowel movements per week do not consider themselves constipated, while others with daily bowel movements report constipation. The definition of con- stipation has little correlation reported between physicians and patients.9,10 While a detailed evaluation of reported symptoms in patients with self-reported constipation has been reported, minimal data are available on the perceptions of constipated patients.3,4,9
Some patients do not think that constipation symptoms could be anything serious or that they require evaluation by a physician.
Furthermore, some patients believe that the symptoms are simply a part of the bowel experience rather than what physicians define as constipation. These observations suggest that some patients lack knowledge of the definition of constipation. They are not educated, and physicians do not have the time to educate them.
Constipated patients could develop a new understanding of con- stipation through the Internet, but obviously, some websites con- tain misleading information.
For this study, constipation misperception (CM) among
constipated individuals was defined as the failure to recognize that stool infrequency, straining, hard stool, incomplete evacua- tion, anorectal obstruction or manual maneuver are symptoms of constipation. CM may be an important barrier to the effective treatment and prevention of constipation, because a key to opti- mizing care for patients with constipation is to recognize its presence. In this context, it is essential that clinicians have a better understanding of CM. To the best of our knowledge, previous studies have not described either the prevalence of CM or its as- sociation with demographics, symptoms experienced, or types of treatment utilization.
Materials and Methods Subjects
This survey population consisted of random contributors who participated between January 10 and June 30, 2012 in the National Health Screening Program (NHSP), which is available to most Koreans at least every other year.11 Recruits were eligible to participate in this study if they were ≥ 20 years of age, consid- ered themselves constipated, and completed > 80% of the items in our questionnaire. Subjects were excluded from the study if they were illiterate, blind, unwilling to participate in the study, or if they had received a physician’s diagnosis of irritable bowel syn- drome (IBS) or secondary constipation. The participants in the study did not receive any reimbursement. The principal inves- tigator (SCC) covered the material costs. All participants pro- vided written informed consent prior to the study. The Institu- tional Review Boards of Soonchunhyang University Seoul Hospital, South Korea approved the study protocol (SCH Seoul IRB-2012-009).
Table 1. Demographics and Clinical Features of Respondents Sex
Male 194 (31.0)
Female 431 (69.0)
Age (yr)
Mean (SD) 41.2 (15.5)
Range 20–89
Body mass index Mean (SD) 22.3 (3.0)
Alcohol
Yes 148 (23.9)
No 472 (76.1)
Smoking
Yes 321 (51.7)
No 300 (48.3)
Marital status
Married 354 (56.9)
Widowed/divorced/separated 45 (7.2)
Never married 223 (35.9)
Education level
Low 303 (48.6)
High 320 (51.4)
Regular exercise
Yes 99 (26.5)
No 275 (73.5)
Occupation
White collar 288 (56.0)
Blue collar 80 (15.5)
None 147 (28.5)
Co-morbidity
Yes 175 (28.8)
No 432 (71.2)
Medications
Yes 162 (26.8)
No 442 (73.2)
Symptoms experienced
Defecation < 3 times/wk 363 (58.9)
Hard stool ≥ 25% 359 (58.9)
Straining ≥ 25% 400 (64.6)
Sensation of incomplete evacuation ≥ 25% 392 (64.2) Sensation of anorectal obstruction ≥ 25% 243 (39.5) Manual maneuvers to facilitate ≥ 25% 91 (14.8) Number of symptoms experienced
Rome III-0/6 30 (4.8)
Rome III-1/6 110 (17.6)
Rome III-2/6 116 (18.6)
Rome III-3/6 133 (21.3)
Rome III-4/6 123 (19.7)
Rome III-5/6 63 (10.1)
Rome III-6/6 50 (8.0)
Treatment received within the previous 6 months
No treatment 320 (51.2)
Physician visit 98 (15.7)
Self treatment 207 (33.1)
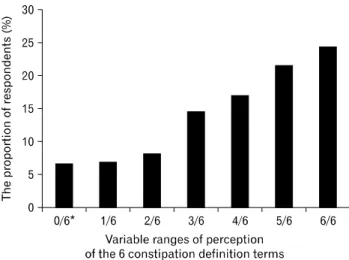
Figure 1. Proportion of respondents based on the number with constipation perception for each of the 6 constipation symptoms. *Those who did not perceive any of the 6 symptoms as constipation.
Questionnaire
The main questionnaire comprised three parts. The first part was designed to elicit demographic data (age, sex, body mass in- dex, alcohol use, smoking history, marital status, educational lev- el, regular exercise and occupation). Marital status was catego- rized as married, widowed/divorced/separated, or never married.
Educational level was dichotomized based on completed educa- tion: low (high school graduate or less) and high (college or more) levels. Occupation was classified as white collar, blue collar or none. White collar refers to a person who performs pro- fessional, managerial or administrative work, in contrast to a blue collar worker, whose job requires manual labor.
The second part addressed clinical data including co-mor- bidity, use of constipation treatment within the past 6 months, and 6 symptoms of Rome III functional constipation. The type of treatment utilization was divided into no treatment (no con- stipation relief therapy), physician visit (prescription medication or biofeedback therapy), and self-treatment (trial of over-the- counter medication, Oriental medication or a folk remedy for the relief of constipation).
In the final portion of the questionnaire, participants were asked to rate their opinions on a series of statements regarding the definition of constipation on a 5-point Likert scale (strongly agree, agree, undecided, disagree and strongly disagree). These statements included 6 items: (1) having fewer than three defeca- tions per week (infrequency), (2) applying too much effort to pass stool (straining), (3) having hard stool (hard stool), (4) sensation of anorectal obstruction or blockage (anorectal obstruction), (5) sensation of incomplete emptying of the bowel (incomplete evac- uation) and (6) using fingers to help empty your bowel (manual maneuver). Data collection relied on paper-and-pencil admin- istration by interviewers or self-administration by respondents.
Data Analysis
For each of the six statements regarding the definition of constipation, a negative response (“strongly disagree,” “disagree”
and “undecided”) was defined as CM. Based on the number of CM cases, the subjects were classified into nil (0), low (1-2), mid (3-4) and high (5-6) CM groups.
Statistical Methods
Summary statistics such as mean values, standard deviations for continuous variables, and counts and percentages for catego- rical variables and confidence intervals, when appropriate, were
calculated. The prevalence of CM was estimated for constipated Korean adult participants. Characteristics of the nil, low, mid, and high level groups were compared using the Chi-square test for categorical variables and analysis of variance (ANOVA) for continuous variables as appropriate. All analyses were performed using the Statistical Package for the Social Sciences (SPSS, ver- sion 12.0, Chicago, IL, USA). P-values < 0.05 were considered indicative of statistical significance.
Results
The 835 subjects were random participants in the NHSP who considered themselves constipated. Of these respondents, 625 (74.9%) were eligible. Table 1 shows the demographic and clinical findings of all respondents. Their mean age was 41.2 (range, 20-89) years, and 431 (69.0%) were females. The most commonly experienced symptom was straining (64.6%), followed by incomplete evacuation (64.2%), infrequency (58.9%), hard stool (58.9%), anorectal obstruction (39.5%) and manual maneu- ver (14.8%). Overall, 62.3% reported a ≥ 6-month history of constipation symptoms, 51.2% did not receive constipation relief therapy, 15.7% received prescription medication (including bio- feedback therapy) and 33.1% were self-treated with over-the-coun- ter medications, Oriental medications, or folk remedies.
Figure 1 shows variable ranges of perception of constipation in our respondents. For each of the 6 statements regarding the definition of constipation, a positive response (“strongly agree” or
“agree”) was defined as constipation perception. Based on the
Figure 2. The rate of constipation misperception for 6 constipation symptoms.
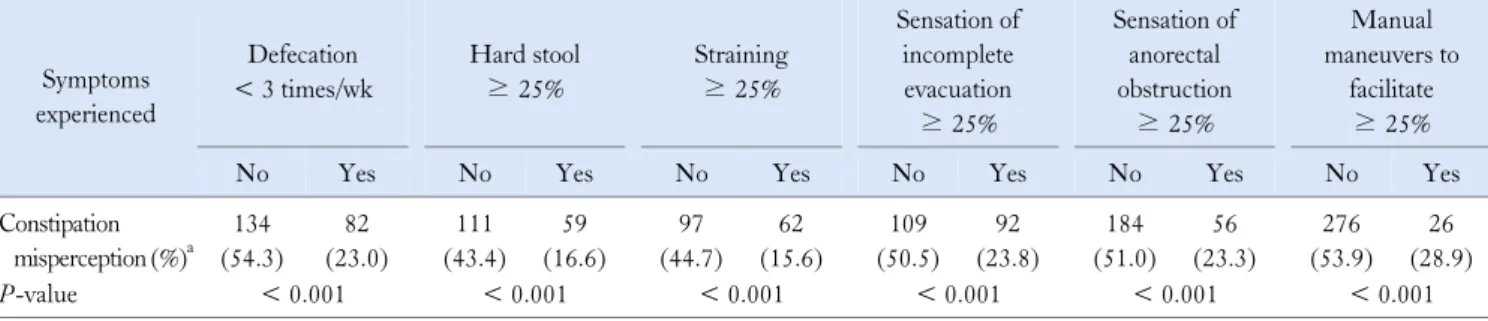
Table 2. Comparison of Constipation Misperception for the Relevant Symptoms Based on Each Symptom Experienced
Symptoms experienced
Defecation
< 3 times/wk
Hard stool
≥ 25%
Straining
≥ 25%
Sensation of incomplete evacuation
≥ 25%
Sensation of anorectal obstruction
≥ 25%
Manual maneuvers to
facilitate
≥ 25%
No Yes No Yes No Yes No Yes No Yes No Yes
Constipation misperception (%)a
134 (54.3)
82 (23.0)
111 (43.4)
59 (16.6)
97 (44.7)
62 (15.6)
109 (50.5)
92 (23.8)
184 (51.0)
56 (23.3)
276 (53.9)
26 (28.9)
P-value < 0.001 < 0.001 < 0.001 < 0.001 < 0.001 < 0.001
aConstipation misperception indicates failure to recognize the relevant symptom for each symptom experienced.
P-value by Chi-square test.
number of constipation perception cases, the 0/6 (those who did not perceive any of the 6 symptoms as constipation), 1/6, 2/6, 3/6, 4/6, 5/6 and 6/6 subgroups accounted for 6.7%, 7.0%, 8.3%, 14.7%, 17.1%, 21.6% and 24.5% , respectively.
The Prevalence of Constipation Misperception
Figure 2 shows the proportion of participants who had CM for each of the constipation definition terms. The highest rate of CM was observed for manual maneuver (302/625, 48.3%), fol- lowed by anorectal obstruction (240/625, 38.4%), stool in- frequency (216/625, 34.6%), incomplete evacuation (201/625, 32.2%), hard stool (170/625, 27.2%) and straining (159/625, 25.4%).
According to the number of CMs, the proportions of CM-0/6 (those who perceived all 6 symptoms as constipation), CM-1/6, CM-2/6, CM-3/6, CM-4/6, CM-5/6 and CM-6/6 were 24.5%, 21.6%, 17.1%, 14.7%, 8.3%, 7.0% and 6.7%, respectively.
Comparison of Constipation Misperceptions Based on Each Symptom Experienced
Table 2 shows a comparison of CMs for the relevant symp- toms based on the presence of each symptom experienced. Those who did not experience defecation < 3 times/week had a sig- nificantly higher rate of CM for infrequency, compared with those who did experience it (54.3% vs. 23%, P < 0.001). Those who did not report hard stool ≥ 25% had a significantly higher rate of CM for hard stool, compared with those who did report it (43.4% vs. 16.6%, P < 0.001). Those who did not experience straining ≥ 25% had a significantly higher rate of CM for straining, compared with those who did experience it (44.7% vs.
15.6%, P < 0.001). Those who did not report sensation of in- complete evacuation ≥ 25% had a significantly higher rate of
CM for incomplete evacuation, compared to those who did re- port it (50.5% vs. 23.8%, P < 0.001). Those who did not experi- ence the sensation of anorectal obstruction ≥ 25% had a sig- nificantly higher rate of CM for anorectal obstruction, compared with those who did experience it (51% vs. 23.3%, P < 0.001).
Those who did not report manual maneuvers to facilitate defeca- tion ≥ 25% had a significantly higher rate of CM for manual support, compared with those who did report them (53.9% vs.
28.9%, P < 0.001).
Characteristics of Participants According to the Level of Constipation Misperception
The proportions of participants in the nil, low, mid and high level subgroups were 24.5%, 38.6%, 23.1% and 13.8%, respec- tively. There were significant differences in gender, marital sta-
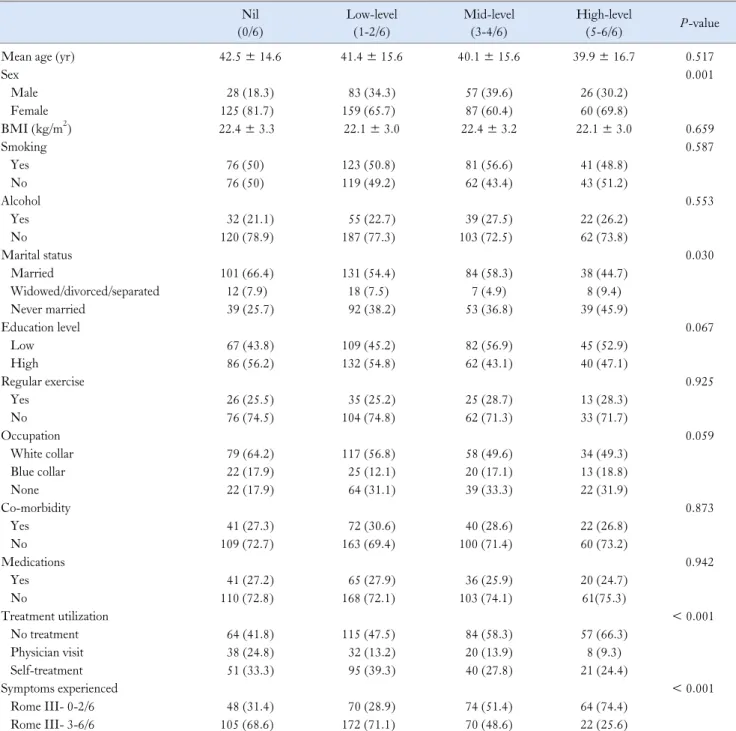
Table 3. Demographics and Clinical Features According to Level of Constipation Misperception
Nil
(0/6)
Low-level (1-2/6)
Mid-level (3-4/6)
High-level
(5-6/6) P-value
Mean age (yr) 42.5 ± 14.6 41.4 ± 15.6 40.1 ± 15.6 39.9 ± 16.7 0.517
Sex 0.001
Male 28 (18.3) 83 (34.3) 57 (39.6) 26 (30.2)
Female 125 (81.7) 159 (65.7) 87 (60.4) 60 (69.8)
BMI (kg/m2) 22.4 ± 3.3 22.1 ± 3.0 22.4 ± 3.2 22.1 ± 3.0 0.659
Smoking 0.587
Yes 76 (50) 123 (50.8) 81 (56.6) 41 (48.8)
No 76 (50) 119 (49.2) 62 (43.4) 43 (51.2)
Alcohol 0.553
Yes 32 (21.1) 55 (22.7) 39 (27.5) 22 (26.2)
No 120 (78.9) 187 (77.3) 103 (72.5) 62 (73.8)
Marital status 0.030
Married 101 (66.4) 131 (54.4) 84 (58.3) 38 (44.7)
Widowed/divorced/separated 12 (7.9) 18 (7.5) 7 (4.9) 8 (9.4)
Never married 39 (25.7) 92 (38.2) 53 (36.8) 39 (45.9)
Education level 0.067
Low 67 (43.8) 109 (45.2) 82 (56.9) 45 (52.9)
High 86 (56.2) 132 (54.8) 62 (43.1) 40 (47.1)
Regular exercise 0.925
Yes 26 (25.5) 35 (25.2) 25 (28.7) 13 (28.3)
No 76 (74.5) 104 (74.8) 62 (71.3) 33 (71.7)
Occupation 0.059
White collar 79 (64.2) 117 (56.8) 58 (49.6) 34 (49.3)
Blue collar 22 (17.9) 25 (12.1) 20 (17.1) 13 (18.8)
None 22 (17.9) 64 (31.1) 39 (33.3) 22 (31.9)
Co-morbidity 0.873
Yes 41 (27.3) 72 (30.6) 40 (28.6) 22 (26.8)
No 109 (72.7) 163 (69.4) 100 (71.4) 60 (73.2)
Medications 0.942
Yes 41 (27.2) 65 (27.9) 36 (25.9) 20 (24.7)
No 110 (72.8) 168 (72.1) 103 (74.1) 61(75.3)
Treatment utilization < 0.001
No treatment 64 (41.8) 115 (47.5) 84 (58.3) 57 (66.3)
Physician visit 38 (24.8) 32 (13.2) 20 (13.9) 8 (9.3)
Self-treatment 51 (33.3) 95 (39.3) 40 (27.8) 21 (24.4)
Symptoms experienced < 0.001
Rome III- 0-2/6 48 (31.4) 70 (28.9) 74 (51.4) 64 (74.4)
Rome III- 3-6/6 105 (68.6) 172 (71.1) 70 (48.6) 22 (25.6)
BMI, body mass index.
Values represent the number of patients (%) or means ± SD, unless otherwise indicated. P-values were calculated by ANOVA, Pearson’s Chi-square test or linear trend test, as appropriate.
tus, treatment utilization, and the range of symptoms experienced among the 4 subgroups (Table 3). A significant difference was observed in the proportion of males among the 4 subgroups (18.3%, 34.3%, 39.6% and 30.2%; P = 0.001, respectively). The proportion of never married participants was increased sig-
nificantly from the nil (25.7%) to high (45.9%) subgroups (P = 0.030). There was a significant difference in the proportion of
“no treatment” responses among the subgroups (41.8%, 47.5%, 58.3% and 66.3%; P < 0.001, respectively). The proportions of nil, low, mid and high level subgroups among those who experi-
enced fewer than three constipated symptoms (Rome III-0-2/6) were 31.4%, 28.9%, 51.4% and 74.4%, respectively. In contrast, the proportions of nil, low, mid and high level subgroups among those who had more than 3 constipated symptoms were 68.6%, 71.1%, 48.6% and 25.6%, respectively. There was a significant linear trend of increasing CM level with decreasing symptoms experienced (P < 0.001).
Discussion
This nationwide South Korean survey is the first study to show how adults with self-reported constipation differentially perceive constipation. The data provide information relevant to CM as a unique challenge and novel potential target in the con- stipation treatment paradigm. Previous studies have reported on the different constipation symptoms experienced among in- dividuals as well as the different perceptions between physicians and patients. However, no previous study has described the dem- ographics and clinical features associated with CM.
Taking into account the previous studies,5-8 it is not surpris- ing that the rates of CM on subjective items (i.e., straining and hard stools) were lower compared with those of the objective item (infrequent stool). It should be noted that approximately 37% of patients with self-reported constipation had greater than mid-lev- el CM. This knowledge deficit may be compounded by less dis- cussion about constipation during physician appointments, which then may impede effective treatment and prevention for con- stipated patients with CM. On the other hand, a condition that the physician does not define as constipation may be mistaken for constipation by patients with self-reported constipation. In this situation, inadequate counseling by physicians may contribute to inappropriate health interventions. Therefore, CM is not only an interesting phenomenon but also has important public health implications.
The majority of studies report a higher prevalence of con- stipation in females than in males, with a median female-to-male ratio of 2.2.12 Interestingly, higher ratios were observed in studies that relied on self-reported constipation (mean = 2.65) rather than the Rome criteria (mean = 1.5). These findings suggest that there might be gender-specific differences in the perceptions about constipation. Contradictory information exists about gen- der-based differences in constipation symptoms experienced.13-16 In the present study, the symptoms experienced were comparable between males and females (data not shown), but the CM level was significantly higher in male participants. This result explains
why females have a higher prevalence of constipation than males, particularly in epidemiologic studies that rely on self-reported constipation.
To our knowledge, marital status does not influence the de- velopment of chronic constipation.17 In our study, marital status significantly affected the level of CM. Married individuals may have better recognition of constipation symptoms because we sur- mised that their potentially constipated spouses might inform or counsel these individuals about constipation.
In our study, we found a significant linear trend between an increasing level of CM and a decline in the symptoms experi- enceed. It is not surprising that symptoms experienced impact the perception of constipation. With respect to each of the 6 con- stipation symptoms, there was a significantly higher rate of CM in those who did not experience each of them. However, there was also a mismatch between their perception and experience for each constipation symptom. For example, 16.6% of those who ex- perienced hard stools did not recognize hard stools as a con- stipation symptom. They might perceive hard stools as just mild discomfort rather than a more bothersome constipation symptom.
In fact, the most severe symptom differed among individuals with constipation. Therefore, this mismatch might suggest that se- verity of constipation symptoms affects their perception.
Interestingly, 4.8% (30/625) of participants felt that they had constipation yet did not complain of any constipation symptoms.
Furthermore, 80% of them failed to recognize any of the six con- stipation symptoms as constipation. These patients’ “constipa- tion” may be the result of their different perceptions or expect- ations of what it is to have normal bowel function. For example, individuals might perceive that if they do not have normal bowel function, they will feel bloating. If they experience bloating, they consider themselves constipated despite the absence of the symp- toms that physicians typically use to define constipation (strain- ing, hard stools, infrequent stools and incomplete evacuation etc.).
A preliminary study reported that bloating was the most common and bothersome complaint in Chinese and Indian patients.18 Furthermore, several medical conditions (e.g., anal fissure, IBS and hemorrhoids) commonly occur in these patients. In this con- text, some patients sometimes use the term “constipation” to de- scribe painful defecation, which is usually the consequence of anal fissure disease. These reports indicate that the variety of present- ing symptoms associated with chronic constipation may pose a significant challenge for diagnosis if the clinician does not recog- nize the connection among the complaints.
Although constipation is a common problem, only a small
portion of constipated patients seeks medical care. When con- stipated patients were asked their reasons for not seeking health care, 36% said that they did not consider their condition to be se- vere, while 22% did not consider themselves constipated.3 Our study showed that the CM level is higher in those who did not re- ceive any treatment for constipation relief. These findings in- dicate that CM is an important factor affecting treatment behavior. Therefore, physicians must not only identify and coun- sel constipated patients with CM in the clinical setting but also partner with public health and community advocates to develop treatment programs that reach these individuals in their own communities.
There were 2 limitations in the present study. First, con- stipated individuals with IBS or secondary causes may have been included in the present study, even though we excluded partic- ipants with a physician’s diagnosis of IBS or secondary consti- pation. However, observational studies and expert opinions in- dicate that functional constipation frequently overlaps with IBS with functional constipation.19 In some patients, it may be diffi- cult, if not impossible, to differentiate functional constipation and IBS accurately and reliably. Second, our study did not reveal whether differences in perception exist between constipated pa- tients with or without self-reported constipation and non-con- stipated subjects. However, it is important to recognize the per- ception of constipation in self-reporting patients, because in- dividuals who do not identify themselves as constipated are un- likely to experience a social and economic burden due to the condition.
In our study, the study population consited of individuals who participated in the NHSP, which is available to most Koreans at least every alternate year. Most Korean health care practitioners are highly likely to agree that they are representative of the Korean population. Given our study population, our find- ings are unlikely to limit the genealizability of Korean patient’s views on constipation. However, these findings might not be con- sistent across all Asian populations because of racial and socio- demographic differences.
In conclusion, adults with self-reported constipation perceive constipation differently. A large portion has a varying degree of CM, which is significantly associated with gender, marital status, treatment behavior and the range of symptoms experienced. This study enhances our understanding of the epidemiology of consti- pation. Furthermore, our findings may be useful for patient edu- cation in clinical practice or for developing programs to increase public awareness about constipation. Acknowledging and in-
corporating the findings into clinical practice will increase the quality of management for constipated patients.
References
1. Talley NJ. Definitions, epidemiology, and impact of chronic consti- pation. Rev Gastroenterol Disord 2004;4(suppl 2):S3-S10.
2. Longstreth GF, Thompson WG, Chey WD, Houghton LA, Mearin F, Spiller RC. Functional bowel disorders. Gastroenterology 2006;
130:1480-1491.
3. Pare P, Ferrazzi S, Thompson WG, Irvine EJ, Rance L. An epi- demiological survey of constipation in canada: definitions, rates, de- mographics, and predictors of health care seeking. Am J Gastroenterol 2001;96:3130-3137.
4. Johanson JF, Kralstein J. Chronic constipation: a survey of the pa- tient perspective. Aliment Pharmacol Ther 2007;25:599-608.
5. Wald A. Diagnosis of constipation in primary and secondary care.
Rev Gastroenterol Disord 2004;4(suppl 2):S28-S33.
6. Walter S, Hallböök O, Gotthard R, Bergmark M, Sjödahl R. A population-based study on bowel habits in a Swedish community:
prevalence of faecal incontinence and constipation. Scand J Gastroen- terol 2002;37:911-916.
7. Sandler RS, Drossman DA. Bowel habits in young adults not seek- ing health care. Dig Dis Sci 1987;32:841-845.
8. Harari D, Gurwitz JH, Avorn J, Bohn R, Minaker KL. How do older persons define constipation? Implications for therapeutic man- agement. J Gen Intern Med 1997;12:63-66.
9. Herz MJ, Kahan E, Zalevski S, Aframian R, Kuznitz D, Reichman S. Constipation: a different entity for patients and doctors. Fam Pract 1996;13:156-159.
10. Wolfsen CR, Barker JC, Mitteness LS. Constipation in the daily lives of frail elderly people. Arch Fam Med 1993;2:853-858.
11. Kim HS, Shin DW, Lee WC, Kim YT, Cho B. National screening program for transitional ages in Korea: a new screening for strength- ening primary prevention and follow-up care. J Korean Med Sci 2012;27(suppl):S70-S75.
12. Higgins PD, Johanson JF. Epidemiology of constipation in North America: a systematic review. Am J Gastroenterol 2004;99:750-759.
13. Everhart JE, Go VL, Johannes RS, Fitzsimmons SC, Roth HP, White LR. A longitudinal survey of self-reported bowel habits in the United States. Dig Dis Sci 1989;34:1153-1162.
14. Talley NJ, Fleming KC, Evans JM, et al. Constipation in an elderly community: a study of prevalence and potential risk factors. Am J Gastroenterol 1996;91:19-25.
15. McCrea GL, Miaskowski C, Stotts NA, Macera L, Paul SM, Varma MG. Gender differences in self-reported constipation charac- teristics, symptoms, and bowel and dietary habits among patients at- tending a specialty clinic for constipation. Gend Med 2009;6:259- 271.
16. Talley NJ, Weaver AL, Zinsmeister AR, Melton LJ 3rd. Functional constipation and outlet delay: a population-based study. Gastroenter- ology 1993;105:781-790.
17. Choung RS, Locke GR 3rd, Schleck CD, Zinsmeister AR, Talley NJ. Cumulative incidence of chronic constipation: a population- based study 1988-2003. Aliment Pharmacol Ther 2007;26:1521-
1528.
18. Gwee KA, Ghoshal UC, Gonlachanvit S, et al. Primary care manage- ment of chronic constipation in Asia: the ANMA chronic con- stipation tool. J Neurogastroenterol Motil 2013;19:149-160.
19. American College of Gastroenterology Chronic Constipation Task Force. An evidence-based approach to the management of chronic constipation in North America. Am J Gastroenterol 2005;100(suppl 1):S1-S4.