Circulation Journal
Official Journal of the Japanese Circulation Society http://www.j-circ.or.jp
enlargement with wall thinning, restoration of vasomotion and return of pulsatility, which are important in effecting optimal repair of the vessel wall, potentially reducing adverse events such as late/very late neoatherosclerosis and stent/scaffold thrombosis.
2–4ully bioresorbable scaffolds (BRS) are a novel approach to interventional treatment of coronary artery disease, and this new era has been dubbed the fourth revolu- tion in percutaneous coronary revascularization.
1,2The bio- logical advantages of a transient device include late lumen
F
Received February 5, 2014; revised manuscript received April 11, 2014; accepted April 27, 2014; released online June 18, 2014 Time for primary review: 18 days
Thoraxcenter, Department of Cardiology, Erasmus MC (S.N., Y.O., Y.I., Y.-J.Z., C.M.C., Y.K.C., H.M.G.-G., R.-J.v.G., P.W.S.), Cardialysis (G.-A.v.E., H.M.G.-G., P.W.S.), Rotterdam; Leiden University Medical Center, Leiden (J.E., S.L., J.D., J.H.C.R.); Medis Medical Imaging Systems BV, Leiden (J.H.C.R.), The Netherlands; Abbott Vascular, Santa Clara, CA (L.P., A.S., S.V., R.R.), USA; and International Centre for Circulatory Health, NHLI, Imperial College London, London (P.W.S), UK
Appendix lists the investigators who contributed to OCT image acquisition in the ABSORB cohort B trial.
Mailing address: Yoshinobu Onuma, MD, Thoraxcenter, Ba-583 ‘s Gravendijkwal 230 3015, CE Rotterdam, The Netherlands. E-mail:
[email protected]
ISSN-1346-9843 doi: 10.1253/circj.CJ-14-0143
All rights are reserved to the Japanese Circulation Society. For permissions, please e-mail: [email protected]
Temporal Evolution of Strut Light Intensity After Implantation of Bioresorbable Polymeric Intracoronary
Scaffolds in the ABSORB Cohort B Trial
– An Application of a New Quantitative Method Based on Optical Coherence Tomography –
Shimpei Nakatani, MD; Yoshinobu Onuma, MD, PhD; Yuki Ishibashi, MD, PhD;
Jeroen Eggermont, PhD; Yao-Jun Zhang, MD, PhD; Carlos M. Campos, MD;
Yun Kyeong Cho, MD, PhD; Shengnan Liu; Jouke Dijkstra, PhD; Johan H.C. Reiber, PhD;
Laura Perkins, PhD; Alexander Sheehy, PhD; Susan Veldhof, BSc; Richard Rapoza, PhD;
Gerrit-Anne van Es, PhD; Hector M. Garcia-Garcia, MD, PhD; Robert-Jan van Geuns, MD, PhD;
Patrick W. Serruys, MD, PhD on behalf of the ABSORB Cohort B investigators
Background: Quantitative light intensity analysis of the strut core by optical coherence tomography (OCT) may
enable assessment of changes in the light reflectivity of the bioresorbable polymeric scaffold from polymer to provi- sional matrix and connective tissues, with full disappearance and integration of the scaffold into the vessel wall. The aim of this report was to describe the methodology and to apply it to serial human OCT images post procedure and at 6, 12, 24 and 36 months in the ABSORB cohort B trial.
Methods and Results: In serial frequency-domain OCT pullbacks, corresponding struts at different time points were
identified by 3-dimensional foldout view. The peak and median values of light intensity were measured in the strut core by dedicated software. A total of 303 corresponding struts were serially analyzed at 3 time points. In the se- quential analysis, peak light intensity increased gradually in the first 24 months after implantation and reached a plateau (relative difference with respect to baseline [%Dif]: 61.4% at 12 months, 115.0% at 24 months, 110.7% at 36 months), while the median intensity kept increasing at 36 months (%Dif: 14.3% at 12 months, 75.0% at 24 months, 93.1% at 36 months).
Conclusions: Quantitative light intensity analysis by OCT was capable of detecting subtle changes in the bioresorb-
able strut appearance over time, and could be used to monitor the bioresorption and integration process of polylac- tide struts. (Circ J 2014;
78: 1873 – 1881)Key Words: Bioresorbable vascular scaffold; Bioresorption; Coronary artery disease; Light intensity analysis; Optical coherence tomography
ORIGINAL ARTICLE
Cardiovascular Intervention
1874 NAKATANI S et al.
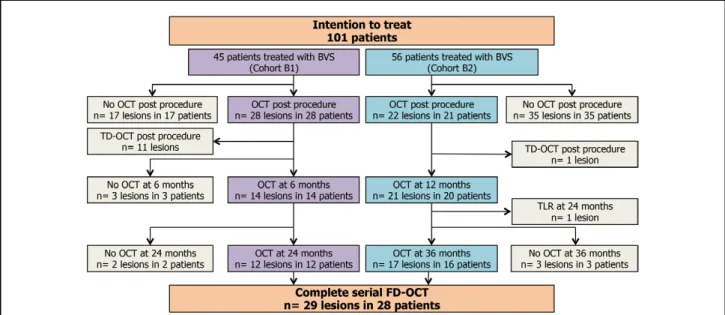
Figure 1. Flow chart of serial FD-OCT investigation in Cohort B of the ABSORB clinical trial. OCT, optical coherence tomography;
FD-OCT, frequent-domain OCT; TD-OCT, time-domain OCT.
Figure 2. Strut core matching at serial time points confirmed by 3D foldout view. Lumen contour is drawn and the strut angle defined as the angle created by 2 lines originating from the center of gravity of the lumen to the edges of the visualized struts. By taking the position at 3 o’clock as the 0° reference angle, the angular orientation of each strut can be visualized in the 2D cross- section as indicated in the 3D foldout view. (A) By correlating the cross-sectional angular position with the longitudinal distance from the distal edge of the scaffold (defined as at least 1 strut detected in a cross-section) for each visualized strut, the 3D foldout view of a scaffold can be constructed.
16(B) Foldout view of a 3×18 mm scaffold with 19 circular rings connected by 54 longitudi- nal links. The 3D foldout view confirms the location of matched or unmatched struts in a ring (R in white), link (L in white) or a hinge (H in white) in (C) and (D). The corresponding cross-sections were identified post procedure (D) and at 12 (E) and 36 months (F) by using a side branch (yellow cross) as an anatomical landmark. The corresponding struts were then selected by identifying those with a similar angular orientation in the corresponding cross-sections. However, some struts need confirmation on the 3D foldout view. For example, in (D), post procedure, in the cross-sections there are 2 visualized struts close in their angular orienta- tions (350° and 20°), while at 12 (E) and 36 (F) months there is only one small strut visualized at 20°. The 3D foldout views at 12 and 36 months demonstrate that this small strut is located in a link connecting the 10th and 11th rings, and the 3D foldout view post procedure shows that the strut at 20° is also located in a link connection; thus, this strut is confirmed as correctly matched.
Accordingly, the blue arrows show the corresponding struts and the white arrows show the non-corresponding struts.
1875 Light Intensity Analysis of Bioresorbable Scaffolds
analysis, to demonstrate the reproducibility of the assessment and to apply the method in serial OCT images collected post procedure and at 6, 12, 24 and 36 months follow-up in the ABSORB cohort B studies.
11Methods Study Population
The OCT data used in the current analysis were obtained in the ABSORB Cohort B trial, a multicenter single-arm trial assess- ing the safety and performance of the Absorb
TMeverolimus- eluting bioresorbable vascular scaffold (BVS; Abbott Vascular, Santa Clara, CA, USA) in the treatment of 101 patients with a maximum of 2 de novo native coronary artery lesions.
12The Absorb BVS consists of a semicrystalline PLLA backbone, coated with a thin amorphous layer of poly-D,L-lactide con- taining the antiproliferative agent everolimus. The details of inclusion and exclusion criteria have been described previous- ly.
12In this trial, 23 lesions in 23 patients were serially imaged by OCT post procedure and at 6 and 24 months (Cohort B1), and 19 lesions in 18 patients were serially investigated post procedure and at 12 and 36 months (Cohort B2).
11Per study protocol, all patients were treated uniformly with a 3 ×18 mm BVS. To avoid variation in light intensity because of different types of the light imaging system used (ie, time-domain OCT [TD-OCT] vs. frequency-domain OCT [FD-OCT]), cases of investigation by TD-OCT were excluded from the analysis (n=12). In total, 87 pullbacks in 29 cases of truly serial FD- OCT were included in this study (Figure 1).
The current-generation BRS are constructed of either a poly- mer or a metallic alloy.
5A variety of polymers with different chemical compositions and bioresorption times are in the pre- clinical and/or clinical stages of investigation. The most fre- quently used polymer is poly-L-lactide (PLLA).
2After implantation of a PLLA scaffold in vivo, the polymeric struts are progressively hydrolyzed and replaced by a provi- sional matrix; as it is released, the monomeric component, lactic acid, is metabolized via the Krebs cycle into carbon dioxide and water, with complete resorption occurring within approx- imately 24–36 months.
6The duration of bioresorption is influ- enced by the initial molecular weight (MW) of the main com- ponent and the presence of oligomer, monomer and/or solvents.
6After completion of bioresorption, the provisional matrix be- comes cellularized with connective tissue; the struts eventually become fully integrated into the surrounding vessel wall and their OCT “footprint” becomes undetectable.
7In previous preclinical and clinical studies of the first-gen- eration Absorb scaffold, 4 subgroups of strut appearance on OCT were visually categorized: “black box, dissolved bright box, dissolved black box or open box”.
7However, in those studies, the categorization showed only moderate reproducibil- ity (k=0.58); therefore, more reproducible and/or quantitative methods were warranted. Quantitative light intensity analysis of the strut core is a method that could enable assessment of the light reflectivity of the resorbing polymer, its replacement by a provisional matrix and its vessel wall integration after cel- lularization by de novo connective tissue.
8–10The aim of this report was to describe the methodology of light intensity
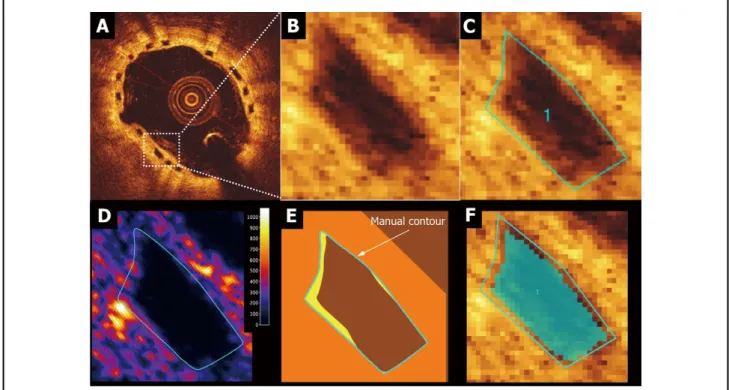
Figure 3. Strut core for light intensity assessment (region of interest, ROI). (A,B) OCT visualization of Absorb BVS strut consisting of a core area surrounded by reflective borders that are the interfaces between strut core and lumen or strut core and neointima/
vessel wall. The struts “frame” can only be assessed unequivocally post procedure.
12(C–F). Contours at follow-up of a strut core
of interest visually delineated by manually drawn contours (C) and light intensity mapping around the strut core (D). The manu-
ally drawn borders of a strut core at follow-up often includes the reflective strut frame borders, so that part of the bright reflective
frame can be misclassified as strut core region (E). Strut core region after automatic subtraction of 2 pixels inside the manual
contours (F).
1876 NAKATANI S et al.
scaffold, a 3D foldout view of a scaffold can be constructed and thereby confirms the location of a matched or unmatched struts in a ring, link or a hinge (Figure 2C).
16Light Intensity Analysis
Light intensity analysis was performed using dedicated software (QCU-CMS v4.69 research version, Leiden, The Netherlands).
Raw images in original polar format were used to ensure that interpolation, dynamic range compression or other image pro- cessing did not alter the signal and bias the analysis. The OCT image of an Absorb BVS strut consists of a “black core” area, surrounded by reflective borders created by the following in- terfaces because of differences in refraction index: at baseline, the lumen-polymer interface and the abluminal polymer-vessel wall interface and at follow-up, a neointima-strut core inter- face and an abluminal strut core-vessel wall interface. These interfaces are depicted in Figure 3.
The contours of the strut core of interest were delineated manually by visual inspection in a Cartesian image that were created from the raw polar images. The manually drawn bor- Method of Strut Matching
Preclinical studies suggest that the speed at which struts inte- grate into the arterial wall could vary within a single device depending on the location of the struts.
7Therefore, in our anal- ysis, strut-by-strut matching was performed to ascertain that the light intensity was repeatedly measured at the same site in the scaffold.
13–16Using landmarks such as metallic markers or side branches, the corresponding cross-sections were identified at the different time points of follow-up. In corresponding OCT cross-sections, visualized struts’ cores were matched by iden- tifying struts with similar angular orientation in the 2D cross- section. This strut level matching was further confirmed by using a 3-D foldout view of the scaffold (Figures 2C–E).
13–16In every cross-section with at least 1 scaffold strut, the lumen contour was drawn, and the strut angle was defined as the angle created by 2 lines originating from the center of the gravity of the lumen to the edges of the struts, taking the position at 3 o’clock as the 0° angle of reference (Figure 2A).
13By corre- lating the cross-sectional angular position of the struts with the longitudinal distance of each strut from the distal edge of the
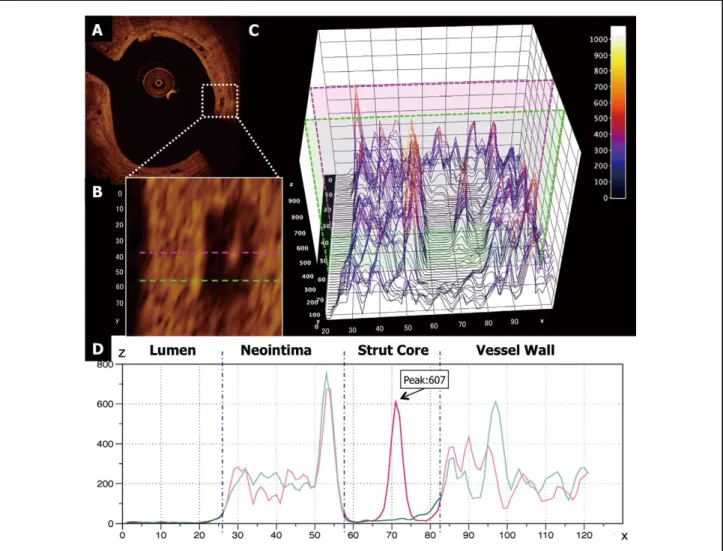
Figure 4. Two-dimensional and three-dimensional presentations of light intensity of the strut core. (A,B) Single strut located at 3
o’clock (0° reference angle) on this single cross-section of a scaffold implanted 36 months before. Inside the core region (B), there
is a focus of high light intensity. The pink dotted line passes through this focus. The green dotted line crosses the strut core with-
out passing the high-intensity spot. (C) 3D mapping of light intensity with 2 individual light profiles corresponding to the pink and
green dotted (B) and continuous lines (D). The dotted blue lines in (D) indicate the region of interest (ROI). X and Y axis scales
are in pixels, the Z axis has a dimensionless intensity value.
1877 Light Intensity Analysis of Bioresorbable Scaffolds
axial or transversal strut edge and derived from polymer craz- ing caused by mechanical deformation of scaffold during crimp- ing and deployment, were excluded in this analysis.
16,17The peak and median intensity values (dimensionless) of the strut core were then measured by the dedicated software (Figure 4). To evaluate interobserver reproducibility, 2 readers (S.N. and Y.I.) independently analyzed 400 struts randomly selected from the total number of investigated struts (n=909).
To determine intraobserver reproducibility, 1 reader (S.N.) analyzed the struts twice, with the second reading occurring 3 months later. The inter- and intraobserver reproducibility were good according to the conventional norms
18(peak intensity value: interobserver ICCa=0.92, intraobserver ICCc=0.89, me- dian intensity value: interobserver ICCa=0.91, intraobserver ICCc=0.93; Table S1, Figure S1).
ders of a strut core region often included complex reflective interfaces between the strut core and the surroundings, so that part of the bright reflective OCT frame of the strut (easily discernable at baseline) could become included in the strut core area at follow-up (Figures 3C–E) The interobserver manual delineation of the region of interest (ROI) could vary by 1 or 2 pixels (10–20 micron). To substantially reduce such a vari- ability in ROI contours, 2 pixels inside of the manual contour were automatically subtracted (Figure 3F).
Although the strut borders at follow-up were no longer de- tectable because of changes in strut appearance, the contours at baseline were manually superimposed on the follow-up im- ages (Figure 5F”). In addition, the malapposed struts and struts located at the ostium of the side branch post procedure were excluded in the current analysis. Furthermore, struts with post- procedure scattering center, which is a focal hyperintense sig- nal in the strut core without apparent contact with either the
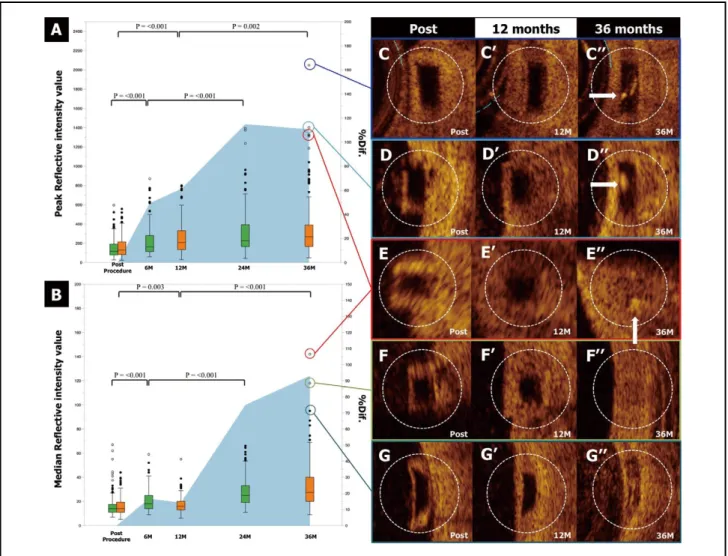
Figure 5. Change in peak and median intensity values over time with examples of serial highest peak or median intensity chang- es. (A,B) Whisker plots of peak and median intensity values (dimensionless) of corresponding strut cores in peak and median light intensities. Blue shadow curves depict the average of relative changes from baseline to follow-up (right vertical axis scale in percent, % difference). (C”–E”) Struts with the highest peak intensity values at 36 months. Corresponding struts post procedure (C–E) and 12 months (C’–E’) after implantation. (C”,D”) At 36 months, the corresponding struts on visual inspection still have a
“black box” appearance but now include a high-intensity spot (arrows). (E”–G”) Struts with the highest median intensity values at
36 months. Corresponding struts post procedure (E–G) and 12 months (E’–G’) after implantation. These strut cores with high
median values show increased light reflection of the entire core, which according to our previous categorized nomenclature could
have been visually categorized as dissolved bright (E”), dissolved black (F”) or open (G”) box.
191878 NAKATANI S et al.
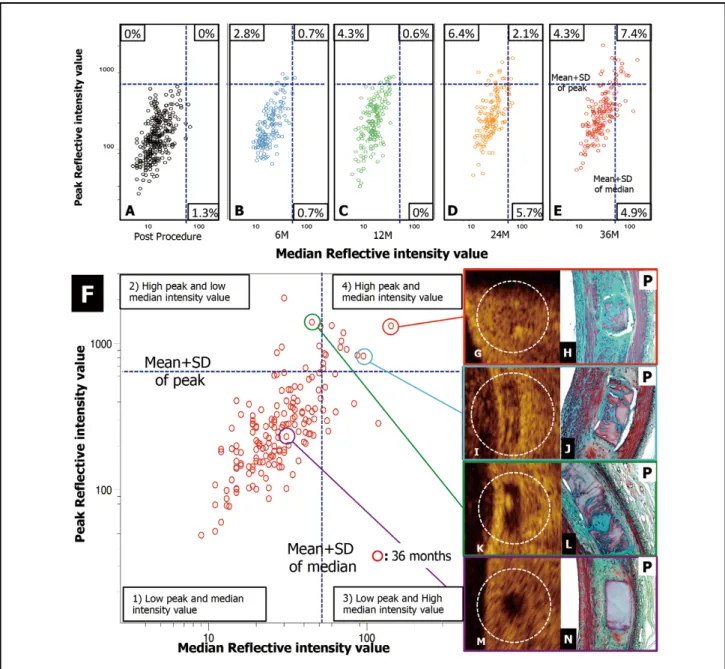
values, (3) struts with low peak and high median intensity values, and (4) struts with high peak and median intensity values.
The categorization into 4 groups helps in evaluating the changes of the strut appearance over time. At 36 months, 16.6%
of the strut cores no longer has the appearance of those with low median and low peak intensities. This percentage is ex- pected to rise dramatically at 5 years.
Struts with the highest peak or median intensity values at 3 years are exemplified in Figure 5. In 2 out of 3 struts with the highest peak intensity value, the strut core still appeared as a
“black box” but contained isolated bright spots (arrows in Figures 5C”,D”), Three struts with high median intensity val- ues showed an increase in the light reflection of the entire strut (Figures 5E”–G”).
Discussion
The main findings of this study using the new methodology of light intensity assessment are: (1) serial quantification of light intensity in matched strut cores is feasible and reproducible when using dedicated software and (2) the peak and median intensity values increase gradually in the serial light intensity analysis, a phenomenon presumably related to bioresorption and/or the integration process of the resorbable device.
Bioresorption Process Monitoring by Light Intensity Preclinical studies have demonstrated that the MW of the first- generation Absorb BVS becomes undetectable by gel perme- ation chromatography 24 months after implantation, and the polylactide is replaced by a provisional matrix that gradually integrates into the arterial wall.
7Using visual qualitative as- sessment only, OCT is unable to monitor MW loss or to detect replacement of the polymer by this provisional matrix. In the current study using a quantitative method, there was an overall Statistical Analysis
All statistical analyses were performed using the statistical software package SPSS version 21.0 (SPSS Inc, Chicago, IL, USA). Continuous variables are presented as the mean ± stan- dard deviation or median with interquartile ranges. Paired com- parisons between post procedure and follow-up were done by Wilcoxon’s signed rank test. Values of P<0.05 were consid- ered statistically significant.
Results
In 87 serial pullbacks (19 lesions) performed either at 6 and 24 months (cohort B1) or at 12 and 36 months (cohort B2), 423 cross-sections were matched using anatomical landmarks.
After strut level matching, a total of 303 corresponding struts (141 struts in cohort B1, 162 struts in cohort B2) were serially analyzed at 3 time points (909 strut images). Both peak and median intensity values over time are tabulated in Table, and the whisker plots of peak and median intensity values of the corresponding struts with the blue shadow curves representing the average relative change from baseline to follow-up are shown in Figure 5. The changes in absolute values for both parameters in the serial paired analysis are highly significant.
In a relative difference analysis, the peak light intensity value increased gradually in the first 24 months after implantation (relative difference [%Dif.]: 49.4% at 6 months, 61.4% at 12 months, 115.0% at 24 months) and reached a plateau (%Dif.:
110.7% at 36 months), while the median intensity value in- creased significantly at 24 months (%Dif: 14.3% at 12 months, 75.0% at 24 months) and kept increasing at 36 months (93.1%
at 36 months).
Mean plus 1 standard deviation of the measurement of the parameters was used as arbitrary threshold criteria for defining 4 groups: (1) struts with low peak and median light intensity values, (2) struts with high peak and low median intensity
Table. Peak and Median Intensity Values at Several Time Points After Implantation of Bioresorbable Polymeric Intracoronary Scaffolds in the ABSORB Cohort B Trial
Peak intensity value Median intensity value
Cohort B1 (n=141) Cohort B2 (n=162) Cohort B1 (n=141) Cohort B2 (n=162) Post procedure, median [IQR]/
mean (SD) 117.0 [79.0 to 194.0]/
149.5 (100.2) 131.0 [81.5 to 214.3]/
157.4 (95.48) 14.0 [11.0 to 17.8]/
17.1 (10.4) 14.0 [11.0 to 19.9]/
15.8 (7.8) M, median [IQR]/mean (SD)
6 162.0 [112.5 to 279.5]/
221.5 (162.2) – 18.0 [14.0 to 25.0]/
20.7 (9.4) –
12 – 206.5 [133.5 to 330.3]/
254.1 (178.4) – 16.0 [13.0 to 20.0]/
17.2 (7.4)
24 228.0 [162.0 to 393.5]/
322.9 (247.0) – 25.0 [19.0 to 33.0]/
28.2 (12.3) –
36 – 265.0 [163.5 to 386.0]/
347.7 (302.8) – 27.5 [20.0 to 40.3]/
32.5 (19.4) Dif., median [IQR]
6M-Post 48.0 [–36.5 to 147.5] – 3.0 [–1.0 to 9.5] –
12M-Post – 72.5 [–21.5 to 194.0] – 1.8 [–2.0 to 6.0]
24M-6M 72.0 [38.5 to 108.5] – 6.0 [0.8 to 15.0] –
36M-12M – 32.0 [–69.5 to 201.5] – 11.0 [4.4 to 22.0]
P value
Post-1st FUP <0.001 <0.001 <0.001 0.003
1st–2nd FUP <0.001 0.002 <0.001 <0.001
Post-2nd FUP <0.001 <0.001 <0.001 <0.001
All P-values are calculated by Wilcoxon paired test. Continuous variables are presented as the mean±standard deviation (SD) or median with interquartile range (IQR). FUP, follow up; M, months.
1879 Light Intensity Analysis of Bioresorbable Scaffolds
Integration Process on OCT
In previous preclinical studies, OCT assessment by visual in- spection was sensitive enough to monitor the integration pro- cess after bioresorption (“strut footprint” becoming undetect- able on OCT).
7In the present study, by using peak and median intensity values (Figure 6), the struts could be categorized into increase in peak light intensity values from baseline to 24
months, followed by a plateau; these changes could reflect early connective tissue infiltration forming foci of cellulariza- tion in the provisional matrix; preliminary investigations (data not shown) in a porcine model suggest that specific interpreta- tion (Figure 6L).
Figure 6. Quantitative light intensity assessment of strut integration on optical coherence tomography (OCT). (A–E) Scatter plots of the peak and median values post procedure and at 6, 12, 24 and 36 months. (F) Scatter diagram of the peak and median in- tensity values of each individual strut core at 36 months (dotted blue lines represent the light intensity values of the mean+1 SD for both parameters. According to these 2 threshold criteria, the strut cores are classified into 4 groups: (1) struts with low peak and low median light intensity values, (2) struts with high peak and low median intensity values, (3) struts with low peak and high median intensity values, and (4) struts with high peak and high median intensity values. The majority of struts are still categorized as having low peak/low median intensity value (M), which could correspond to struts without cellularization, but presumably oc- cupied by provisional matrix (N). This panel also includes histological examples obtained from Absorb BVS implanted porcine coronary arteries at 36 moths after implantation and stained by Movat’s pentachrome staining (red: smooth muscle cell/protein;
blue-green: provisional matrix with staining characteristics comparable to that of proteoglycan; yellow: collagen). Strut cores with
high median intensity value could (G,I) correspond to those that have been substantially cellularized with homogeneous connec-
tive tissue infiltration (H) such that the integration into the vessel wall is almost complete. (I) Strut core with high median and peak
intensities suggesting that connective tissue infiltration is more modest (J). The strut cores with high peak/low median intensities
(K) could correspond to struts that are focally cellularized with infiltration of connective tissue on histology (L).
1880 NAKATANI S et al.
changes around the border of a strut core. Theoretically, neo- intimal tissue on the endoluminal side of a strut core might influence the light intensity value of the strut cores; however, the median light intensity value of a strut core had no signifi- cant correlation with the thickness and median light intensity value of the neointimal tissue covering the endoluminal side of struts (Figures S2,S3).
Conclusions
The current analysis demonstrated that strut-by-strut serial light intensity analysis of the bioresorbable strut core is feasible and reproducible. The changes in peak intensity values at early time points may be related to focal cellularization, whereas the evolution of peak/median intensity values at later time points could reflect the integration process. Ongoing analysis of a porcine model up to 42 months will help in the interpretation of the 60-month (March–November 2014) OCT analysis of the sequential cohort of patients in the ABSORB cohort B1 and B2 trials.
Acknowledgments
The authors thank Renu Virmani for her preparation and interpretation of the preclinical histological samples from which the images were taken.
Disclosures
Conflict of Interest Statement: L. Perkins, A. Sheehy, S. Veldhof and R.
Rapoza are full-time employees of Abbott Vascular, which sponsored the Cohort B trial.
References
1. Serruys PW, Garcia-Garcia HM, Onuma Y. From metallic cages to transient bioresorbable scaffolds: Change in paradigm of coronary revascularization in the upcoming decade? Eur Heart J 2012; 33:
16 – 25b.
2. Onuma Y, Serruys PW. Bioresorbable scaffold: The advent of a new era in percutaneous coronary and peripheral revascularization? Cir-
culation 2011; 123: 779 – 797.3. Raber L, Magro M, Stefanini GG, Kalesan B, van Domburg RT, Onuma Y, et al. Very late coronary stent thrombosis of a newer- generation everolimus-eluting stent compared with early-generation drug-eluting stents: A prospective cohort study. Circulation 2012;
125: 1110 – 1121.
4. Nakazawa G, Otsuka F, Nakano M, Vorpahl M, Yazdani SK, Ladich E, et al. The pathology of neoatherosclerosis in human coronary im- plants bare-metal and drug-eluting stents. J Am Coll Cardiol 2011;
57: 1314 – 1322.
5. Iqbal J, Onuma Y, Ormiston J, Abizaid A, Waksman R, Serruys P.
Bioresorbable scaffolds: Rationale, current status, challenges, and future. Eur Heart J 2014; 35: 765 – 776.
6. Vorpahl M, Finn AV, Nakano M, Virmani R. The bioabsorption process: Tissue and cellular mechanisms and outcomes. EuroInter-
vention 2009; 5(Suppl F): F28 – F35.7. Onuma Y, Serruys PW, Perkins LE, Okamura T, Gonzalo N, Garcia- Garcia HM, et al. Intracoronary optical coherence tomography and histology at 1 month and 2, 3, and 4 years after implantation of everolimus-eluting bioresorbable vascular scaffolds in a porcine coro- nary artery model: An attempt to decipher the human optical coher- ence tomography images in the ABSORB trial. Circulation 2010;
122: 2288 – 2300.
8. Tearney GJ, Bouma BE. Shedding light on bioabsorbable stent struts seen by optical coherence tomography in the ABSORB trial. Circu-
lation 2010; 122: 2234 – 2235.9. Sheehy A, Gutierrez-Chico JL, Diletti R, Oberhauser JP, Glauser T, Harrington J, et al. In vivo characterisation of bioresorbable vascular scaffold strut interfaces using optical coherence tomography with Gaussian line spread function analysis. EuroIntervention 2012; 7:
1227 – 1235.
10. Templin C, Meyer M, Muller MF, Djonov V, Hlushchuk R, Dimova I, et al. Coronary optical frequency domain imaging (OFDI) for in vivo evaluation of stent healing: Comparison with light and electron microscopy. Eur Heart J 2010; 31: 1792 – 1801.
11. Serruys PW, Onuma Y, Garcia-Garcia HM, Muramatsu T, van 4 groups (see above).
In the current follow-up (36 months), the majority of struts (83.6%) still retained low peak and low median intensity values (Figure 6M), an observation that could correspond to strut cores without cellularization, but exclusively replaced by provisional matrix in the porcine model (Figure 6N). The strut cores with high peak intensity but low median intensity values (Figure 6K) could correspond to struts with focal cellularization according to histology in the porcine model (Figure 6L), whereas strut cores with high median intensity values (Figures 6G,I) could correspond to struts that have been fully cellularized in the porcine model (Figures 6H,J). Indeed, high median light inten- sity might reflect a more homogeneous replacement of struts with connective tissue whereby it is no longer possible to de- tect a demarcation between the de novo tissue replacing the pre-existing strut and the surrounding arterial wall, ultimately rendering the foci of the pre-existing struts undetectable by OCT (Figure 6H).
However, these hypothetical correlations between light in- tensity and histological changes need to be further cross-vali- dated in the porcine model and investigated in patients with a follow-up of 5 years (March–November 2014). It is our expec- tation that most of these sites at 5 years will have high median intensity values and therefore will be no longer be detectable on OCT. In summary, categorization by peak/median light in- tensity value could be used to quantify the integration process of struts made of polylactide.
Clinical Implication of Light Intensity Analysis
The preclinical investigation of scaffolded porcine coronary artery models at 2, 3 and 4 years, combining OCT and histol- ogy, indicated that the last process in the integration of struts involves their complete replacement with connective tissue and maturation (shrinkage) of this tissue. This same process of cellularization and contracture also occurs clinically and may correspond to vessel wall thinning, the latter of which could contribute to lumen enlargement with/without adaptive remod- eling. The current method of light intensity analysis could be applied clinically to assess the degree of strut/scaffold integra- tion after implantation. Therefore, by using the classification of struts based on quantitative light intensity values, clinicians could assess the stage of scaffold integration that heralds late lumen enlargement.
From the regulatory perspective, it is mandatory to investi- gate the rate of biodegradation/bioresorption of each device, because the rate can vary according to the manufacturing process of PLLA (extrusion, molding, microfiber braiding etc), even in devices made of the same MW PLLA with an identical scaffold design.
19,20Moreover, the rate at which a device be- comes integrated into the tissue can also vary according to its anatomical placement, the nature of the tissue underlying the scaffold (normal or pathological) and the location of each strut against the wall (apposition, malapposition or side-branch os- tium).
21Considering the fact that the translucent polymeric scaffold initially does not interfere with imaging of the under- lying plaque, the interaction between strut integration and underlying plaque could be also assessed with OCT.
Study Limitations
In the current study, OCT imaging was optional per protocol
and cases of events were excluded, so only 28 of 101 patients
(27.7%) with truly serial OCT were analyzed, which might
under-represent the total cohort and relevant outcomes. Using
the dedicated software algorithm, automatic exclusion of the
outer circumferential pixels from the strut core could overlook
1881 Light Intensity Analysis of Bioresorbable Scaffolds
Dudek D, et al. First serial assessment at 6 months and 2 years of the second generation of ABSORB everolimus-eluting bioresorbable vascular scaffold: A multi-imaging modality study. Circ Cardiovasc
Interv 2012; 5: 620 – 632.21. Gutierrez-Chico JL, Gijsen F, Regar E, Wentzel J, de Bruyne B, Thuesen L, et al. Differences in neointimal thickness between the adluminal and the abluminal sides of malapposed and side-branch struts in a polylactide bioresorbable scaffold: Evidence in vivo about the abluminal healing process. JACC Cardiovasc Interv 2012; 5:
428 – 435.
Appendix
The list of investigators who contributed to OCT image acquisition in the ABSORB cohort B trial.
Robert-Jan van Geuns, MD, PhD (n=14), Evald Christiansen, MD (n=12), Dariusz Dudek, MD (n=8), Dougal McClean, MD (n=7), Jacques Koolen, MD, PhD (n=7), John A Ormiston, MB, ChB, PhD (n=7), Bernard Chevalier, MD (n=7), Stefan Windecker, MD (n=6), Pieter C. Smits, MD, PhD (n=6), Bernard de Bruyne, MD, PhD (n=5), Robert Whitbourn, MD (n=3).
Supplementary Files Supplementary File 1
Inter- and intraobserver reproducibility of the light intensity value analysis of strut core
Influence of neointimal tissue on the endoluminal side of a strut core for the light intensity value of strut cores
Table S1. Inter- and intraobserver variability of peak and median intensity values
Figure S1. Inter- and intraobserver reproducibility analysis.
Figure S2. Neointimal thickness and the median light intensity value of the neointimal tissue covering the endoluminal side of struts.
Figure S3. Influence of neointimal tissue for the light intensity value of strut cores.
Please find supplementary file(s);
http://dx.doi.org/10.1253/circj.CJ-14-0143 Geuns RJ, de Bruyne B, et al. Dynamics of vessel wall changes fol-
lowing the implantation of the Absorb everolimus-eluting bioresorb- able vascular scaffold: A multi-imaging modality study at 6, 12, 24 and 36 months. EuroIntervention 2014; 9: 1271 – 1284.
12. Serruys PW, Onuma Y, Ormiston JA, de Bruyne B, Regar E, Dudek D, et al. Evaluation of the second generation of a bioresorbable everolimus drug-eluting vascular scaffold for treatment of de novo coronary artery stenosis: Six-month clinical and imaging outcomes.
Circulation 2010; 122: 2301 – 2312.
13. Okamura T, Garg S, Gutierrez-Chico JL, Shin ES, Onuma Y, Garcia- Garcia HM, et al. In vivo evaluation of stent strut distribution pat- terns in the bioabsorbable everolimus-eluting device: An OCT ad hoc analysis of the revision 1.0 and revision 1.1 stent design in the ABSORB clinical trial. EuroIntervention 2010; 5: 932 – 938.
14. Gutierrez-Chico JL, van Geuns RJ, Regar E, van der Giessen WJ, Kelbaek H, Saunamaki K, et al. Tissue coverage of a hydrophilic polymer-coated zotarolimus-eluting stent vs. a fluoropolymer-coated everolimus-eluting stent at 13-month follow-up: An optical coher- ence tomography substudy from the RESOLUTE All Comers trial.
Eur Heart J 2011; 32: 2454 – 2463.
15. Gomez-Lara J, Radu M, Brugaletta S, Farooq V, Diletti R, Onuma Y, et al. Serial analysis of the malapposed and uncovered struts of the new generation of everolimus-eluting bioresorbable scaffold with optical coherence tomography. JACC Cardiovasc Interv 2011; 4:
992 – 1001.
16. Gutierrez-Chico JL, Radu MD, Diletti R, Sheehy A, Kossuth MB, Oberhauser JP, et al. Spatial distribution and temporal evolution of scattering centers by optical coherence tomography in the poly(L- lactide) backbone of a bioresorbable vascular scaffold. Circ J 2012;
76: 342 – 350.