Abstract
BACKGROUND: The residual analysis of polar pesticides has remained a challenge. It is even more difficult to simultaneously analyze multiple polar pesticides. Diquat, paraquat, and chlormequat are typical examples of highly polar pesticides. The existing methods for the analysis of diquat, paraquat and chlormequat are complex and time consuming. Therefore, a simple, quick and effective method was developed in the represent study for simultaneous analysis of diquat, paraquat and chlormequat in animal
products, meat and fat using UPLC‐MS/MS.
METHODS AND RESULTS: Sample extraction was carried out using acidified acetonitrile and water and re‐ extracted with acidified acetonitrile and combine the extracts followed by centrifugation. The extract was then cleaned up with a HLB cartridge after reconstitution with acidic acetonitrile and water. The method was validated in quintuplicate at three different concentrations. The limits of detection (LOD) and quantification (LOQ) were 0.0015 and 0.005 mg/L, respectively. Matrix suppression effect was observed for all of the analytes. A seven point matrix matched calibration curve was constructed for each of the compound resulted excellent linearity with determination coefficients (R2) ≥ 0.991. Accuracy and precision of the method was calculated from the recovery and repeatability and ranged from 62.4 to 119.7% with relative standard deviation less than 18.8%.
†These authors equally contributed to this paper as first authors
*Corresponding author: Il Kyu Cho
Phone: +82‐61‐363‐9544; Fax: +82‐61‐362‐0631;
E-mail: [email protected]
Korean J Environ Agric. 2020;39(4):368‐374. English Online ISSN: 2233-4173
Published online 2020 December 7. https://doi.org/10.5338/KJEA.2020.39.4.44 Print ISSN: 1225-3537
Development of a Simultaneous Analytical Method for Diquat, Paraquat and Chlormequat in Animal Products Using
UPLC‐MS/MS
Il Kyu Cho1†*, Md. Musfiqur Rahman1†, Jae Ung Seol1, Hyun Ho Noh2, Hyeong‐Wook Jo3 and Joon‐Kwan Moon4
1Eco‐Friendly Agri‐Bio Research Center, Jeonnam Bioindustry Foundation, Gokseong 57510, Korea, 2Residual Agrochemical Assessment Division, Department of Agro-Food Safety & Crop Protection, National Institute of Agricultural Sciences, Rural Development Administration, Wanju 55365, Korea, 3Hansalim Agro‐Food Analysis Center, Hankyong National University Industry Academic Cooperation Foundation, Anseong 17579, Korea, 4School of Applied Science in Natural Resources and Environment, Hankyong National University, Anseong 17579, Korea
Received: 3 November 2020/ Revised: 25 November 2020/ Accepted: 30 November 2020 Copyright ⓒ 2020 The Korean Society of Environmental Agriculture
This is an Open-Access article distributed under the terms of the Creative Commons Attribution Non-Commercial License (http://creativecommons.org/licenses/by-nc/3.0) which permits unrestricted non-commercial use, distribution, and reproduction in any medium, provided the original work is properly cited.
ORCID Il Kyu Cho
https://orcid.org/0000‐0002‐4177‐5588 Md. Musfiqur Rahman
https://orcid.org/0000‐0002‐3848‐4907 Jae Ung Seol
https://orcid.org/0000‐0002‐1017‐2189
Hyun Ho Noh
https://orcid.org/0000‐0002‐7568‐8490 Hyeong‐Woo Jo
https://orcid.org/0000‐0002‐2271‐9767 Joon‐Kwan Moon
https://orcid.org/0000‐0001‐9944‐7475
368
Research Article Open Access
CONCLUSION: The recovery and repeatability of the developed method were in the acceptable range according to the Codex Alimentarius guideline. The developed method can be applied for the routine monitoring of diquat, paraquat, and chlormequat in animal products, meat and fat.
Key words: Chlormequat, Diquat, Paraquat, Simultaneous Analysis, UPLC-MS/MS
Introduction
Diquat, paraquat and chlormequat (Fig. 1) are quaternary ammonium, non‐selective and nonsystematic contact herbicides. They are widely used for controlling broadleaf, grassy weeds and aquatic weeds [1, 2]. These compounds are commonly known as QUATs and considered as toxic herbicides [1, 3].
Herbicides can enter human body directly or indirectly through food chain. Residues can also be accumulated to the livestock animal via contaminated feed [4]. Various international organizations regulate pesticide residues in foods using maximum residue limits (MRL). According to the Codex guideline, the MRLs of diquat, paraquat and chlormequat were determined 0.005 mg/kg or above for most of the food products of animal origin. Therefore, a sensitive analytical method is needed for monitoring of these three herbicide in livestock animal products. Several analytical methods have been developed for the analysis of diquat and paraquat in various matrices [2, 3, 5‐11]. A few methods were also published for simultaneous analysis of diquat, paraquat and chlormequat using LC‐MS/MS [12‐16]. Due to high water solubility, these compounds are not included in multi‐residue analysis as they required specific types of separation column and mobile phases.
However, existing single residue methods are time consuming associated with complex sample preparation involving heating step during sample preparation. The
detection of these methods also requires addition of ion pair agent in the mobile phase which demanded continuous cleaning of the instrument after application [6, 7, 10‐12, 14, 15].
To overcome such problems, QuPPE (Quick Polar Pesticides) method has been introduced and used for the analysis of polar pesticides such as QUATs in various matrices [8, 17, 18]. The method involved extraction with methanol and acid aqueous solution resulted a high amount of matrix co‐extractives and the measurement was carried out using isotope labeled internal standard that make the experiment expensive and difficult.
Therefore, the aim of the present study was to develop a simple and effective method for the analysis of diquat, paraquat, and chlormequat in livestock animal products using UPLC‐MS/MS.
Materials and Methods Chemicals and Reagents
Standard diquat and paraquat calibration mixture (1000 mg/L) in water was purchased from Restek (Bellefonte, PA, USA). Chlormequat standard (purity 98.2%) was supplied by Sigma Aldrich (St. Louis, MO, USA). HPLC grade acetonitrile and water were purchased from Honeywell (Muskegon, MI, USA). Analytical grade formic acid (purity ≥ 95%) and ammonium format (purity
≥ 99.995%) were obtained from Sigma Aldrich (St. Louis, MO, USA).
Preparation of standard solution and calibration An amount of 10.18 mg of chlormequat was dissolve in 10 mL water to prepare 1000 ppm chlormequat. The mixed diquat and paraquat solution was added with the standard chlormequat to provide the mixed solution at 100 ppm of each. The intermediate standard solution was prepared by diluting the standard solution to 10 ppm and 1.0 ppm with mobile phase B. The working standard solutions were prepared by diluting the intermediate
(a) (b)
(c)
Fig. 1. Chemical structures of diquat dibromide (a), paraquat (b) and chlormequat (c).
standard solution to 0.001, 0.002, 0.004, 0.006, 0.008, 0.01, and 0.012 mg/L with the same solvent.
Sample Preparation
An each 5 g of homogenized livestock animal products (chicken, pork, pork fat, beef, beef fat, egg and milk) was taken in a 50 mL Teflon centrifuge tube to which a 15 mL of 0.5% formic acid in acetonitrile and 5 mL of 0.5% formic acid in water was added and extract with a Geno Grinder (SPEX Sample Prep., USA) for 2 min at 1200 rpm. The extracts were then centrifuged at 3500 rpm for 5 min. and transferred the whole solution to another centrifuge tube. The remaining samples were re‐extracted with 10 mL of 0.5% formic acid in acetonitrile and transfer and combine the solution to the centrifuge tube following centrifugation. The mixed solutions were vortexed for 10 s and evaporated the organic layer through a gentle N2 stream at 40°C. The remaining aqueous solution was adjusted to reconstructing until 6.25 mL with 0.5% formic acid in water and additional 6.25 mL of 0.5% formic acid in acetonitrile was added.
The total 12.5 mL of mixed solution was vortexed for 10 sec. prior to purification.
An aliquot of 2 mL of extract was loaded to a HLB (500 mg) LP cartridges (Oasis, Waters, Milford, MA, USA) that was previously conditioned with 6 mL of 0.5%
formic acid in water and 6 mL of 0.5% formic acid in acetonitrile with an solid phase extraction (SFE) manifold under a reduced pressure. The loaded extract was then eluted with a 1.6 mL of 0.5% formic acid in acetonitrile.
The eluents were combined in a 15 mL Teflon tube and added with 0.4 mL of 0.5% formic acid in acetonitrile followed by vortexing. One mL was transferred to a 2 mL plastic vial followed by addition of 10 μL of 5000 mM ammonium formate.
Method validation
The method was validated according to the Codex Alimentarius guidelines in term of limits of detection (LOD), limits of quantification (LOQ), linearity, matrix effect selectivity, specificity, accuracy and precision. LOD was the lowest detectable amount of analyte that produced signal three times higher than the background noise. The lowest quantifiable amount of analyte was termed as LOQ that generated a signal ten times higher than the base line noise. Linearity is determined from the co‐efficient of determinants (R2) obtained from the seven points calibration curve. Matrix effect was compensated
by constructing matrix matched calibration and the effect was calculated by comparing the slope of the matrix matched calibration and the slope of the matrix free solvent calibration. Accuracy was determined from the recovery of fortified standard following sample preparation procedure and according to the guideline recovery must be within the range of 50~120% depending on the spiking concentration. Precision was the outcome of five times repeatability of the recovery experiments and was expressed as a relative standard deviation, RSD. According to the Codex guideline the valid range for precision is RSD
< 22~32% of the spiking concentrations.
Instrument
An ultra‐performance liquid chromatograph (Waters AQUITY UHPLC H Class, Waters, Hertfordshire, UK) coupled with a mass spectrometer (AB SCIEX QTRAP 3500 mass spectrometer, SCIEX, Redwood, CA, USA) was employed for detection and quantification of diquat, paraquat, and chlormequat. The MS/MS was carried out in multi‐reaction monitoring mode (MRM) with positive electron spray ionization. For MRM method development a syringe pump was equipped with the MS/MS system for standard infusion and optimization of compound ionization. The chromatographic separation was carried out on a Hilic‐Si column (50 x 2.1 mm, 2.7 μm). The column oven temperature was maintained at 45°C. A binary solvent system composed of 50 mM ammonium formate and 0.5% formic acid in water (A), and 50 mM ammonium formate and 0.5% formic acid in 75% ACN and 25% water (B). The gradient mobile phase started with 100% B which was reduced to 65% B at 4 min.
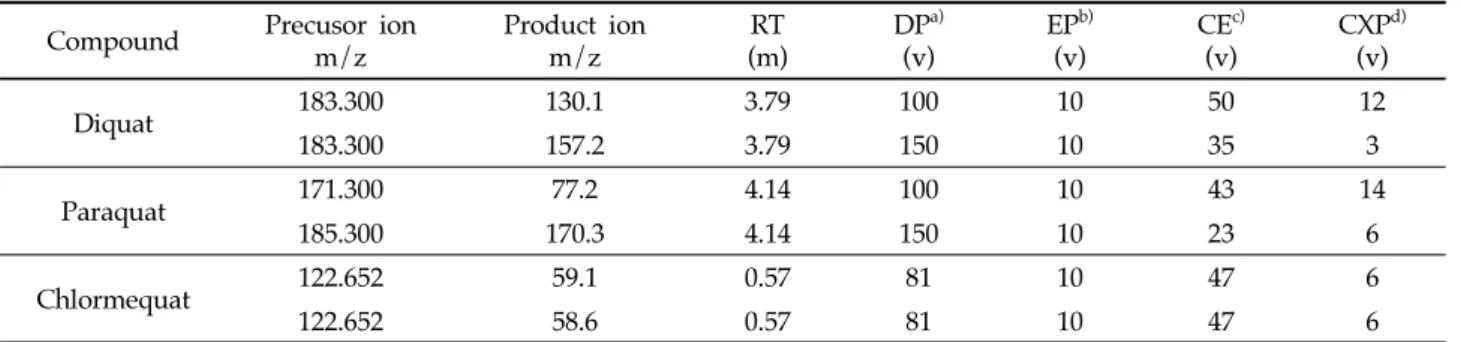
At 4.1 min it was suddenly increased to 100% B and remains constant until 7 min. The column flow was maintained at 0.60 mL/min with the injection volume of 10 μL. The ion source temperature was 500°C and the spray voltage was 5500 V. Nitrogen was used as nebulizer, curtain, and heating gas. The optimized MS/MS parameter is shown in Table 1.
Results and Discussion
The extraction method was optimized based on the physicochemical properties of diquat, paraquat, and chlormequat. The negative octanol‐water co‐efficient of these three compounds indicated that the translocation of these three analytes from aqueous phase to organic phase is almost impossible. Therefore, the most popular
Compound Precusor ion m/z
Product ion m/z
RT (m)
DPa) (v)
EPb) (v)
CEc) (v)
CXPd) (v)
Diquat 183.300 130.1 3.79 100 10 50 12
183.300 157.2 3.79 150 10 35 3
Paraquat 171.300 77.2 4.14 100 10 43 14
185.300 170.3 4.14 150 10 23 6
Chlormequat 122.652 59.1 0.57 81 10 47 6
122.652 58.6 0.57 81 10 47 6
a)Declustering potential, b)Enterance potential energy, c)Collision energy, d)Collision cell exit potential Table 1. Multiple reaction monitoring (MRM) conditions for diquat, paraquat and chlormequat
sample preparation method like QuEChERS (Quick, Easy, Cheap, Effective, Rugged, and Safe) is not applicable as the method involved salting out for transfer of target analyte to the organic phase. Since all these three compounds are stable in an acidic environment, formic acid was therefore used with acetonitrile and water for extraction, purification and detection. During MS/MS analysis it was observed that if the compounds are dissolved in mobile phase B (0.5% formic acid in 75%
ACN and 25% water), a good separation and sensitivity of these three compounds can be then achieved. Since extraction and purification procedure were subjected with water, it was difficult to evaporate and reconstitute the purified extract in mobile phase B. Therefore, extraction and purification steps were designed in such a way so that the final purified extract was exactly the same as the mobile B. To do so, during extraction, acidic acetonitrile and water fraction was maintained a fifty‐fifty ratio; after complete evaporation of organic phase, it turned to 75:25 (ACN:H2O) after cartridge purification.
During optimization of HLB cartridge cleanup conditions, none of the compounds were retained in the cartridge after loading. After a 2.0 mL of extract containing 0.5% formic acid in fifty‐fifty (ACN:H2O) was loaded on a HLB cartridge, elution was performed with 0.5% FA in 1.6 mL ACN. Finally, the volume was adjusted to 4 mL with the addition of 0.4 mL of 0.5%
formic acid in ACN. This volume adjustment was utilized for the matrix matched calibration. From this 4 mL purified extract, 1 mL was transferred to a 2 mL plastic vial flowed by addition of 10 μL of 5000 mM ammonium formate for exact matching of mobile phase B. In the whole extraction, purification and detection process, no glassware were used due to the glass adhesive properties of these compounds [17].
The LOD and LOQ of the method for the three compounds were 0.0015 and 0.005 mg/kg respectively.
The LOQ of the established method was either at MRL (maximum residue limit) level or below the MRL regulated by Codex Alimentarius guidelines for animal food products.
Fig. 2 shows the total ion chromatograms of matrix matched standard mixture, blank, and recovery. Similar retention time between standard and recovery, and absence (or less than 30% of LOQ) of interferences at the blank represents the selectivity and specificity of the method.
Extensive matrix suppression effect for all of the three compounds was observed (‐25.37 to ‐80.34%) even after cartridge purification and fivefold dilution. It might be due to the addition of high amount of buffering salt (50 mM ammonium format) required for optimum column efficiency. Therefore, a seven point (0.005, 0.01, 0.02, 0.03, 0.04, 0.05, 0.06 mg/kg) matrix matched calibration curve was constructed for all of the compounds in each of the matrices that provided good linearity with determination co‐efficient (R2) ≥ 0.9912. The recovery and repeatability of the present methods were ranging 62.4~119.7% and RSD ≤ 18.8% respectively in all of the matrices. The linearity, matrix effect, recovery and repeatability of these three QUATs are shown in Table 2. In the case of paraquat, below 70% recovery was observed at LOQ level and 2LOQ level (only in egg matrices) indicated that low concentration of paraquat is bit unstable. Even though recovery of paraquat was below 70%, it was still within the acceptable range according to the Codex Alimentarius (60~120%) (CAC/GL 90‐2017). Likely, the matrix suppression effect showed maximum over 80%.
The 20% of matrix effect recognized by the Ministry of Food and Drug Safety is a standard guideline for whether matrix matched should be performed or not, and the percentage of matrix effect is meaningless if matrix matched is conducted. Diquat, paraquat and chlormequats are cationic compounds that ion suppress
A
B
11
2
3
2
C
1
3
Fig. 2. UPLC‐MS/MS TIC chromatograms of matrix matched standard (10 LOQ level) mixture of diquat (A), blank beef matrix (B), recovery at 10 LOQ level (C) (a; chlormequat, b; diquat dibromide, c; paraquat). The numbers are as 1: chlormequat; 2: diquat dibromide; 3: paraquat. The arrow symbols in the panel B represent the retention times of chlormequat, diquat dibromide and paraquat, respectively.
takes a place by using solid phase extraction method with ion exchange resin other than HLB cartridge. While SPE SCX (Strong Cation Exchange) cartridge was used to utilize strong cation exchange chromatography, binding of compounds in the SPE occur but them did not eluted
from the cartridge. An ion enhancement or ion suppression occurred when SPE purification with dispersive SPE and Envi‐carb was carried to purify the compounds from the animal products. It was same as the elution solution of the compounds was passed through a syringe filter
Matrix Pesticides Linearity
(R2) Matrix effect Recovery±RSDa) (%)
1 LOQ 2 LOQ 10 LOQ
Chicken
Diquat 0.9973 ‐25.371 81.0±7.3 80.6±8.06 90.5±9.9
Paraquat 0.9949 ‐25.641 64.7±3.8 78.0±9.5 99.5±6.3
Chlormequat 0.9922 ‐80.079 90.2±19.6 99.6±10.3 107.9±3.9
Pork
Diquat 0.9986 ‐33.665 89.2±6.0 92.5±9.0 92.5±4.6
Paraquat 0.9981 ‐40.773 71.2±7.7 83.8±5.6 96.1±5.6
Chlormequat 0.9938 ‐80.338 107.0±14.2 116.3±10.6 111.6±3.7
Pork fat
Diquat 0.9980 ‐29.470 87.7±7.0 88.1±9.2 94.4±9.3
Paraquat 0.9968 ‐37.472 65.2±7.3 80.9±9.3 102.1±6.8
Chlormequat 0.9973 ‐78.126 118.4±9.6 106.2±7.4 109.2±4.6
Beef
Diquat 0.9964 ‐40.935 84.9±11.8 85.9±6.2 85.4±8.1
Paraquat 0.9966 ‐60.380 67.2±5.0 76.9±9.3 98.2±4.2
Chlormequat 0.9935 ‐87.923 99.4±17.3 111.6±18.8 118.9±4.3
Beef fat
Diquat 0.9968 ‐43.472 84.1±9.4 92.8±9.9 83.7±5.6
Paraquat 0.9993 ‐57.767 68.7±5.6 81.2±7.2 93.1±7.4
Chlormequat 0.9912 ‐87.356 119.7±11.0 107.1±10.5 106.7±9.2
Egg
Diquat 0.9920 ‐36.528 79.3±7.8 79.3±5.6 84.9±4.9
Paraquat 0.9933 ‐49.098 62.4±9.5 67.0±4.8 87.0±2.3
Chlormequat 0.9991 ‐73.546 116.3±11.7 99.3±10.9 90.1±8.3
Milk
Diquat 0.9930 ‐31.865 86.4±8.1 86.1±9.3 86.7±4.6
Paraquat 0.9954 ‐25.972 64.8±4.8 73.5±6.2 79.2±5.0
Chlormequat 0.9988 ‐73.788 102.6±8.8 94.1±5.8 91.3±3.7
a)Mean values of 5 time repetitions with relative standard deviation
Table 2. Linearity, matrix effect and recovery of diquat, paraquat and chlormequat livestock animal products
An analytical method for diquat and paraquat have been developed involving extraction with a mixture of methanol/water/hydrochloric acid and heating at 80°C (Thomas, 2017). The method provided recoveries of 92~120% in potato, cereals and pulses. However, the LOQ of the method was set at 0.05 or 0.1 mg/kg.
[18] published a method for QUATs in food of plant origin involving acidified mixture of methanol‐water for extraction resulted 64~97% recovery with the LOQ of 0.01 mg/kg.
[2] determined diquat and paraquat in potato using acidic methanol and a heating step during extraction.
Although method provided good recovery (87~106%), it still required time consuming heating step.
Chlormequat was not included in that study.
[8] tried to recover QUATs in olive oil and olive using a QuPPE method. Poor recoveries were observed for diquat and paraquat. Therefore, the developed method that satisfies all of the parameters of international standard can be used for regular monitoring of QUATs
in livestock animal products
Note
The authors declare no conflict of interest.
Acknowledgment
This work was supported by the National Institute of Food and Drug Safety Evaluation (Project No.:
19162556).
References
1. Raina‐Fulton R (2014) A review of methods for the analysis of orphan and difficult pesticides: glyphosate, glufosinate, quaternary ammonium and phenoxy acid herbicides, and dithiocarbamate and phthalimide fungicides.
Journal of AOAC International, 97, 965-977.
https://doi.org/10.5740/jaoacint.SGERaina‐Fulton.
2. Chamkasem N, Harmon TM (2017) Determination of paraquat and diquat in potato by liquid chromatography/
tandem mass spectrometer. Journal of Regulatory Science, 5, 1-8.
https://doi.org/10.13140/RG.2.2.28928.02564.
3. Nagatomi Y, Yoshioka T, Yanagisawa M, Uyama A, Mochizuki N (2013) Rapid analysis of paraquat and diquat in beer and malt using LC‐MS/MS. Journal of Pesticide Science, 38(3), 144-146.
https://doi.org/10.1584/jpestics.D13‐008.
4. Panseri S, Biondi PA, Vigo D, Communod R, Chiesa LM (2013) Occurrence of organochlorine pesticides residues in animal feed and fatty bovine tissue. Food Industry, 13, 261‐283. https://doi.org/10.5772/54182.
5. Kolberg DIS, Mack D, Anastassiades M, Hetmanski MT, Fussell RJ, Meijer T, Mol HGJ (2012) Development and independent laboratory validation of a simple method for the determination of paraquat and diquat in potato, cereals and pulses. Analytical and Bioanalytical Chemistry, 404, 2465-2474.
https://doi.org/10.1007/s00216‐012‐6340‐9.
6. Taguchi VY, Jenkins SWD, Crozier PW, Wang DT (1998) Determination of diquat and paraquat in water by liquid chromatography‐ (electrospray ionization) mass spectrometry. Journal of the American Society for Mass Spectrometry, 9, 830-839.
https://doi.org/10.1016/S1044‐0305(98)00043‐9.
7. Aramendía MA, Borau V, Lafont F, Marinas A, Marinas JM, Moreno JM, Porras JM, Urbano FJ (2006) Determination of diquat and paraquat in olive oil by ion‐pair liquid chromatography-electrospray ionization mass spectrometry (MRM). Food Chemistry, 97, 181-188.
https://doi.org/10.1016/j.foodchem.2005.05.005.
8. Nortes‐Méndez R, Robles‐Molina J, López‐Blanco R, Vass A, Molina‐Díaz A, Garcia‐Reyes JF (2016) Determination of polar pesticides in olive oil and olives by hydrophilic interaction liquid chromatography coupled to tandem mass spectrometry and high resolution mass spectrometry.
Talanta, 158, 222-228.
https://doi.org/10.1016/j.talanta.2016.05.058.
9. Pateiro‐Moure M, Martínez‐Carballo E, Arias‐Estévez M, Simal‐Gándara J (2008) Determination of quaternary ammonium herbicides in soils Comparison of digestion, shaking and microwave‐assisted extractions. Journal of Chromatography A, 1196-1197, 110-116.
https://doi.org/10.1016/j.chroma.2008.03.081.
10. Ariffin MM, Anderson RA (2006) LC/MS/MS analysis of quaternary ammonium drugs and herbicides in whole blood. Journal of Chromatography B, 842, 91-97.
https://doi.org/10.1016/j.jchromb.2006.03.051.
11. Wang K‐C, Chen S‐M, Hsu J‐F, Cheng S‐G, Lee C‐K (2008) Simultaneous detection and quantitation of highly water‐soluble herbicides in serum using ion‐
pair liquid chromatography-tandem mass spectrometry.
Journal of Chromatography B, 876, 211-218.
https://doi.org/10.1016/j.jchromb.2008.10.042.
12. Castro R, Moyano E, Galceran MT (2001) Determination of quaternary ammonium pesticides by liquid chromatography-electrospray tandem mass spectrometry.
Journal of Chromatography A, 914, 111-121.
https://doi.org/10.1016/S0021‐9673(01)00523‐4.
13. Nardin T, Barnaba C, Abballe F, Trenti G, Malacarne M, Larcher R (2017) Fast analysis of quaternary ammonium pesticides in food and beverages using cation‐exchange chromatography coupled with isotope‐dilution high‐
resolution mass spectrometry. Journal of Separation Science, 40, 3928-3937.
https://doi.org/10.1002/jssc.201700579.
14. Castro R, Moyano E, Galceran MT (2000) On‐line ion‐
pair solid‐phase extraction-liquid chromatography-mass spectrometry for the analysis of quaternary ammonium herbicides. Journal of Chromatography A, 869, 441-449.
https://doi.org/10.1016/S0021‐9673 (99)01065‐1.
15. Vidal JLM, Vega AB, López FJS, Frenich AG (2004) Application of internal quality control to the analysis of quaternary ammonium compounds in surface and ground water from Andalusia (Spain) by liquid chromatography with mass spectrometry. Journal of Chromatography A, 1050, 179-184.
https://doi.org/10.1016/j.chroma.2004.08.023.
16. Danezis GP, Anagnostopoulos CJ, Liapis K, Koupparis MA (2016) Multi‐residue analysis of pesticides, plant hormones, veterinary drugs and mycotoxins using HILIC chromatography ‐ MS/MS in various food matrices. Analytica Chimica Acta, 942, 121-138.
https://doi.org/10.1016/j.aca.2016.09.011.
17. Anastassiades M, Kolberg DI, Eichhorn E, Benkenstein A, Lukačević S, Mack D, Wildgrube C, Barth A, Sigalov I et al. (2015) Quick method for the analysis of numerous highly polar pesticides in foods of plant origin via LC‐MS/MS involving simultaneous extraction with methanol (QuPPe‐method). EU Reference Laboratories for Residues of Pesticides, 9, 1‐60.
18. Kaczy´nski P (2017) Clean‐up and matrix effect in LC
‐MS/MS analysis of food of plant origin for high polar herbicides. Food Chemistry, 230, 524-531.
https://doi.org/10.1016/j.foodchem.2017.03.091.