Introduction
Metabolic syndrome (MetS) describes the clustering of abdominal obesity, lipid abnormalities, hypertension, and hy- perglycemia. The prevalence of MetS is increasing worldwide, and this sharp increase has also been observed in Asian coun- tries [1]. According to data from the Korean National Health and Nutrition Examination Survey (KNHANES) 1998-2007, the age-adjusted prevalence of MetS increased significantly from 24.9% in 1998, 29.2% in 2001, and 30.4% in 2005 to 31.3% in 2007 [2].
In South Korea, the prevalence of MetS in men was higher than in women aged 20-49 years, but the prevalence of MetS in women increased significantly at age 50 years and surpassed men afterward [2]. Considering that this noticeable increase in MetS was observed for women starting at the age of 50, it seems likely that menopause might be a reason for this change. Postmenopausal women are considered to have a higher risk of coronary artery disease and osteoporosis than
Clin Nutr Res 2013;2:59-66
http://dx.doi.org/10.7762/cnr.2013.2.1.59 pISSN 2287-3732 ∙ eISSN 2287-3740
Dietary Isoflavone Intake, Urinary Isoflavone Level, and Their Relationship with Metabolic Syndrome Diagnostic
Components in Korean Postmenopausal Women
Mi Hyun Kim
1, Yun Jung Bae
2*
1Department of Food and Nutrition, Kangwon National University, Samcheok 245-905, Korea
2Department of Food and Nutritional Sciences, Hanbuk University, Dongducheon 483-120, Korea
Recent studies have suggested that natural agents such as isoflavones, resveratrol, and anthocyanin have beneficial effects on metabolic syndrome-related disorders. The objective of this study was to evaluate dietary isoflavone intake, urinary isoflavone level, and their relationship with the risk of metabolic syndrome (MetS) among Korean postmenopausal women. The subjects included 46 MetS and 60 controls. The MetS risk score was determined by adding the number of risk factors such as waist cir- cumference, blood pressure (BP) and levels of triglyceride (TG), HDL-cholesterol, and glucose. Dietary isoflavone intake was not significantly different between the MetS and control groups; however, the urinary daidzein level was significantly higher in the MetS subjects compared to that of the controls. Subjects with high TG had higher urinary daidzein and isoflavone (daidzein + genistein) levels than those without such abnormalities. But, the MetS risk score showed no significant correlation with urinary daidzein, genistein, and isoflavone excretions.
Key Words: Isoflavone, Metabolic syndrome, Postmenopausal women
*Corresponding author Yun Jung Bae
Address Department of Food and Nutritional Sciences, Hanbuk Uni- versity, 30 Beolmadeul-ro 40 beon-gil, Dongducheon-si, Gyeonggi- do 483-777, Korea Tel +82-31-860-1445 Fax +82-31-860-1449 E-mail [email protected]
Received November 20, 2012 Revised December 7, 2012 Accepted December 14, 2012
This is an Open Access article distributed under the terms of the Creative Commons Attribution Non-Commercial License (http://creativecommons.org/licenses/by-nc/3.0/) which permits unrestricted non-commercial use, distribution, and reproduction in any medium, provided the original work is properly cited.
© 2013 The Korean Society of Clinical Nutrition
premenopausal women [3]. During menopause, the pattern of hormone secretion changes and causes fat accumulation in visceral adipose tissues of the abdomen [4]. In Heidari and col- leagues’ study, the prevalence of MetS in the postmenopausal women increased significantly in comparison with that during menopause and the pre-menopause period, even after age adjustment [5].
Many previous studies have reported that hormone replace- ment therapy (HRT) in postmenopausal women has beneficial effects on lipids profiles, blood pressure, and glucose ho- meostasis [6]. Estrogens positively affect lipid and lipoprotein metabolism, increase production of nitric oxide, and decrease production of endothelin [7]. But, some studies indicated that HRT is not effective in decreasing the risk for CVD prevalence [8,9].
Some recent studies have suggested that natural agents such as isoflavones, resveratrol, and quercetin have beneficial effects on MetS-related disorders [10,11]. Especially isofla- vones, a group of biologically active compounds found in soybeans and other legumes, bind to estrogen receptor sites and have weak estrogenic effects [12,13]. In a cross-sectional study, usual dietary isoflavone intake in postmenopausal women had a protective role against CVD [14]. And, in a ran- domized controlled trial (RCT) study, it was reported that ge- nistein supplementation in postmenopausal women improved glycemic and vascular reactivity indexes in normoinsulinemic patients, while improving the insulin sensitivity indexes in hyperinsulinemic patients [15]. Meta-analysis of RCTs reported that isoflavone use was not related to a significant glycemia reduction in postmenopausal non-Asian women [16]. Like this, the effect of isoflavone intake on MetS-related disorders (CVD and regulation of blood glucose) is not consistent with the study conducted on humans. Thus, the purpose of this study is to observe the relationship of the nutritive conditions of isoflavones and the factors related to metabolic syndrome in postmenopausaul women who are exposed to various meta- bolic risks.
Materials and Methods
Subjects
The study involved 106 women aged 47 to 85 years. Study subjects were recruited for the study by the use of advertise- ments. This study was conducted according to the guidelines laid down in the Declaration of Helsinki and all procedures
involving human subjects were approved by the Sookmyung Women’s University Research Ethics Committee. After suf- ficiently explaining the objective and details of this research, written informed consent was obtained from participants.
Questionnaire and dietary assessment
Each participant was interviewed by the investigators using a questionnaire. The questionnaire elicited information about the participant’s age, cigarette smoking, alcohol consumption, and daily physical activity level. Dietary intakes were surveyed under investigator guidance using a 24-h recall method.
A color photograph of the food items, dishes, glasses, and spoons of various sizes were used to improve the accuracy of portion size estimates. The 24-h recall results were analyzed by a computer-aided nutrient analysis program for profes- sionals (CAN-Pro 2.0, APAC Intelligence, Seoul, South Korea).
To calculate the intake of isoflavones, domestic and overseas data analyzing genistein, and diadzein, the major isoflavones, were used [17-20].
Anthropometric measures and blood pressure
Height and body weight were measured by using an elec- trical digital scale (DS-102; JENIX, Korea) while the subjects wearing light clothes without shoes were in the standing position. Body weight was measured to the nearest 0.1 kg and height was measured to the nearest 0.1 cm. Body mass index (BMI) was calculated as body weight (kg) / [height (m)]2. The percentage of body fat was calculated by bioelectric im- pedance analysis using InBody 3.0 (Biospace, Seoul, South Korea). The waist circumference was measured at the smallest circumference between the rib cage and iliac crest with the subject in the standing position. Systolic blood pressures (SBP) and diastolic blood pressures (DBP) were measured twice with an automatic electronic sphygmomanometer (BP-750A; NISSEI Commerce, Ltd., Tokyo, Japan).
Laboratory methods
Blood samples were collected from the subjects on empty stomachs. The samples were left at room temperature for 30 minutes, centrifuged for 15 minutes at 2,500 rpm to separate the serum, and then stored at -70ºC. Fasting glucose, tri- glyceride (TG), and high density lipoprotein-cholesterol (HDL- cholesterol) were determined until an auto analyzer (Hitachi 747; Hitachi, Tokyo, Japan). Urine samples were taken and kept frozen at -20ºC until they were analyzed. Urinary creatinine
concentrations were measured with a Hitachi chemistry auto analyzer (Hitachi 747; Hitachi, Tokyo, Japan) by using a kit from Boehringer Mannheim (Mannheim, Germany) that is based on a kinetic modification of the Jaffe’s reaction.
Analysis of isoflavone in urine was performed using the method of Maskarinec et al. [21] which is based on the HPLC method. Genistein and diadzein in urine were analyzed by using LC-10AVP (Shimadzu, Kyoto, Japan) for HPLC, Shim- pack VP-ODS (250 × 4.6 mm, 4 um) reverse-phase column (Shimadzu, Kyoto, Japan), and Shim pack (10 × 4.6 mm, 4 um) direct connect guard column (Shimadzu, Kyoto, Japan). Then genistein and diadzein value in urine changed into creatinine value (nmol/mg Cr). The total amount of isoflavone in urine was calculated by adding genisteina and diadzein in urine.
Criteria for MetS
The presence of MetS was defined using a modified version of the ATP III criteria [22]. The five MetS components were de- fined using the following ATP III categorizations: 1) abdominal obesity (defined as waist circumference ≥ 85 cm for women in Korean) [23], 2) high blood pressure (≥130 mmHg SBP and/or
≥85 mmHg DBP), 3) high fasting blood glucose (≥100 mg/dL), 4) high TG (≥150 mg/dL), and 5) low HDL-cholesterol (<50 mg/dL).
The third criterion, fasting blood glucose, was changed to 100 mg/dL from the initial cutoff point of 110 mg/dL according to the revised guideline [24]. The subjects with three or more of the above mentioned criteria were defined as having MetS.
MetS risk score was determined by adding the number of risk factors, waist circumference, TG, HDL-cholesterol, glucose, and blood pressure. The study population was divided into two groups according to the MetS risk score: control group (MetS risk score < 3; n = 60), and MetS group (MetS risk score ≥ 3; n
= 46).
Statistical analyses
The statistic analyses were performed using the SAS 9.2 program (SAS Inc., Cary, NC, USA). Differences in continu- ous variables of socio-demographics, anthropometric, clini- cal, and metabolic parameters between the MetS group and the control group were evaluated by the t-test for normally distributed variables. As the distributions of variables devi- ated significantly from normal, they were normalized by log- transformation, and log-transformed values were used in the analysis. Differences in categorical socio-demographic variables were evaluated by the chi-square test. Correlations
between urinary isoflavone excretion and MetS risk factor variables were assessed by Pearson’s partial correlation coef- ficients, adjusting for age and energy intake. All of the above analyses were considered significant at p < 0.05 (two tailed).
Results
Socio-demographic, anthropometric, and metabolic param- eters of the subjects in the MetS group and control group are shown in Table 1. The average age of the control and MetS group participants were 62.37 yrs and 63.46 yrs, respectively, and there was no significant difference. Body weight (p <
0.05), BMI (p < 0.001) and percent body fat (p < 0.001) of the MetS group were significantly higher than those of the control group. In metabolic parameters, the MetS group exhibited significantly higher waist circumference (p < 0.0001), SBP (p <
0.001), DBP (p < 0.01), TG (p < 0.0001), and glucose (p < 0.001) levels and lower HDL-cholesterol level (p < 0.0001) than the control group. There were no differences between the MetS group and the control group according to alcohol use, smok- ing status, and physical activity.
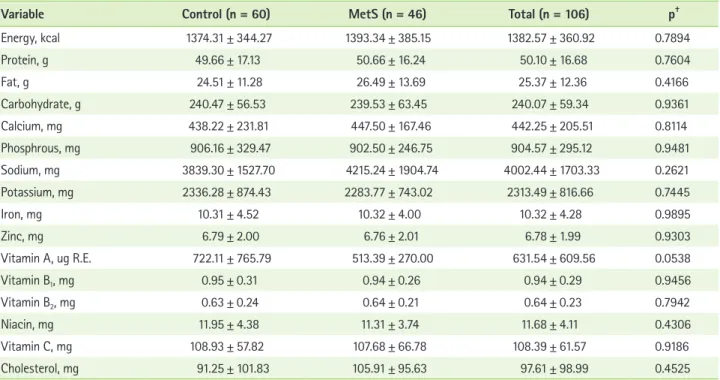
Energy and nutrient intakes of the MetS group and control group are shown in Table 2. The average energy intakes of the control and MetS group were 1374.31 kcal and 1393.34 kcal, respectively, with no significant difference. Also, no significant differences in nutrient intakes between the MetS group and the control group were observed. Food intakes from each food group of the MetS group and control group are shown in Table 3. The average food intakes of the control and MetS group were 918.91 g and 923.89 g, respectively, with no significant difference. Also, there was no significant difference in food intake from each group between two groups.
Isoflavone intakes and excretion in urine of the MetS group and control group are shown in Table 4. The average isofla- vone intakes of the control and MetS group were 31.64 mg/
day and 27.99 mg/day, respectively, and there was no signifi- cant difference. The MetS group showed a significantly higher daidzein level in urine (p < 0.05) than the control group. Also, the MetS group tended to be high in urinary isoflavone level compared to the control group without statistical significance (p = 0.0583).
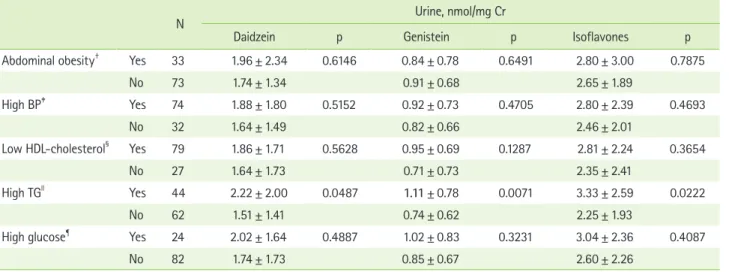
Urinary isoflavone excretion according to the abnormali- ties of MetS individual diagnostic components is presented in Table 5. Subjects with high serum TG had higher urinary daid- zein (p < 0.05), genistein (p < 0.01) and isoflavone (p < 0.05)
Table 1. Socio-demographic, anthropometric and metabolic parameters of the study subjects*
Variable Control (n = 60) MetS (n = 46) Total (n = 106) p†
Socio-demographic parameters
Age, yr 62.37 ± 9.46 63.46 ± 8.01 62.84 ± 8.84 0.5318
Alcohol use, % 6.67 13.04 9.43 0.2656
Smoking, % 1.67 4.35 2.83 0.4094
Physical activity, % Mild 21.67 34.78 27.36 0.3164
Moderate 56.67 45.65 51.89
Heavy 21.67 19.57 20.75
Anthropometric parameters
Height, cm 154.18 ± 5.99 152.94 ± 5.05 153.64 ± 5.61 0.2597
Weight, kg 54.77 ± 8.82 58.80 ± 7.46 56.52 ± 8.46 0.0142
BMI, kg/m2 22.95 ± 2.90 25.23 ± 3.67 23.94 ± 3.43 0.0005
Percent body fat, % 31.76 ± 6.57 37.33 ± 7.75 34.20 ± 7.60 0.0001
Metabolic parameters
Waist circumference, cm 78.00 ± 6.70 84.65 ± 7.65 80.89 ± 7.83 <0.0001
SBP, mmHg 135.50 ± 23.69 150.98 ± 20.40 142.22 ± 23.52 0.0006
DBP, mmHg 81.45 ± 14.77 90.24 ± 12.22 85.26 ± 14.34 0.0015
TG, mg/dL 111.70 ± 44.81 206.70 ± 96.92 152.92 ± 85.98 <0.0001
HDL-cholesterol, mg/dL 50.17 ± 11.58 35.96 ± 7.15 44.00 ± 12.14 <0.0001
Glucose, mg/dL 89.48 ± 11.29 104.91 ± 28.78 96.18 ± 22.04 0.0004
BMI: body mass index, SBP: systolic blood pressure, DBP: diastolic blood pressure, HDL: high density lipoprotein, TG: triglyceride.
*Values are presented as mean ± SD; †Significance as determined by Student’s t-test (control vs. MetS).
Table 2. Daily energy and nutrient intake of the study subjects*
Variable Control (n = 60) MetS (n = 46) Total (n = 106) p†
Energy, kcal 1374.31 ± 344.27 1393.34 ± 385.15 1382.57 ± 360.92 0.7894
Protein, g 49.66 ± 17.13 50.66 ± 16.24 50.10 ± 16.68 0.7604
Fat, g 24.51 ± 11.28 26.49 ± 13.69 25.37 ± 12.36 0.4166
Carbohydrate, g 240.47 ± 56.53 239.53 ± 63.45 240.07 ± 59.34 0.9361
Calcium, mg 438.22 ± 231.81 447.50 ± 167.46 442.25 ± 205.51 0.8114
Phosphrous, mg 906.16 ± 329.47 902.50 ± 246.75 904.57 ± 295.12 0.9481
Sodium, mg 3839.30 ± 1527.70 4215.24 ± 1904.74 4002.44 ± 1703.33 0.2621
Potassium, mg 2336.28 ± 874.43 2283.77 ± 743.02 2313.49 ± 816.66 0.7445
Iron, mg 10.31 ± 4.52 10.32 ± 4.00 10.32 ± 4.28 0.9895
Zinc, mg 6.79 ± 2.00 6.76 ± 2.01 6.78 ± 1.99 0.9303
Vitamin A, ug R.E. 722.11 ± 765.79 513.39 ± 270.00 631.54 ± 609.56 0.0538
Vitamin B1, mg 0.95 ± 0.31 0.94 ± 0.26 0.94 ± 0.29 0.9456
Vitamin B2, mg 0.63 ± 0.24 0.64 ± 0.21 0.64 ± 0.23 0.7942
Niacin, mg 11.95 ± 4.38 11.31 ± 3.74 11.68 ± 4.11 0.4306
Vitamin C, mg 108.93 ± 57.82 107.68 ± 66.78 108.39 ± 61.57 0.9186
Cholesterol, mg 91.25 ± 101.83 105.91 ± 95.63 97.61 ± 98.99 0.4525
*Values are presented as mean ± SD; †Significance as determined by Student’s t-test (control vs. MetS).
excretions than those without such abnormalities.
Pearson’s partial correlation coefficients among the MetS risk score, diagnostic components of MetS, and urinary isofla- vone excretions are shown in Table 6. The correlation analysis indicated that the urinary genistein excretion (r = 0.238, p <
0.05) had positive correlation with the serum TG level after adjust ments for age and energy intake. The MetS risk score had no significant correlation with urinary daidzein, genistein,
and isoflavone excretions.
Discussion
In this cross-sectional study, no significant difference was observed in daily dietary isoflavone consumption between the Korean postmenopausal women with and without MetS.
Also, urinary isoflavone excretion was found to be positively Table 3. Food intakes from each food group of the subjects*
Variable Control (n = 60) MetS (n = 46) Total (n = 106) p†
(g/day)
Food 918.91 ± 272.93 923.89 ± 286.17 921.07 ± 277.42 0.9276
Cereals 266.09 ± 78.00 267.45 ± 80.57 266.68 ± 78.75 0.9301
Potato and starches 48.51 ± 74.48 27.35 ± 39.05 39.33 ± 62.30 0.0621
Sugars and sweeteners 3.80 ± 6.40 4.81 ± 9.84 4.24 ± 8.05 0.5441
Pulses 60.88 ± 59.07 68.28 ± 64.85 64.09 ± 61.45 0.5418
Nuts and seeds 6.15 ± 14.18 3.59 ± 8.02 5.04 ± 11.92 0.2428
Vegetables 262.59 ± 113.02 237.79 ± 116.14 251.83 ± 114.50 0.2711
Fungi and mushrooms 1.15 ± 2.95 1.69 ± 5.68 1.39 ± 4.33 0.5593
Fruits 133.85 ± 115.18 147.41 ± 128.10 139.73 ± 120.55 0.5683
Meats 17.52 ± 26.88 15.89 ± 21.96 16.81 ± 24.77 0.7392
Eggs 10.60 ± 19.20 10.63 ± 16.01 10.61 ± 17.80 0.9944
Fish and shellfishes 20.32 ± 23.99 26.95 ± 29.19 23.20 ± 26.45 0.2027
Seaweeds 7.91 ± 12.52 10.09 ± 20.26 8.86 ± 16.28 0.5229
Milks 31.04 ± 59.36 42.93 ± 71.50 36.20 ± 64.85 0.3520
Oils and fat 5.02 ± 3.15 5.83 ± 5.10 5.37 ± 4.11 0.3485
Beverages 15.24 ± 42.44 12.94 ± 39.41 14.24 ± 40.98 0.7753
Seasoning 25.16 ± 16.39 26.27 ± 15.42 25.64 ± 15.91 0.7239
Other 3.14 ± 12.37 12.14 ± 47.07 7.04 ± 32.49 0.2120
*Values are presented as mean ± SD; †Significance as determined by Student’s t-test (control vs. MetS).
Table 4. Daily isoflavone intakes and isoflavone excretion in urine of the subjects*
Variable Control (n = 60) MetS (n = 46) Total (n = 106) p†
Diet
Daidzein, mg 14.73 ± 19.75 12.77 ± 9.34 13.88 ± 16.05 0.4994
Genistein, mg 16.91 ± 19.95 15.23 ± 11.22 16.18 ± 16.68 0.5837
Isoflavones, mg 31.64 ± 39.63 27.99 ± 20.51 30.06 ± 32.65 0.5407
Urine
Daidzein, nmol/mg Cr 1.62 ± 1.45 2.05 ± 1.99 1.81 ± 1.71 0.0485
Genistein, nmol/mg Cr 0.82 ± 0.66 0.99 ± 0.76 0.89 ± 0.71 0.2924
Isoflavones, nmol/mg Cr 2.43 ± 2.00 3.04 ± 2.58 2.70 ± 2.28 0.0583
*Values are presented as mean ± SD; †Significance as determined by Student’s t-test (control vs. MetS).
associated with TG level, and inversely associated with HDL- cholesterol levels.
In this study, we evaluated and compared isoflavone intake in Korean postmenopausal women between the MetS and control groups. The daily isoflavone intakes by the control group and the MetS group were 31.64 mg and 27.99 mg, respectively, with no significant difference. In the Shanghai Women’s Health Study (SWHS), the dietary isoflavone intake in women aged 40-70 years was 30.52 mg/day [25], and the iso- flavone intake in Japanese postmenopausal women was 26.7 mg/day [26]. However, in the Framingham Offspring Study, the daily isoflavone intake in postmenopausal women was 0.779 mg. Compared to Asian countries where soy food intake is
high, intake of isoflavone was low in western countries such as the US [27]. Postmenopausal Korean women showed a similar level of isoflavone intake compared to that of Chinese and Japanese middle aged women.
In the Framingham Offspring Study, de Kleijn et al. [27]
studied the relation of phytoestrogen intake and MetS in 939 postmenopausal women and reported that the TG levels in the highest quartile category of intake for isoflavones (sum of daidzein, genistein, formononetin, biochanin A and coumes- trol) was significantly lower than that in the lowest quartile category of intake for isoflavones. Also, in the highest quar- tile of isoflavone intake, the mean cardiovascular risk factor metabolic score was significantly lower than that in the lowest Table 5. Urinary isoflavone excretions according to the abnormalities in MetS components*
N Urine, nmol/mg Cr
Daidzein p Genistein p Isoflavones p
Abdominal obesity† Yes 33 1.96 ± 2.34 0.6146 0.84 ± 0.78 0.6491 2.80 ± 3.00 0.7875
No 73 1.74 ± 1.34 0.91 ± 0.68 2.65 ± 1.89
High BP‡ Yes 74 1.88 ± 1.80 0.5152 0.92 ± 0.73 0.4705 2.80 ± 2.39 0.4693
No 32 1.64 ± 1.49 0.82 ± 0.66 2.46 ± 2.01
Low HDL-cholesterol§ Yes 79 1.86 ± 1.71 0.5628 0.95 ± 0.69 0.1287 2.81 ± 2.24 0.3654
No 27 1.64 ± 1.73 0.71 ± 0.73 2.35 ± 2.41
High TGll Yes 44 2.22 ± 2.00 0.0487 1.11 ± 0.78 0.0071 3.33 ± 2.59 0.0222
No 62 1.51 ± 1.41 0.74 ± 0.62 2.25 ± 1.93
High glucose¶ Yes 24 2.02 ± 1.64 0.4887 1.02 ± 0.83 0.3231 3.04 ± 2.36 0.4087
No 82 1.74 ± 1.73 0.85 ± 0.67 2.60 ± 2.26
BP: blood pressure, HDL-C: high density lipoprotein-cholesterol, TG: triglyceride, p: Significance as determined by Student’s t-test (presence vs. absence of ab- normalities in MetS components).
*Values are presented as mean ± SD; †Waist circumference, ≥85 cm; ‡Systolic/diastolic BP ≥130/85 mmHg; §<50 mg/dL; ll≥150 mg/dL; ¶≥100 mg/dL.
Table 6. Correlation of urinary isoflavone excretions with the diagnostic component of MetS
Crude Adjustment age and energy intake
Daidzein Genistein Isoflavones Daidzein Genistein Isoflavones
Waist circumference 0.042 -0.037 0.020 0.015 -0.054 -0.007
SBP 0.091 0.086 0.095 0.148 0.179 0.168
DBP -0.051 0.010 -0.035 0.096 0.070 0.093
HDL-cholesterol -0.180 -0.277† -0.221* -0.037 -0.195 -0.093
TG 0.208* 0.269† 0.240* 0.127 0.238* 0.172
Glucose 0.108 0.118 0.118 0.180 0.133 0.175
MetS risk score 0.159 0.184 0.176 0.047 0.100 0.068
SBP: systolic blood pressure, DBP: diastolic blood pressure, HDL: high density lipoprotein, TG: triglyceride.
*p < 0.05; †p < 0.01.
quartile. However, in some intervention studies performed on postmenopausal women, it was reported that supplementing isoflavones did not have any effect in improving serum lipid [28,29], and making it difficult to reach a consistent conclu- sion on the positive effect that isoflavone intake has on MetS.
Meanwhile, our study has some limitations in calculating isoflavone intake. It should first be mentioned that in our study, daidzein and genistein intakes were calculated by using published databases, but the nutrient data are derived from the analysis of food samples from various sources and, as such, have limited accuracy then applied in a particular popu- lation [30]. Such limitation likely reduced the ability to detect significant associations in this study. Second, there is the pos- sibility that this study did not reflect the accurate intake of isoflavones, because the intake of isoflavones was calculated by adding only daidzein and genistein.
Urinary levels of isoflavonoid excretions are aggregate measurements of amounts of consumption, metabolism, and absorption of dietary isoflavone [31-34]. The dietary intake of daidzein and genistein after adjusting for total energy intake was significantly correlated with the urinary excretion [35].
When metabolized by gut flora, daidzein is converted to di- hydrodaidzein, O-desmethylangolensin (O-DMA), and equol, while genistein is metabolized to dihydrogenistein [31]. Both precursors and metabolites can be absorbed into the blood and then excreted, mainly in urine [36].
In our study, the Mets group had a significantly higher uri- nary daidzein level than the control group. And the urinary daidzein excretion was positively correlated with the serum TG level after adjustment for age and energy intake. These results are contrary to what we expected. We speculate that people consuming high isoflavones may have a certain dietary pat- tern related to developing Mets or increasing serum TG. But further studies are needed to prove this speculation.
This study found no meaningful relationship between the intake of isoflavones and the isoflavone level in urine, which was similar after adjusting for BMI and daily energy intake amount (data now shown). Referring to other stud- ies, metabolic activity of isoflavones may differ by individual [37]. Besides the intake amount of isoflavone, various factors which affect the excretion amount of isoflavones have been reported. In middle-aged and elderly Chinese women, it was reported that urinary excretion of isoflavones was correlated with soy food intake and healthy lifestyle (e.g., regular exer- cise) but was inversely associated with fruit intake [25]. Also,
Wu and colleagues’ study showed that urinary dihydrodaid- zein, equol, dihydrogenistein, and the metabolites of daidzein and genistein had a significantly negative correlation with BMI [25]. The metabolization of daidzein occurs in the gut through the action of a particular class of bacteria Clostridium sp, Eubacterium ramulus, Bacteroides ovatus, Bifidobacterium breve, etc [36]. The gut bacterial flora in obese individuals is known to differ from that in non-obese individuals. Like this urinary isoflavone excretion is affected by various factors such as weight, lifestyle, food intake and colonic environment.
Thus, it is difficult to assess isoflavone exposure status just by isoflavone in urine, so analysis of various indicators which can reflect the actual isoflavone exposure (e.g., serum level, etc) is necessary in the following study.
Conclusion
In this study, the MetS group did not show a significant dif- ference in isoflavone intake compared to the control group, but the MetS group showed a higher urinary isoflavone. Also, urinary daidzein was positively correlated with serum TG in the Korean postmenopausal women after adjusting for age and energy intake. There are some studies reporting the effect of isoflavone intake on MetS such as obesity, high blood pres- sure, hyperlipidemia, and impaired glucose metabolism, while there are no studies that observed the relationship between MetS and isoflavone excretion in urine, and this may elevate the value of this study.
References
1. Nestel P, Lyu R, Low LP, Sheu WH, Nitiyanant W, Saito I, Tan CE. Meta- bolic syndrome: recent prevalence in East and Southeast Asian popula- tions. Asia Pac J Clin Nutr 2007;16:362-7.
2. Lim S, Shin H, Song JH, Kwak SH, Kang SM, Won Yoon J, Choi SH, Cho SI, Park KS, Lee HK, Jang HC, Koh KK. Increasing prevalence of meta- bolic syndrome in Korea: the Korean National Health and Nutrition Examination Survey for 1998-2007. Diabetes Care 2011;34:1323-8.
3. Matthews KA, Meilahn E, Kuller LH, Kelsey SF, Caggiula AW, Wing RR.
Menopause and risk factors for coronary heart disease. N Engl J Med 1989;321:641-6.
4. Poehlman ET. Menopause, energy expenditure, and body composition.
Acta Obstet Gynecol Scand 2002;81:603-11.
5. Heidari R, Sadeghi M, Talaei M, Rabiei K, Mohammadifard N, Sar- rafzadegan N. Metabolic syndrome in menopausal transition: Isfahan Healthy Heart Program, a population based study. Diabetol Metab Syndr 2010;2:59.
6. Schneider JG, Tompkins C, Blumenthal RS, Mora S. The metabolic syn- drome in women. Cardiol Rev 2006;14:286-91.
7. Bracamonte MP, Miller VM. Vascular effects of estrogens: arterial protection versus venous thrombotic risk. Trends Endocrinol Metab
2001;12:204-9.
8. Grady D, Herrington D, Bittner V, Blumenthal R, Davidson M, Hlatky M, Hsia J, Hulley S, Herd A, Khan S, Newby LK, Waters D, Vittinghoff E, Wenger N; HERS Research Group. Cardiovascular disease outcomes during 6.8 years of hormone therapy: Heart and Estrogen/progestin Replacement Study follow-up (HERS II). JAMA 2002;288:49-57.
9. Rossouw JE, Anderson GL, Prentice RL, LaCroix AZ, Kooperberg C, Stefanick ML, Jackson RD, Beresford SA, Howard BV, Johnson KC, Kotchen JM, Ockene J; Writing Group for the Women’s Health Initiative Investigators. Risks and benefits of estrogen plus progestin in healthy postmenopausal women: principal results From the Women’s Health Initiative randomized controlled trial. JAMA 2002;288:321-33.
10. Xia X, Weng J. Targeting metabolic syndrome: candidate natural agents.
J Diabetes 2010;2:243-9.
11. Cherniack EP. Polyphenols: planting the seeds of treatment for the metabolic syndrome. Nutrition 2011;27:617-23.
12. Potter SM. Overview of proposed mechanisms for the hypocholester- olemic effect of soy. J Nutr 1995;125:606S-611S.
13. Kui per GG, Lemmen JG, Carlsson B, Corton JC, Safe SH, van der Saag PT, van der Burg B, Gustafsson JA. Interaction of estrogenic chemi- cals and phytoestrogens with estrogen receptor beta. Endocrinology 1998;139:4252-63.
14. Goodman-Gruen D, Kritz-Silverstein D. Usual dietary isoflavone intake is associated with cardiovascular disease risk factors in postmeno- pausal women. J Nutr 2001;131:1202-6.
15. Villa P, Costantini B, Suriano R, Perri C, Macrì F, Ricciardi L, Panunzi S, Lanzone A. The differential effect of the phytoestrogen genistein on cardiovascular risk factors in postmenopausal women: relationship with the metabolic status. J Clin Endocrinol Metab 2009;94:552-8.
16. Ricci E, Cipriani S, Chiaffarino F, Malvezzi M, Parazzini F. Effects of soy isoflavones and genistein on glucose metabolism in perimenopausal and postmenopausal non-Asian women: a meta-analysis of random- ized controlled trials. Menopause 2010;17:1080-6.
17. de Kleijn MJ, van der Schouw YT, Wilson PW, Adlercreutz H, Mazur W, Grobbee DE, Jacques PF. Intake of dietary phytoestrogens is low in postmenopausal women in the United States: the Framingham study(1-4). J Nutr 2001;131:1826-32.
18. Franke AA, Hankin JH, Yu MC, Maskarinec G, Low SH, Custer LJ. Iso- flavone levels in soy foods consumed by multiethnic populations in Singapore and Hawaii. J Agric Food Chem 1999;47:977-86.
19. Liggins J, Bluck LJ, Runswick S, Atkinson C, Coward WA, Bingham SA.
Daidzein and genistein content of fruits and nuts. J Nutr Biochem 2000;11:326-31.
20. Lee SK, Lee MJ, Yoon S, Kwon DJ. Estimated isoflavone intake from soy products in Korean middle-aged women. J Korean Soc Food Sci Nutr 2000;29:948-56.
21. Maskarinec G, Singh S, Meng L, Franke AA. Dietary soy intake and urinary isoflavone excretion among women from a multiethnic popula- tion. Cancer Epidemiol Biomarkers Prev 1998;7:613-9.
22. Expert Panel on Detection, Evaluation, and Treatment of High Blood Cholesterol in Adults. Executive Summary of The Third Report of The National Cholesterol Education Program (NCEP) Expert Panel on Detec- tion, Evaluation, And Treatment of High Blood Cholesterol In Adults (Adult Treatment Panel III). JAMA 2001;285:2486-97.
23. Lee S, Park HS, Kim SM, Kwon HS, Kim DY, Kim DJ, Cho GJ, Han JH, Kim
SR, Park CY, Oh SJ, Lee CB, Kim KS, Oh SW, Kim YS, Choi WH, Yoo HJ.
Cut-off points of waist circumference for defining abdominal obesity in the Korean population. Korean J Obes 2006;15:1-9.
24. Grundy SM, Cleeman JI, Daniels SR, Donato KA, Eckel RH, Franklin BA, Gordon DJ, Krauss RM, Savage PJ, Smith SC Jr, Spertus JA, Costa F;
American Heart Association; National Heart, Lung, and Blood Institute.
Diagnosis and management of the metabolic syndrome: an American Heart Association/National Heart, Lung, and Blood Institute Scientific Statement. Circulation 2005;112:2735-52.
25. Wu X, Cai H, Gao YT, Dai Q, Li H, Cai Q, Yang G, Franke AA, Zheng W, Shu XO. Correlations of urinary phytoestrogen excretion with lifestyle factors and dietary intakes among middle-aged and elderly Chinese women. Int J Mol Epidemiol Genet 2012;3:18-29.
26. Kokubo Y, Iso H, Ishihara J, Okada K, Inoue M, Tsugane S; JPHC Study Group. Association of dietary intake of soy, beans, and isoflavones with risk of cerebral and myocardial infarctions in Japanese populations: the Japan Public Health Center-based (JPHC) study cohort I. Circulation 2007;116:2553-62.
27. de Kleijn MJ, van der Schouw YT, Wilson PW, Grobbee DE, Jacques PF.
Dietary intake of phytoestrogens is associated with a favorable meta- bolic cardiovascular risk profile in postmenopausal U.S.women: the Framingham study. J Nutr 2002;132:276-82.
28. Nikander E, Tiitinen A, Laitinen K, Tikkanen M, Ylikorkala O. Effects of isolated isoflavonoids on lipids, lipoproteins, insulin sensitiv- ity, and ghrelin in postmenopausal women. J Clin Endocrinol Metab 2004;89:3567-72.
29. Gallagher JC, Satpathy R, Rafferty K, Haynatzka V. The effect of soy protein isolate on bone metabolism. Menopause 2004;11:290-8.
30. Willett W. Nutritional epidemiology. 2nd ed. New York: Oxford Univer- sity Press; 1998.
31. Ward H, Chapelais G, Kuhnle GG, Luben R, Khaw KT, Bingham S; Eu- ropean Prospective into Cancer-Norfolk cohort. Breast cancer risk in relation to urinary and serum biomarkers of phytoestrogen exposure in the European Prospective into Cancer-Norfolk cohort study. Breast Cancer Res 2008;10:R32.
32. Murkies A, Dalais FS, Briganti EM, Burger HG, Healy DL, Wahlqvist ML, Davis SR. Phytoestrogens and breast cancer in postmenopausal women: a case control study. Menopause 2000;7:289-96.
33. den Tonkelaar I, Keinan-Boker L, Veer PV, Arts CJ, Adlercreutz H, Thijs- sen JH, Peeters PH. Urinary phytoestrogens and postmenopausal breast cancer risk. Cancer Epidemiol Biomarkers Prev 2001;10:223-8.
34. Liu B, Qin L, Liu A, Uchiyama S, Ueno T, Li X, Wang P. Prevalence of the equol-producer phenotype and its relationship with dietary isoflavone and serum lipids in healthy Chinese adults. J Epidemiol 2010;20:377-84.
35. Arai Y, Uehara M, Sato Y, Kimira M, Eboshida A, Adlercreutz H, Wata- nabe S. Comparison of isoflavones among dietary intake, plasma con- centration and urinary excretion for accurate estimation of phytoes- trogen intake. J Epidemiol 2000;10:127-35.
36. Atkinson C, Frankenfeld CL, Lampe JW. Gut bacterial metabolism of the soy isoflavone daidzein: exploring the relevance to human health. Exp Biol Med (Maywood) 2005;230:155-70.
37. Franke AA, Halm BM, Kakazu K, Li X, Custer LJ. Phytoestrogenic isoflavonoids in epidemiologic and clinical research. Drug Test Anal 2009;1:14-21.