Printed in the Republic of Korea
http://dx.doi.org/10.5012/jkcs.2014.58.2.205
Formation Fe
2O
3Nanowalls through Solvent-Assisted Hydrothermal Process and Their Application for Titan Yellow GR Dye Degradation
Khalid Abdelazez Mohamed Ahmed†,‡,*
†Department of Chemistry, Faculty of Science and Technology, Al-Neelain University, P. O. Box 12702, Khartoum-Sudan
‡Department of Chemistry, Faculty of Science and Education, Taif University, P. O. Box 888, Saudi Arabia. *E-mail: [email protected]
(Received October 15, 2013; Accepted February 11, 2014)
ABSTRACT. Hematite iron oxide (α-Fe2O3) nanowalls were fabricated on aluminum substrate by a facile solvent-assisted hydrothermal oxidation process. The XRD and EDS patterns indicate that the sample has a rhombohedral phase of hematite Fe2O3. FE-SEM, TEM, HR-TEM, SA-ED were employed to characterize the resulting materials. N2 adsorption-desorption isotherms was used to study a BET surface area. Their capability of catalytic degradation of titan yellow GR azo dye with air oxygen in aqueous solution over Fe2O3 catalysts was studied. The result indicates that the as-prepared product has a high catalytic activity, because it has a larger surface area. Langmuir and Freundlich isotherms of adsorption dye on the catalysts surface were investigated and the decomposition of titan yellow GR follows pseudo-first order kinetic.
Key words: Iron oxide, Synthesis, Nanowalls, Catalyst, Titan yellow GR
INTRODUCTION
Iron oxides have attracted an enormous amount of interest because of their great scientific and technological importance in catalysts, pigments, and gas sensors.1−3 Hematite has a rhombohedrally centered hexagonal structure of the corundum type with a close-packed oxygen lattice in which two-thirds of the octahedral sites are occupied by Fe3+ ions.4 Previously a lot of reports have been carried out on Fe2O3 due to its low cost and nontoxic property.4 Now- adays, almost researches have, therefore, been focused on the fabrication of Fe2O3 nanostructured materials, because nanoscale materials are often exhibited very interesting physical and chemical properties, which are significantly different from those of their bulk counterparts in many field applications such as catalysis,5−7 gas sensing,8, 9 magnetic recording,9 drug delivery.10
The efficiency and performance of any process are directly determined by the properties of underlying nanostruc- tures, which are in turn greatly dependent on the crystal- lographic orientation, size, shape, and morphology.11 May numerous synthesis conditions of iron oxides nanocrys- tals were reported with enhanced chemical characteristics.
α-Fe2O3 nanomaterials such as12 nanoparticles, nano- tubes,13 nanowires,14 nanocubes,15 nanorods,16 spindles,17 hollow spheres,18,19 nanoplates,20 nanorings,21 rhombohedra22 and complex hierarchical structures constructed with
nanoscale building blocks have recently been prepared by different routes.23−28 However, the synthesis of 2D Fe2O3
nanocrystals are extremely challenging, because the sur- face energies of various low index faces are so close that a selective growth along one specific facet is very hard to be realized. Among them, the exploration of hydrothermal routes for the synthesis of Fe2O3 has, therefore, been worth attempted on Ni foam by hydrothermal method.29 Although the synthesis of two-dimensional nanostructure they were made greeted progress in the last few years and reached a very high level of sophistication, our understanding of nanowalls formation lags considerably behind. Until now, they were several literatures reported on diversiform of nanowalls. Liang et al.30 reported that ZnO nanowalls on ITO coated glass substrates by using an aqueous solution growth method at low temperature. Materials such as α- Fe2O3 and NiO nanowall arrays were also grown on Ni foam.29,31,32
Herein in this work, solvent-assisted hydrothermal oxi- dation method and aluminum substrate were employed to fabricate Fe2O3 nanowalls. The wider varieties of tech- niques were utilized to characterize the resulting material.
The degradation of titan yellow GR azo dye by O2 was used as a probe reaction to investigate the promotion effect of Fe2O3 catalysts. Langmuir and Freundlich isotherms of adsorption dye on the catalysts surface and reaction rate constant were also determined.
EXPERIMENTAL
All the employed reagents in this study were of ana- lytical grade. To prepare Fe2O3 nanowalls, 3 mmol ammo- nium iron sulfate was dissolved in 50 ml of base solution contents 7 ml of ammonia and 5 ml of (0.1 M) NaOH.
The solution was stirred for 30 min at room temperature, and then the solution was filtered off. The solution was then transferred into a sealed aluminum bottle in which the substrates were suspended vertically. The sealed bottle was subsequently put into an oven kept at 180oC for 8 h. The green precipitate was washed with distilled water and absolute ethanol for several times by using centrifugation at 6000 rpm to remove the excessive reactants and byprod- ucts, followed by drying in a vacuum at 70oC for 4 h.
The potential use of the synthesized Fe2O3 nanowalls as catalyst material for degradation of titan yellow GR by O2 application was assessed. Typically, 0.5 g of titan yellow GR dye was dissolved in 200 ml of distilled water. Briefly, 0.025 mmol of as-prepared α-Fe2O3 nanomaterials was added into the three-neck flask. At regular time, intervals samples were taken from three-neck glass after removed the catalytic powder. The decreases in absorbance of titan yellow GR solution were recorded by using UV-vis spec- trophotometer (Shimadzu; 2450).The degree of degradation was calculated using the relation [D% = (1−At/Ao)100].
RESULTS AND DISCUSSION
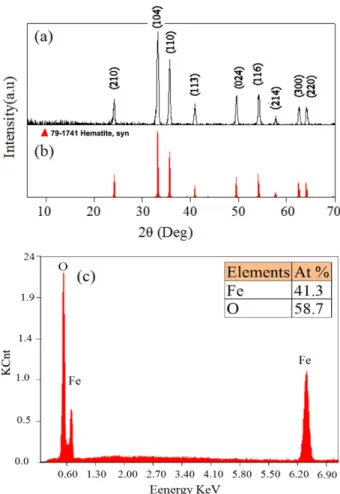
The crystal structure of α-Fe2O3 was estimated by XRD pattern (Fig. 1(a)). All X-ray diffraction patterns peaks of product can be easily indexed to that of a pure rhombo- hedral phase of hematite Fe2O3 structure with a = b = 5.03420Å and c = 13.746Å, which is in good agreement with the standard data from JCPDS card no. 79−1741 (Fig. 1(b)) and space group of R-3c (no. 167).33 No peaks of any other impurity phases were detected from XRD patterns, revealing the high purity of the product. Fig. 3 EDS spectra of Fe2O3 nanowalls, obtained during SEM also demonstrated and supported of XRD results.
The surface adsorption capacity of α-Fe2O3 is investi- gated by N2 sorption isotherm. According to IUPAC clas- sification, the isotherm of sample resembled type IV closely or faintly, suggests that mesopores is may be existed. N2
adsorption-desorption isotherms (Fig. 2) for form of structured α-Fe2O3 show type IV isotherms with H1 hys- teresis loop, confirming the mesoporosity. The specific surface areas of α-Fe2O3 nanowalls estimated from the Brunauer-Emmett-Teller (BET) method is 107.4 m2 g−1.
Top-view image of materials has grown on aluminum substrate by a solvent-assisted hydrothermal oxidation method.
Fig. 3(a) shows that SEM images of nanowalls are inter- connected like spider-web network. Fig. 3(b) depicts the α-Fe2O3 nanowalls with cross-section and irregular walls.
Figure 1. (a) XRD patterns, (b) the standard data from JCPDS card no. 79-1741 and (c) EDS of α-Fe2O3 nanowalls.
Figure 2. N2 adsorption-desorption isotherm curve of α-Fe2O3
nanowalls.
The walls have thickness is around 30 nm and average lengths are about 500−700 nm. The TEM studies of the as-synthesized product confirmed the 2D-conguration of the nanowalls (Fig. 3(c)). Interestingly, selected area elec- tronic diffraction (SA-ED) pattern of α-Fe2O3 nanowalls (inserted of Fig. 3(c)) obtaining the product is polycrys- talline structure. HR-TEM image of the α-Fe2O3 nanow- alls is shown in Fig. 3(d). The calculated interplanar distance is about 0.268 nm, which correspond to {104} plane.
In our previous work, the impact of ammonia on the 2D nanostructures such as Mn3O4 hexagonal nanoplates was investigated.34 In current study, the ammonium and sodium hydroxides have, therefore, been proved to play an impor- tant role for the formation α-Fe2O3 nanowalls. In our system, iron II ions is oxidized to form Fe(OH)3. However, the control of particle size distribution is limited, because only kinetic factors are controlling the growth of the crystal. In the precipitation process, two stages are involved i.e., a short burst of nucleation occurs when the concentration of the species reaches critical super saturation, and then, there is a slow growth of the wall nuclei by diffusion of the sol- utes to the surface of the crystal on aluminum foams.The complex material of iron ammoniate might is play an impor- tant role in controlling not only release velocity of Fe2+ ions, but also growth direction of α-Fe2O3 nanowalls. Finally, the resulting Fe(OH)3 decompose into α-Fe2O3 and the growth process is following:
Fe2+ + 3NH4OH → Fe(OH)3 +3NH4+
Fe2+ + nNH3→ Fe(NH3)n (n = 1−4) 2Fe2+ + O2 + 2OH¯→ α−Fe2O3 + H2O
The contamination of water supplies by organic mole- cules is an increasing problem mainly because many of these molecules are not readily degraded by conventional methods for the treatment of effluents. This problem has increased with the development of the textile industry because many of the pollutants are dyes used by them.35,36 Because it is easily dissolved in water, titan yellow GR is one an important factor in environmental pollution from the textile industry and study of degradation mechanism to be quite well. In this area, the degradation of titan yellow GR with oxygen air babbles catalyzed by α-Fe2O3 nanowalls is occurred without adjust of pH and under atmospheric pressure at room temperature. Fig. 4 reveals that the UV- visible spectrum of titan yellow GR have consisted of two main characteristic absorption peaks at 402 nm in visible region and another at 319 nm in UV region. The peak in a visible region is attributed to chromospheres containing azine linkage, whereas the peak obtained in a UV region is assigned to aromatic rings. When titan yellow GR solu- tion is treated by α-Fe2O3 nanowalls catalyst in presence of O2 at room temperature without adjustment pH, the absorption intensity of both peaks are reduced with times, suggesting the dye is gradually degraded, including deg- radation of the aromatic structure.
On the basis of the surface characterization results described above, it is now instructive to study the cata- lytic activity of α-Fe2O3 nanowalls with different stage of reactants. Curve (I) in Fig. 5 shows the titan yellow GR has hardly been decomposed in absences of catalyst and presence of air babble. Own more than 24.4% of dye is Figure 3. (a) Low-magnification SEM images, (b) High-magni-
fication SEM images, (c) TEM images (insert a SE-ED) and (d) HR-TEM images of α-Fe2O3 nanowalls.
Figure 4. UV-vis spectra of degradation of titan yellow GR by α-Fe2O3 nanowalls.
degraded in an absence of air babbles and present of cat- alyst (curve II, Fig. 5). An about 96.6% of dye degrada- tion is occurred in the presence of α-Fe2O3 nanowalls and O2 air (curve III, Fig. 5). On the other hand, the adsorption of titan yellow GR on the α-Fe2O3 nanowalls surface was studied by Freundlich and Langmuir isotherms eq.1,2.
log (1)
(2)
where x, m, C, K and n are number moles of titan yellow GR adsorbed by catalyst surface, mass of α-Fe2O3 nanow- alls, concentration of titan yellow GR in the solution after 1 h of adsorption in the dark, adsorption constant and con- stant characteristic for an exact system, respectively.
The linear relation and higher value of correlation coef- ficients (R2= 0.97078) can be represented on a Langmuir isotherm (Fig. 6(a). The correlation coefficient obtained from Freundlich isotherm of titan yellow GR adsorption on the catalysts surface was established of R2= 0.9286 (Fig. 6(b)) suggesting the adsorption of catalyst, mean- while, the presence of O2 is necessary but the oxygen flow rate has no significant effect on the degradation process.
Because the oxygen is excess and the reaction rate only depends on the concentration of titan yellow GR dye, the reaction can be considered pseudo first order. As shown in Fig. 7, the plots of log (Ao/At) vis. times (minutes) are straight lines. The rate constant may be calculated as:
K = 2.303/t log (Ao/At). From the plots, the rate constants for degradation of titan yellow GR catalyzed by α-Fe2O3 nanowalls is about 4.832 × 10⁻² min−1, this value is higher x
m---- log k 1 n--- log C +
= Ct (x/m) --- 1
k x/m( )∞ --- C
(x/m)∞ --- +
=
Figure 5. The degradation percentage of titan yellow GR with (I) O2 only (II) α-Fe2O3 nanowalls only and (III) α-Fe2O3 nanowalls + O2 with times.
Figure 6. (a) Langmuir isotherm and (b) Freundlich isotherm of titan yellow GR adsorption on α-Fe2O3 nanowalls catalyst sur- face.
Figure 7. The degradation rate of titan yellow GR with O2 by α- Fe2O3 nanowalls.
than de-colorization of this dye by using bacteria isolated from textile dye.37
CONCLUSION
In conclusions, α-Fe2O3 nanowalls grown on aluminum were prepared by a facile solvent-assisted hydrothermal oxidation method and applied as the catalyst material for degradation of titan yellow GR. The nanowalls with cross- section has thickness is around 30 nm and an average length of 500−700 nm. The decomposition of titan yellow GR follows pseudo-first order kinetic. The adsorption dye on the catalysts surface was investigated by Langmuir and Freundlich isotherms. This results suggest that α-Fe2O3 nanowalls shows promising applications in the degrada- tion of dye, like titan yellow GR.
Acknowledgments. The author kindly acknowledge the financial support from the Vice-Presidency of Graduate Studied and Academic Research; Taif University (project 1-435-2998).
REFERENCES
1. Huo, L. H.; Li, W.; Lu, L.; Cui, H. N.; Xi, S. Q.; Wang, J.; Zhao, B.; Shen, Y. C.; Lu, Z. H. Chem. Mater. 2000, 12, 790.
2. Gondal, M. A.; Hameed, A.; Yamani, Z. H.; Suwaiyan, A. Chem. Phys. Lett. 2004, 385, 111.
3. Han, J. S.; Bredow, T.; Davey, D. E.; Yu, A. B.; Mulcahy, D. E. Sens. Actuators B 2001, 75, 18.
4. Zboril, R.; Mashlan, M.; Petridis, D. Chem. Mater. 2002, 14, 969.
5. Pulgarin, C.; Kiwi, J. Langmuir 1995, 11, 519.
6. Zhang, G.; Gao, Y.; Zhang, Y.; Guo, Y. Environ. Sci. Technol.
2010, 44, 6384.
7. Carneiro, P. A.; Nogueira, R. F. P.; Zanoni, M. V. B. Dyes Pigm. 2007, 74, 127.
8. Pelino, M.; Colella, C.; Cantallini, C.; Faccio, M.; Ferri, G.;
D’Amico, A. Sens Actuators, B 1992, 7, 464.
9. Wu, C.; Yin, P.; Zhu, X.; OuYang, C.; Xie, Y. J. Phys. Chem.
B 2006, 110, 17806.
10. Widder, K. J.; Senyei, A. E.; Scarpelli, D. G. Proc. Soc.
Exp. Biol. Med. 1978, 58, 141.
11. Pradhan, D.; Sindhwani, S.; Leung, K. T. Nanoscale Res.
Lett. 2010, 5, 1727.
12. Woo, K.; Hong, J. W.; Choi, S. M.; Lee, H. W.; Ahn, J.
P.; Kim, C. S.; Lee, S. W. Chem. Mater. 2004, 16, 2814.
13. Chen, J.; Xu, L. N.; Li, W. Y.; Gou, X. L. Adv. Mater.
2005, 17, 582.
14. Wen, X. G.; Wang, S. H.; Ding, Y.; Wang, Z. L.; Yang, S.
H. J. Phys. Chem. B 2005, 109, 215.
15. Zheng, Y. H.; Cheng, Y.; Wang, Y. S.; Bao, F.; Zhou, L. H.;
Wei, X. F.; Zhang, Y. Y.; Zheng, Q. J. Phys. Chem. B 2006, 110, 3093.
16. Vayssieres, L.; Sathe, C.; Butorin, S. M.; Shuh, D. K.; Nor- dgren, J.; Guo, J. H. Adv. Mater. 2005, 17, 2320.
17. Zeng, S. Y.; Tang, K. B.; Li, T. W.; Liang, Z. H.; Wang, D.; Wang, Y. K.; Zhou, W. W. J. Phys. Chem. C 2007, 111, 10217.
18. Wu, Z. C.; Yu, K.; Zhang, S. D.; Xie, Y. J. Phys. Chem.
C 2008, 112, 11307.
19. Gou, X. L.; Wang, G. X.; Park, J. S.; Liu, H.; Yang, J.
Nanotechnol. 2008, 19, 125606.
20. Casula, M. F.; Jun, Y. W.; Zaziski, D. J.; Chan, E. M.; Corrias, A.; Alivisatos, A. P. J. Am. Chem. Soc. 2006, 128, 1675.
21. Hu, X. L.; Yu, J. C.; Gong, J. M.; Li, Q.; Li, G. S. Adv.
Mater. 2007, 19, 2324.
22. Park, T. J.; Wong, S. S. Chem. Mater. 2006, 18, 5289.
23. He, K.; Xu, C. Y.; Zhen, L.; Shao, W. Z. Mater. Lett.
2008, 62, 739.
24. Li, S. Z.; Zhang, H.; Wu, J. B.; Ma, X. Y.; Yang, D. R.
Cryst. Growth Des. 2006, 6, 351.
25. Zhong, L. S.; Hu, J. S.; Liang, H. P.; Cao, A. M.; Song, W. G.; Wan, L. J. Adv. Mater. 2006, 18, 2426.
26. Zhu, L. P.; Xiao, H. M.; Liu, X. M.; Fu, S.Y. J. Mater.
Chem. 2006, 16, 1794.
27. Zhu, L. P.; Xiao, H. M.; Fu, S. Y. Cryst. Growth Des.
2007, 7, 177.
28. Cao, M. H.; Liu, T. F.; Gao, S.; Sun, G. B.; Wu, X. L.; Hu, C. W.; Wang, Z. L. Angew. Chem. Int. Ed. 2005, 44, 4197.
29. Lei, D.; Zhang, M.; Qu, B.; Chen, L.; Wang, Y.; Zhang, E.;
Xu, Z.; Li, Q.; Wang, T. Nanoscale 2012, 4, 3422-3426.
30. Liang, Z.; Gao, R.; Lan, J. L.; Wiranwetchayan, O.; Zhang, Q.; Li, C.; Cao, G. Sol. Energy Mater. Sol. Cells 2013, 117, 34−40.
31. Varghese, B. et al. Chem. Mater. 2008, 20, 3360−3367.
32. Cao, F.; Pan, G. X.; Tang, P. S.; Chen, H. F. Mater. Res.
Bull. 2013, 48, 1178−1183.
33. Shin, H. S.; Kwon, S.-J.; Yoop, Hakhoechi 1993, 30, 499.
34. Ahmed, K. A. M.; Zeng, Q.; Wu, K.; Huang, K. J. Solid State Chem. 2010, 183, 744−751.
35. Matthews, R. W. Water Res. 1991, 25, 1169−1176.
36. Gogate, P. R.; Pandit, A. B. Adv. Environ.Res. 2004, 8, 501−551.
37. Manivannan, M.; Reetha, D.; Ganesh, P. J. Ecobiotechnol.
2011, 3, 29−32.