1. Introduction
The most troublesome feature in VIR remote sens- ing studies is the ubiquitous nature of cloud cover.
Cloud shadows further diminish the percentage of
interpretable data. Despite the proven utility of pas- sive multi-spectral instruments such as on board Landsat, SPOT (Satellite Probatoire pour l’Observa- tion de la Terra) there are many situations where the applicability of these sensors is very limited. A pro-
* Assistant Professor, Department of Geography, Kyungpook National University, Daegu, Korea, [email protected]
Evaluating Distribution Trends of Classification Accuracy by Triangular Training Operator in SAR/VIR FCC : A Case Study of
Songkhla Lake Basin in Thailand
Jung-Sup Um*
SAR/VIR FCC에서 삼각 트레이닝 도구에 의한 분류정확도 분포추세 평가:
태국의 송클라 호수 유역을 사례로
엄 정 섭*
Abstract : This study mainly focuses on evaluating how the triangular training operator could improve classification accuracy in SAR(Synthetic Aperture Radar) and VIR FCC(Visible Infra-red, False Colour Composite).
The techniques for the determination of the most informative SAR/VIR combinations in the triangular space diagram, as developed by the author of the paper, are given and the results obtained are presented. The SAR alone, VIR alone and SAR/VIR FCC classification showed trends for gradual improvement of accuracy. Accuracy distribution pattern for individual classes could be explained closely related to SAR/VIR signature components in the process of the triangular synergistic training. Due to contribution of SAR signature in training samples, it was possible to isolate major terrain features such as cloud cover area and roughness target with acceptable spatial precision. It is anticipated that this research output could be used as a valuable reference for distribution trends of classification accuracy obtained by triangular channel space based training in synergistic application.
Key Words : VIR, SAR, FCC, Triangular Training Operator
요약: SAR와 VIR 영상을 디지털 환경에서 통합하여 상승효과를 도출하려는 응용은 아직까지도 탐색적인 연구
수준에 머물러 있다. 본 연구는 SAR와 VIR을 통합한 영상에서 삼각 트레이닝 도구가 개별 클라스의 분류 정확 도의 분포추세에 미치는 영향을 평가하는 데 주안점을 두고 있다. SAR 데이터와 VIR 데이터가 단일 시너지 영 상을 제작하기 위해 통합되었다. 분류정확도의 향상과정이 SAR, VIR, SAR/VIR 통합영상에서 단계적으로 확실 하게 도출되었다. 아울러 개별 클라스의 분류정확도가 FCC에 의거한 트레이닝 샘플의 신호(signature)값과 밀접 한 상관성을 가지고 분포되는 것이 확인되었다. 한 예로 FCC에서 SAR 영상 신호(signature)의 기여 때문에 구름 으로 덮힌 지역과 굴곡을 지닌 지상물체가 (VIR에서는 사실상 분류가 불가능하였던) 상당한 공간 정확도를 가 지고 분류되었다. 본 연구가 SAR/VIR을 통합한 응용분야에서 분류정확도의 분포추세에 대한 정량화되고 객관적 인 근거가 부재하여 직면하였던 한계를 극복할 수 있는 계기가 되어 향후 SAR/VIR 원격탐사에서 개별 클라스 에 대해 확보할 수 있는 분류 정확도에 대한 중요한 참고자료가 될 수 있을 것으로 사료된다.
주요어 : VIR, SAR, FCC, 삼각 트레이닝 도구
ject based on natural resources assessment can often be delayed for years while awaiting the acquisition of cloud free new image. Then, when the images are delivered, they were frequently found to be even more deficient than the existing one (Ascbacher and Lichtenegger, 1990).
Various ground features with the same spectral response in VIR could be differently identified by SAR, which is sensitive to the water content and roughness of earth features. There are a number of heterogeneous ground features in terms of rough- ness even if they show homogeneity in visible reflec- tivities. Because of these reasons, serious information losses occur if they are used independently.
Information extraction from VIR and SAR by sep- arate interpretation can be slow and tiring. A sepa- rated use of SAR and VIR images inevitably leads to lack of classification accuracy. To utilize various advantages of the digital approach, such as statistical classification and spatial analysis, it is necessary to merge the SAR and VIR data as one FCC set. The FCC approach can deal with as many original bands as desired in accordance with user requirements.
Thus, the interpretation of the images should be more automatic than those carried out by a human interpreter analysing SAR and VIR data indepen- dently.
Theoretically, a number of researchers and experts expressed the idea of combining the VIR and SAR data sets. In addition, several studies have analysed the usefulness of SAR (Kierein-Young, 1997; Paradella, 1997; Deroin and Simonin, 1998;
Smara et al., 1998; Haack et al., 2000; Hegarat-Mascle et al., 2000; Kuplich et al., 2000; Ricchetti, 2001).
However, only a few attempts have been made to develop an appropriate methodology for synergistic use of SAR for VIR (Ascbacher and Lichtenegger, 1990).
One factor inhibiting the more wide use of SAR/VIR synergistic data is a relatively poor accu- racy of machine classified map. Synergistic data set possesses many different characteristics compared
to conventional remote sensing data. The training using FCC image has been the main tasks of many researchers dealing with a VIR data. The SAR/VIR synergistic data cannot be trained in the same fash- ion as VIR data. Thus the use of training techniques derived for application on conventional remotely sensed data will not exploit optimally the informa- tion content in the synergistic data.
However, it is very hard to find focused studies between training strategy and accuracy distribution pattern in the synergistic data sets in comparison with that of VIR data. The typical FCC based train- ing for the synergistic image is not up to standard until now.
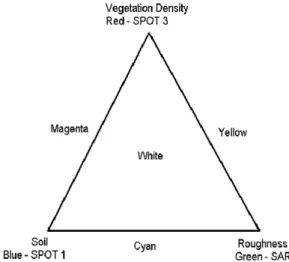
The varying reflectance properties in SAR/VIR FCC are predictably related to radiance recorded by multi-channel remote sensing devices. A triangular channel space diagram is proposed for a visual inter- pretation, training set selections and a post-assess- ment of the classification performance (Figure 1).
Reducing subjectivity in training site selection is achieved by the derivation of combined radiometric indicators from measurements of signature separa- bility for individual channels. Therefore, this paper is devoted to obtaining the training sample of syner- gistic radiance coefficients, based on the triangular
Figure 1. Triangular colour combination diagram for training based on FCC
channel space. An individual channel is assigned at the triangular channel space diagram that the radio- metric space is sampled equitably in the construc- tion of the training sets. Through this approach, the multi-channels in the training set can be maximized while keeping the number of patterns to a specified class.
In particular, careful in-depth investigations for the classification accuracy pattern of the synergistic data have not yet been reported. Once the distribu- tion pattern of classification accuracy by triangular channel space training operator has been carefully investigated, it could be a scientifically valid basis for achievable accuracy in a follow-on practical application. The quantitative evidence concerning the accuracy pattern for individual classes would be utilised as major tools to ensure the FCC based train- ing quality in SAR/VIR synergistic image that may
be frequently encountered in real applications.
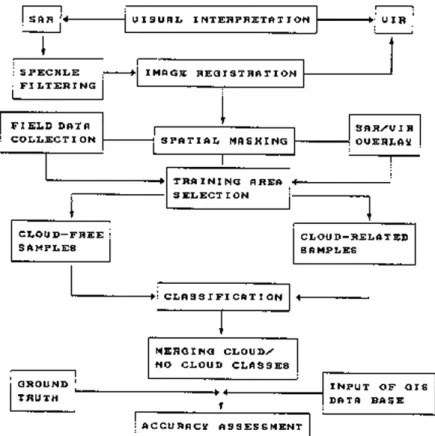
Ultimately, the aim of this paper was to evaluate dis- tribution trends of classification accuracy by a trian- gular training in SAR/VIR synergistic image. The research is based on the analysis of SPOT/SIR-A imagery and field measurements (Figure 2).
2. Data Availability and Study Site
A problem associated with using historical remotely sensed data for a synergistic study is that the data usually fall on non-anniversary dates, with variations in sun angle, atmospheric and ground moisture conditions. This study proved to be no exception, with all of the above problems being encountered since archived images were used for this synergism study. Details on the data are given
Figure 2. Flowchart of the data analysis procedure
below. The SPOT (System Pour l’Observation de la Terre) data include a cloud-covered area suitable to resolving the inherent limitation of VIR data by introducing SAR technology.
- SAR: 12-14 November 1981 (Rainy Season); L- band (1.28 GHz); 50-degree incidence angle; 40 m ground resolution.
- SPOT: 13 May 1986; 20 m ground resolution.
The study area belongs to the Songkhla Lake Basin (SLB) on the eastern side of the southern Thai peninsula (Figure 3). SLB is not an economic or administrative unit; it is a natural drainage unit. The drainage basin covers 8,020 square km, of which the Songkhla lakes cover 1,082 square km. This area is located between 7˚ 15’-7˚ 30’ north latitude and 100˚
15’ - 100˚ 30’ east longitude. The size of study area covers 529.5 square km, which is equivalent to 1183 rows and 1119 columns in the images, with a pixel size of 20 m. This size of the ground target is consid- ered appropriate and manageable for methodology development, since intensive investigation over small areas can provide a valid assessment for
SAR/VIR FCC in operational applications.
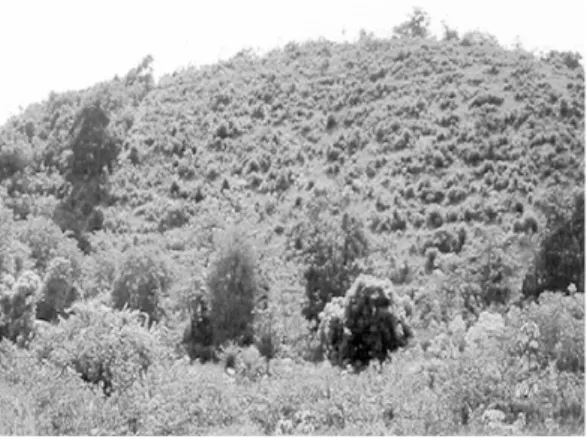
The main vegetation resources of the basin are the evergreen forest on the mountain ranges, the agri- cultural crops (mainly rubber, sugar palm, orchard and rice) and swamp vegetation (mainly Malaleuca freshwater swamp species but some areas of man- grove). Over the long term, considerable natural resource degradation due to changes in land use has occurred in the basin. The major losses of land use have been evergreen forests (Figure 4) and swamp vegetation, which have been progressively replaced for agricultural purposes. The evergreen forest areas form important habitats for a wide range of mam- mals and birds. As the upland sections of the basin watersheds, they are important for maintaining the hydrologic regime and reducing soil erosion and sedimentation.
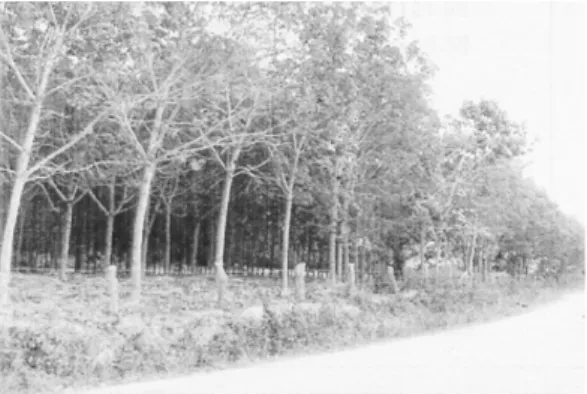
The rubber plantations form an important water- shed cover as well, which is almost as good as a nat- ural forest (Figure 5). However, ecological values of rubber plantations are considerably less than natural forests. Mangrove areas form an important zone for refuge of juvenile fish and protection of lakeshore against wave erosion. Mangrove and Malaleuca forests have also been progressively cleared over the past few decades to open up new land for rice fields, shrimp farms, fuel wood and construction material.
Sugar palms are an important complementary tree Figure 3. Location map of the study site. (Inset:
Overview for the surroundings of the study site; * represents the location of the study site)
Figure 4. Typical scene of an evergreen forest disturbed by local villagers' encroachment
crop in the coastal areas where they are grown on rice field bunds (Figure 6). Orchards are also grown beside rice fields and residential areas.
3. SAR/VIR Registration
The first step in generating multiple sensor data sets is geometric registration of the images to a com- mon map grid. The SAR/VIR composite assumes that the two images have been collected under simi- lar conditions (i.e. the sensor is pointing vertically downward and lens distortion has a minimal effect).
The effect of atmospheric turbulence or other distor- tions in the images should be negligible (Goshtasby, 1988; Duggin and Robinove, 1990). However, any
study dealing with several images should also con- sider the problems of image combination. Elements such as geometric position and atmospheric effects are very difficult to correlate across several images.
In the images used for this experiment, such con- straints could not be avoided.
Standard geometric correction was applied throughout the image registration procedure. This included Ground Control Point (GCP) selection by comparing images visually and then performing computer-aided image transformation. When merg- ing higher resolution data with lower resolution images, theoretically it is advisable for the high reso- lution image to be merged with pixel sizes of lower resolution data. However, it was decided to resam- ple both images to a common pixel size of 20 m × 20 m to minimize radiometric distortions of the SPOT. This was especially true for higher resolution data, since it was a better option than losing infor- mation by degrading the SPOT to the 40 m resolu- tion of the SAR.
The positions of a number of corresponding ground control points were determined in the images. Features that could be easily identified on both images and do not change with time were selected as GCPs. It was very difficult to exactly locate the corresponding ground control points in the SAR and SPOT images due to different image characteristics and severe geometric distortion inher- ent in SAR imagery. Care had to be taken with regard to the clarity of the feature and its width since this is sometimes affected by the reflectance of the surrounding area. Canal features such as land-water boundaries and small islands made very good con- trol points. However, care was taken to ensure they were not affected by the tides. A shoreline with steep sides was used since only small positional changes would occur as water levels varied.
For GCP selection in the SAR image, the raw unfiltered image was used because the filtered image had already lost some ground features and raw data could still contain actual ground features Figure 5. Typical scene of a rubber plantation at the
study site
Figure 6. Sugar palm grown as a complementary tree crop on a rice field
without any transformation of real ground features (Ascbacher and Lichtenegger, 1990). The GCPs were also selected outside the study area in the image. To complete the initial GCP location process, poorly located GCPs exceeding the limit of 3 pixels arbitrar- ily specified were rechecked by a repeat of the relo- cation process. Evaluation of the GCP selection accu- racy was made using root mean square error (RMSE) values of the GCPs. Standard deviations were 1.02 on × and 1.011 on y. Maximum devia- tions were 2.35 on × and 1.95 on y.
After geometric correction, rectangular coverage of the processed image was extracted for further intensive examination of registration accuracy. To check the registration accuracy of the images, the three rectified images were overlaid in different planes: SAR in green, SPOT band 3 in red and SPOT band 1 in blue. By introducing manual image enhancement, significant ground features for the registration accuracy evaluation were pronounced.
The islands were the best points for the registration evaluation. In case the images were properly regis- tered, they were overlaid exactly with colour created by a combination of the red, green and blue assigned to the respective registered images. The coastal boundary was also a good signature for the evalua- tions. The boundary between the water and land was a good point for evaluating quantitative regis- tration quality. Grey values were analysed on a pixel-by-pixel basis between the land and water boundary for the respective planes. Additionally, the respective images were checked to determine whether they generated reasonable brightness val- ues for land and water. To achieve accurate registra- tion without displaying undesired grey value, trial and error was used repeatedly. Notwithstanding the sound overall accuracy, the rectification produced local mis-registrations (1-1.5 pixels). It seems that this is due to the different characteristics of the images and some tidal variation in the coastal boundary caused by varying acquisition dates of the images.
4. Application of Triangular Training Operator
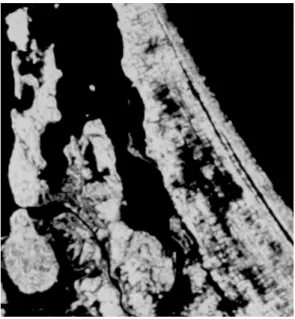
After geometric correction, it was possible to match the image quality of the SAR (Figure 7) to an extent comparable to human visual interpretation.
Red, green and blue were assigned to the SPOT 3, 2 and 1 bands, respectively, to develop standard VIR FCC (Figure 8). The SAR/VIR FCC was created dis- playing SPOT channels 3 and 1 in red and blue with the speckle-filtered SAR in green (Figure 9).
While there should be a considerable number and variety of factors associated with FCC creation (data reduction techniques such as NDVI, PCA and ratio etc), this paper focuses on combination of original channels that is believed to be quite useful in better ensuring the information content of the synergistic image at straightforward manner. This idea was for- mulated by incorporating the concept of traditional VIR FCC into synergistic image. In this regard, red was assigned to infrared channel of SPOT while green to SAR.
The selection of training areas was based on visu- al interpretation, field observation and on already existing information such as old land use maps and
Figure 7. SAR image
forest maps of the study area. In general, the number of training samples used for image classification depends on the total ground cover size of the class trained. The greater the area, the more training sam-
ples needed. A total of 133 training samples were selected for our classification, with 71 in the eastern flat area and 62 in the western hilly area.
FCC colour was used as the main determinant to train various natural resource features. The training strategy based on triangular space diagram (Figure 1) has been applied to separate whole area into three large categories of vegetation density, soil and roughness. It was to ensure maximum contribution by individual channels of VIR/SAR response in the process of whole scene classification. The triangular space diagram was used to interpret colour variation in the images. According to the diagram, natural resource categories were trained. Any colour may be obtained from a mixture of the three fundamental colours - red, green and blue - as shown in the dia- gram. Any ground feature with extensive roughness has a high gray value of green (colour assigned for SAR: green) while objects with high spectral response appear bright red (colour assigned for SPOT 3: red).
Objects with both characteristics of high rough- ness and vegetation density appear yellow, which is a combination of red and green. For example, because of the high backscattering of sugar palm trees in the microwave L-band (1.28 GHz), they appear much brighter than the almost flat paddy fields in SAR image. This results in a green colour for the sugar palms and in a brown to red tone for the paddy fields. Rubber trees have highly rough textures and vegetation density, which exhibit near- ly no reflectance from bare soil (SPOT 1). As such, this causes a high grey value of red and green but a low value of blue (SPOT 1), resulting in a yellow colour for the rubber. Beach sand is defined as a very smooth area and SAR backscattering is very low, while SPOT 1 and 3 band exhibit relatively high reflectance. Therefore, it appears magenta, which is a combination of red and blue. Flood paddies and swamps exhibit a brown colour, which is created by low values for all fundamental three colours, since they have very low spectral reflectances and SAR Figure 8. FCC of the SPOT Image [The original colour
image in this paper is presented here in black and white. However, the description for the images is based on the colour image since it is necessary to describe the information content of the original image.]
Figure 9. FCC of SAR/VIR composite
backscattering.
Because of the additional information in the microwave, clouds are dyed in two different colours:
white for rough objects and magenta for smooth object. This is true even though the surface is below a cloud-covered area. Under cloudy conditions, a high VIR response is received. The grey value of the clouds themselves mainly contributes to the result- ing colour. Thus, over the object in relief, it appears as white, which is a combination of red, blue and green with very bright intensity. Similarly, for smooth objects, SAR backscattering is very low.
Therefore, magenta is pronounced. In this regard, clouds located over areas with rubber and sugar palms appear white while they appear magenta over smooth objects such as paddy fields and swamps.
Concerning cloud shadows, since shadows have low bright values, they cause almost no VIR reflectance.
Thus, SAR signatures mainly contribute to the resulting colour. They appear light green for rough objects such as sugar palms and rubber but dark green for smooth objects such as paddies and swamps.
To make physical interpretation easier, special care was also taken with the meteorological condi- tions. The SAR imagery was recorded at the end of the rainy season in November 1981. The rainfall records show heavy rainfall during the week before the SIR-A over flight. The SPOT image was taken at the beginning of the rainy season, in May 1986. At
that time, the paddies were just starting to be plant- ed. Therefore, they appeared as bare soil. In the SAR/SPOT composite, this is indicated by the red tone representing the flooded paddy fields and swamps located near the coastal region. For each class, independent subclasses were formed by taking samples in cloud free areas (pure class), in cloud- covered areas and in cloud shadows. Colours for each training sample are illustrated in Table 1.
5. Classification of the SAR/VIR Synergistic Images
Remote sensing data acquired from the area with relief may include undesirable noise such as illumi- nation variation and geometric distortions. The undulating character of the study area requires the use of digital elevation data for the compensation of relief-induced distortions (Guneriussen et al., 1996;
Apisit and Rajendra, 2000). In particular, in SAR image, the use of a Digital Elevation Model (DEM) is essential to remove these distortions, known as fore- shortening and layover. Main contours at regular 20 m intervals were digitised from a 1:50,000 topo- graphic map and the point coordinates were input into an ArcView DEM generation module. The DEM were registered with original SPOT and SAR data using a neighbour fit and then added to the existing data such as SPOT and SAR as another channel in Table 1. Training sample colours and their ground features
White Cloud-covered dense sugar palm, Rubber, Orchard Magenta Cloud-covered water, Paddy, Swamp, Bare soil
Cloud-free bare soil, Beach sand
Yellow Cloud-free dense orchard, Rubber, Evergreen forest Dark Brown Cloud-free flood Paddy, Swamp
Bright Green Cloud-free and cloud shadow dense sugar palm, Rubber, Evergreen forest
Blue Cloud-free water
Dark Green Cloud shadow paddy, Swamp, Cloud-free paddy
False colours Ground features
the classification process.
If an area with a totally different set of natural resource features and topography is designed as a single classification unit, the classification may gen- erate bad results. Therefore, it is desirable to divide the image into homogenous zones before carrying out a classification for each territory. The study area has different topography and vegetation structures between the western hilly island area and the east- ern flat inland area. In the eastern inland area, sugar palms are dominated by large paddy fields. In addi- tion, tree crops and fruit orchards along the built-up area and beach are included in this portion.
Concerning the western hilly area, it was selected as different sub-study area because of its different type of vegetation and topography from the eastern flat area, such as the evergreen forests, rubber planta- tions and hilly areas. The rubber and evergreen forests are expected to be confused with the sugar palm and orchards in the eastern area. In particular, for the rubber plantations, they consist of old and new varieties, varying from old, mature plantations to very recently planted rubber. Masking the study area with the different ground conditions was per- formed by digitising the areas and cutting them out in an image processing environment. Separate classi- fications for the synergistic images were performed for the flat eastern area and hilly western area.
Essentially, the thematic ground classes identifi- able by visual interpretation could be used as indi- vidual classes in a computer-assisted classification.
However, to minimise misclassification, training samples were redefined in consideration of inherent limitations caused by machine-based analysis.
Different subsets of training samples such as young and old rubber were selected and merged after com- putation. Two categories of sugar palm and swamp vegetation (Malaleuca and mangrove) were suggest- ed according to density and site characteristics. The following definition for sugar palm classes is offered: dense sugar palm is on area in which 40 to 100 percent of the surface is covered by sugar palm
crowns (foliage and branches) while sparse sugar palm is on area in which 10 to 39 percent of the sur- face is covered by sugar palm crowns. After compu- tation, subclasses such as
cloud-free, cloud-covered and cloud shadow were merged into 11 main classes as indicated below: (1) Swamp, (2) Malaleuca, (3) Mangrove, (4) Water, (5) Rubber, (6) Paddy, (7) Evergreen forest, (8) Sparse sugar palm, (9) Dense sugar palm, (10) Orchard and (11) Beach sand.
Training samples were used in a maximum likeli- hood classification and classification maps were gen- erated in Erdas Imagine. Whenever digital classifica- tion results are produced, they are compared to visual interpretations. If there are incompatible fea- tures with the visual interpretation, the reclassifica- tion process is repeated several times. Visual identi- fication confirmed that SAR data classified the cloud-covered areas reliably. Visual inspection of the classification by combined data sets showed that SAR helped to distinguish rough features such as sugar palms from paddies that were impossible with visible data alone. VIR data clearly differentiated ground features with different spectral intensities such as orchards and paddies. Results indicate that SAR/VIR FCC improved discrimination accuracy compared to visible and infrared data only. The SPOT data separated classes according to vegetation type, density and moisture content; however, SAR data separated classes primarily as a function of relief in the surface geometry.
6. Estimation of Classification Accuracy
There is no standardized, generally accepted methodology for classification accuracy assessment (Lo and Watson, 1998; Muller, 1998). To evaluate classification accuracy for synergistic images, error matrix and classification accuracy tables for each separated classifications were created in an ERDAS
Imagine. This function makes it possible to compare corresponding pixels in classified image from refer- ence pixels input by the user. Commission and omis- sion errors were calculated to compare the classifica- tion results obtained by digital classification for the whole study area. Accuracy of the classification results was determined by samples selected ran- domly in Erdas Imagine, checking their classes against the existing thematic maps as presented below.
- 1:25,000 Topographic map (1991, Thailand Army Survey Department)
- 1:50,000 Forest Cover Map (1982, Thailand Forest Department)
- 1:50,000 Land Use Map (1981, Thailand Land Development Department)
- 1:100,000 Surface Humidity Levels Map (1987, Thailand Prince of Songkhla University) - 1:100,000 Agro-ecological Landscape Map (1987,
Thailand Prince of Songkhla University) To confirm the hypothesis that SAR/VIR FCC will reveal more accurate information than the two images used separately, each image was separately classified using the same training samples. As expected, visual inspection of the results of this clas- sification showed an improved classification process over (1) SAR data alone, (2) SPOT alone, and (3) SAR + SPOT. The estimations indicate there are serious differences in the resource assessment quality for the various respective classification results (Figure 10).
Accuracy estimations are affected by many differ- ent variables such as sampling procedures and time- liness of the data. It was kept in mind that various errors could be introduced in the statistical biases of the sampling procedures. In this regard, samples for each class were selected evenly from the entire study area. The total number of ground checks depends in part on the number of classes, but ideally, to achieve a quantitative status; there should be a minimum of twenty per class (Fitzpatric-Lins, 1980). The number of selected samples for accuracy assessment was
determined by an estimation of the final classifica- tion results. The larger the area, the more samples selected. Based on previous studies (Congalton, 1991), the total number of samples decided on to evaluate classification accuracy was 96. Each sample contains about 15 × 15 pixels, which covers a 300 m
× 300 m ground area. This sample size is consid- ered appropriate to avoid pixels containing contri- butions from surrounding or adjacent classes and to truly represent ground features.
Water bodies cover 33.69% of the study area.
However, 12 water samples were selected since water is not too significant ground feature for a syn- ergism study even if it covers a large area. For the evaluation of classification accuracy for SPOT alone, cloud-covered areas were excluded in the computa- tion of accuracy. Additionally, final accuracy of SPOT data was determined solely by cloud-free area, although there were 17 samples classified as cloud and cloud shadow.
7. Evaluating Distribution Pattern of Classification Accuracy
Overall classification accuracy for SAR and SPOT synergistic images (86.45%) was significantly better than for SPOT alone (65.82 %), as shown in Figure 10. SAR backscattering was greatly superior to visi- Figure 10. Overall classification improvement process (16.78% of entire image in VIR data is cloud covered area)
90 80 70 60 50 40 30 20 10 0
41.6
65.82
86.45
SAR VIR SAR+VIR
Percentage
ble/infrared bands for differentiating roughness in objects. However, classification accuracy of SAR alone (41.6%) was relatively low compared to the SPOT alone (65.82%) because there were similarities and overlap of the backscattering range, as well as limited separability for the spectral response. The classification of SAR alone overestimated the extent of roughness. Use of visible/infrared bands with SAR eliminated most of this confusion.
For the individual ground classes, as expected, there was some confusion between the rubber and evergreen forests. In its mature stage, rubber exhibit-
ed the same backscattering as the evergreen forests.
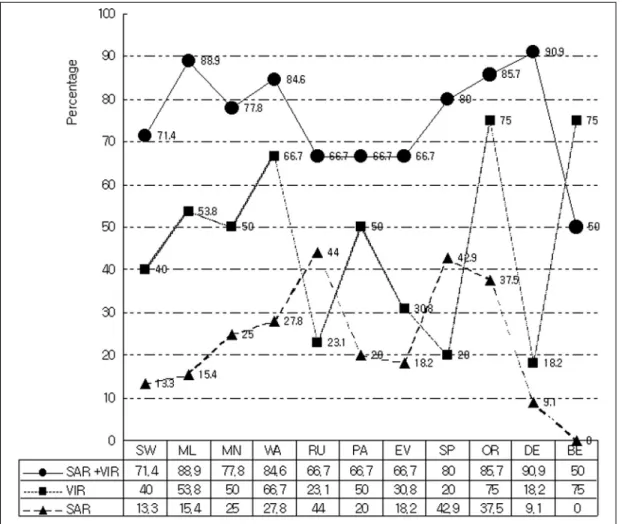
The evergreen forests were not easily distinguished from the rubbers since they belong to the same ever- green species (overall accuracy for the evergreen for- est and rubber: 66.7%, Figure 11). Swamp vegetation was found in a number of locations scattered throughout the study area. In SAR imagery, they were well separated even in flooding conditions because of their stronger SAR backscattering for the surrounding area. VIR imagery also showed strong spectral separability between paddies and swamp vegetation such as mangroves and Malaleuca. It was
SW: Swamp ML: Malaleuca MN: Mangrove WA: Water RU: Rubber PA: Paddy EV: Evergreen Forest SP: Sparse Sugar Palm OR: Orchards DE: Dense Sugar Palm BE: Beach
Figure 11. Distribution pattern of individual class accuracy
discovered that both sets of data contributed to sepa- rating the two swamp species, mangrove and Malaleuca, simultaneously. The assessment for swamp vegetation communities is clearly achieved by the SAR backscattering and visible reflectivities (overall accuracy Malaleuca: 88.9% mangrove:
77.8%).
Sugar palms were scattered throughout the paddy fields in the study area. Due to limitations in the spectral sensitivity of VIR imagery, they could not be individually classified on SPOT. Furthermore, separated ground classes of sparse sugar palms and dense sugar palms established from the SAR signa- ture were not extended to an independent class in the SPOT. They were distinguished according to SAR backscattering characteristics. There was almost no confusion between the sparse and dense sugar palms, even if only one band of SAR was used in the classification (accuracy of sparse sugar palm: 80%, dense sugar palm: 90.9%).
Orchards were concentrated in the eastern part of the study area. The surface roughness is very high since it is mainly fruit trees. The orchards could be identified with no trouble at all on SPOT imagery because of their high spectral reflectance. However, an examination of SAR alone revealed a very low degree of separation (i.e. accuracy of SAR alone data for dense sugar palm: 9.1%; orchard: 37.5%). There was considerable confusion between the dense sugar palms and orchards if SAR was used alone.
Paddy fields are distributed throughout the study area. The rice had already been harvested and plant- ing had just started at the time when the SPOT imagery was acquired. Thus, the fields were easily distinguished from other vegetation types by visible response and the SAR backscattering characteristics of bare fields. However, the smooth texture of paddy fields also caused confusion with other low land features such as swamps, water and beach sand. This confusion is also observed with the SPOT data since paddies and beach sand exhibit similar spectral responses. It is believed that inclusion of
ancillary data such as coastal boundary could solve this confusion. Accuracy is improved from 50% for VIR alone to 66.7 for SAR and VIR.
8. Conclusions
Although SAR/VIR synergistic images have been used routinely in digital environment by many researchers, much of the scientific research has often been carried out without proper consideration for the practical implications of FCC based training. The evaluation for accuracy distribution pattern pro- vides a good basis for general understanding con- cerning the potential of triangular radiometric train- ing (i.e. pre-processing requirements, the appropri- ate interpretation techniques and likely levels of accuracy for an entire image as well as individual classes). The limiting factors and benefits of the tri- angular channel space training could be well investi- gated based on the closed investigation of the classi- fication accuracy distribution. More closed investiga- tion for the individual classes made it possible to identify overall patterns for class-wide accuracy dis- tribution subject to many different influences (e.g.
the effects from specific channel signatures of train- ing samples). The result of study will play a key role as the scientific and objective evidence for the accu- racy standard to be achieved by triangular radiomet- ric training in SAR/VIR synergistic application.
It is desirable to use data taken at the same time to achieve the optimal complementary application of VIR and SAR remote sensing. In the current study, SAR data from 1981 and VIR data (SPOT) from 1986 were obtained. The data are old with different acqui- sition dates. Field verification was somewhat diffi- cult due to ground feature changes.
References
Apisit, E., and Rajendra, P. S., 2000, Application of
DEM data to Landsat image classification:
evaluation in a tropical wet-dry landscape of Thailand, Photogrammetric Engineering and Remote Sensing, 66(3), 297-304.
Ascbacher, J., and Lichtenegger, J., 1990, Complementary nature of SAR and optical data: a case study in the tropics, Earth Observation Quarterly, ESA Publication Division, The Netherlands.
Chuvieco, E., and Vega, J. M., 1990, Visual versus digital analysis for vegetation mapping:
some examples in central Spain, Geocarto International, 5(3), 21-30.
Congalton, R. G., 1991, A review of assessing the accuracy of classifications of remotely sensed Data, Remote Sensing of Environment, 37(1), 35-46.
Deroin, J.P.E., and Simonin, M. A., 1998, A compari- son of the potential for using optical and SAR data for geological mapping in an arid region: the Atar site, Western Sahara, Mauritania, International Journal of Remote Sensing, 19(6), 1115-1132.
Duggin, M. J., and Robinove, C. J., 1990, Assumptions implicit in remote sensing data acquisition and analysis, International Journal of Remote Sensing, 11(10), 1669-1694.
Fitzpatric-Lins, K. 1980, The accuracy of selected land use and land cover maps at scales of 1:250,000 and 1:100,000, In The Landsat Tutorial Workbook, U.S. Geolological Survey, 829, 255-259.
Goshtasby, A., 1988, Registration of images with geometric distortions, IEEE Transactions on Geocience and Remote Sensing, 26(1), 60-64.
Guneriussen, T., Johnsen, H., and Sand, K., 1996, DEM corrected ERS-1 SAR data for snow monitoring, International Journal of Remote Sensing, 17(1), 181-196.
Haack, B. N., Herold, N. D., and Bechdol, M. A., 2000, Radar and optical data integration for land - use/land-cover mapping, Photogrammetric
Engineering and Remote Sensing, 66(6), 709- 716.
Hegarat-Mascle, S. L., Quesney, A., Vidal-Madjar, D., Taconet, O., Normand, M. and Loumagne, C., 2000, Land cover discrimina- tion from multi-temporal ERS images and multi-spectral Landsat images: a study case in an agricultural area in France, International Journal of Remote Sensing, 21(3), 435-456.
Kierein-Young, K. S., 1997, The integration of optical and radar data to characterize mineralogy and morphology of surfaces in Death Valley, California, U.S.A., International Journal of Remote Sensing, 18(7), 1517-1541.
Kuplich, T. M., Freitas, C. C., and Soares, J. V., 2000, The study of ERS-1 SAR and Landsat TM synergism for land use classification, International Journal of Remote Sensing, 21(10), 2101 - 2111.
Lewis, H. G. and Brown, M. 2001, A generalized confusion matrix for assessing area estimates from remotely sensed data, International Journal of Remote Sensing, 22(16), 3223-3235.
Lo, C.P., and Watson, L. J., 1998, The influence of geographic sampling methods on vegetation map accuracy evaluation in a swampy envi- ronment, Photogrammetric Engineering and Remote Sensing, 64(12), 1189-1200.
Muller, S.V., Walker, D.A., Nelson, F.E., Auerback, N.A., Bockheim, J.G., Guyer, S., and Sherba, D., 1998, Accuracy assessment of a land- cover map of the Kuparuk river basin, Alaska: considerations for remote regions, Photogrammetric Engineering and Remote Sensing, 64(6), 619-628.
Paradella, W. R., Bignelli, P. A., Veneziani, P., Pietsch, R. W. and Tountin, T., 1997, Airborne and spaceborne synthetic aperture radar (SAR) integration with Landsat TM and gamma ray spectrometry for geological mapping in a tropical rainforest environ- ment, the Carajas Mineral Province, Brazil.,
International Journal of Remote Sensing, 18(7), 1483-1501.
Richetti, E., 2000, Multispectral satellite image and ancillary data integration for geological clas- sification, Photogrammetric Engineering and Remote Sensing, 66(4), 429-436.
Richetti, E., 2001, Visible-infrared and radar imagery fusion for geological application: a new approach using DEM and sun-illumination model, International Journal of Remote Sensing, 22(11), 2219-2230.
Smara, Y. A., Belhadj-Aissa, B., Sansal, J., and Lichtenegger, A. B., 1998, Multisource ERS-1
and optical data for vegetal cover assessment and monitoring in a semi-arid region of Algeria, International Journal of Remote Sensing, 19(18), 3551-3568.
Vintta, P., 1987, Investigation for setting a conceptual organization framework of the geo-informa- tion system for Songkhla basin development management, International Institute for Aerospace Survey and Earth Science, The Netherlands.
Received January 10, 2003 Accepted June 12, 2003