Co-corresponding authors:
Tae Sung Park, M.D., Ph.D. https://orcid.org/0000-0003-4571-2346 Department of Laboratory Medicine, School of Medicine, Kyung Hee University, 23 Kyungheedae-ro, Dongdaemun-gu, Seoul 02447, Korea Tel: +82-2-958-8674, Fax: +82-2-958-8609, E-mail: [email protected] Jongha Yoo, M.D., Ph.D. https://orcid.org/0000-0002-8294-0543 Department of Laboratory Medicine, National Health Insurance Service Ilsan Hospital, 100 Ilsan-ro, Ilsandong-gu, Goyang 10444, Korea
Tel: +82-31-900-0909, Fax: +82-31-900-0925, E-mail: [email protected]
*These authors equally contributed to this work.
†Tae Sung Park and Jongha Yoo are co-correspondents for this work.
Received: September 16, 2019 Revision received: September 24, 2019 Accepted: September 30, 2019
This article is available from https://www.labmedonline.org 2020, Laboratory Medicine Online
This is an Open Access article distributed under the terms of the Creative Commons Attribution Non-Commercial License (https://creativecommons.org/licenses/by-nc/4.0/) which permits unrestricted non-commercial use, distribution, and reproduction in any medium, provided the original work is properly cited.
INTRODUCTION
Recently, the incidence of some hematologic malignancies such as lymphoma and multiple myeloma (MM) has been gradually in- creasing, but hematologic malignancies still comprise a relatively lower proportion of the whole cancer incidence compared to other major solid cancers [1]. However, insufficient basic data exist on hematologic malignancies in Korea.
Several large-scale studies on hematologic malignancies were widely conducted in Korea [2-4]. The first nationwide study was conducted from 1999 to 2008 to analyze the statistics of hemato- logic malignancy in Korea, provided that significant research data about the overall status of hematologic malignancies were avail- able at that time; however, the study used data from the last 10 to
국내 혈액암 질환의 증가 양상: 2005년부터 2015년까지 국민건강보험 빅데이터에 근거하여
Gradual Increase in Hematologic Malignancy in Korea from 2005 to 2015 Based on the National Health Insurance Service Data
한유진1*·김영진1*·김민진2·변자민3·육태미4·윤회수5·이재희6·이우인7·박태성1†·유종하8†
Yujin Han, M.D.1*, Young Jin Kim, M.D.1*, Min Jin Kim, M.D.2, Ja Min Byun, M.D.3, Taemi Youk4, Hoi Soo Yoon, M.D.5, Jae Hee Lee, M.D.6, Woo-In Lee, M.D.7, Tae Sung Park, M.D.1†, Jongha Yoo, M.D.8†
경희대학교 의과대학 진단검사의학과1, 씨젠의료재단2, 서울대학교 의과대학 서울대학교병원 내과3, 국민건강보험 일산병원 연구분석팀4,
경희대학교 의과대학 소아청소년과5, 조선대학교병원 소아청소년과6, 경희대학교 의과대학 강동경희대학교병원 진단검사의학과7, 국민건강보험
일산병원 진단검사의학과8
Department of Laboratory Medicine1, Kyung Hee University School of Medicine, Seoul; Seegene Medical Foundation2, Seoul; Department of Internal Medicine3, Seoul National University College of Medicine, Seoul National University Hospital, Seoul; Research Institute4, National Health Insurance Service Ilsan Hospital, Seoul; Department of Pediatrics5, Kyung Hee University School of Medicine, Seoul; Department of Pediatrics6, Chosun University Hospital, Gwangju; Department of Laboratory Medicine7, Kyung Hee University Hospital at Gangdong, Seoul; Department of Laboratory Medicine8, National Health Insurance Service Ilsan Hospital, Goyang, Korea
Vol. 10, No. 2: 144-151, April 2020
https://doi.org/10.3343/lmo.2020.10.2.144 진단혈액학
Background: Hematologic malignancies have a relatively lower prevalence than major solid cancers, although the incidence of hematologic ma- lignancies has significantly increased in recent years. However, understanding the current status of hematologic malignancy is significantly chal- lenging because basic data regarding this malignancy are insufficient in the Korean population.
Methods: From 2005 to 2015, the status of seven codes of hematologic malignancy, containing 24 subcodes defined using a classification de- fined by the Korean Classification of Disease-6, was analyzed. The number of new patients, crude incidence rate, prevalence rate, and age-stan- dardized incidence rate were also investigated. Results were analyzed based on National Health Insurance Service (NHIS) data.
Results: The number of new patients showed an overall increase over time and a rate of increase up to 56.7% for 10 years. The number of male patients was higher than that of female patients, with the majority of patients aged greater than 60 years. The incidence and prevalence rates have increased steadily.
Conclusions: Consistent with the previous studies, this study might be useful to understand the current status of hematologic malignancy and might contribute to the improvement of national public healthcare.
Key Words: Hematologic malignancy, South Korea, Crude incidence rate, Prevalence rate
2017-03-16 https://crossmark-cdn.crossref.org/widget/v2.0/logos/CROSSMARK_Color_square.svg
20 years [2]. Moreover, the studies on myeloid malignancy and lymphoid malignancy, from 1999 to 2012, offered more detailed analysis data compared to the previous study [3, 4].
An Annual Report of Cancer Statistics for 2015 was the latest re- search data on the incidence of hematologic malignancies in Ko- rea [5]. According to the report, the number of people who have been diagnosed with hematologic malignancies has gradually in- creased despite the lower incidence proportion of hematologic malignancies in overall cancer [5].
This study aimed to present a diverse range of background information on hematologic malignancy by analyzing longitu- dinal big data from the National Health Insurance Service (NHIS) from 2005 to 2015 for an improvement in national public health- care.
MATERIALS AND METHODS
1. Data source and research subjective disease codes This study presented the claims from the NHIS in Korea from 2003 to 2015. To minimize diagnostic errors, data from 2003 and 2004 were not considered. The main objects were seven codes of hematologic malignancy defined by the Korean Classification of Disease-6 (KCD-6) [6]. During the study, hospitalized individu- als designated with the seven codes of hematologic malignancy and one code of other diseases related to hematologic malignancy were included (Table 1). The claims were sorted in chronological order, and the first day of the claim was defined as the first day of diagnosis. Information about sex and age of the patients was ob- tained. Patients’ ages were analyzed in units of 10 years. This study
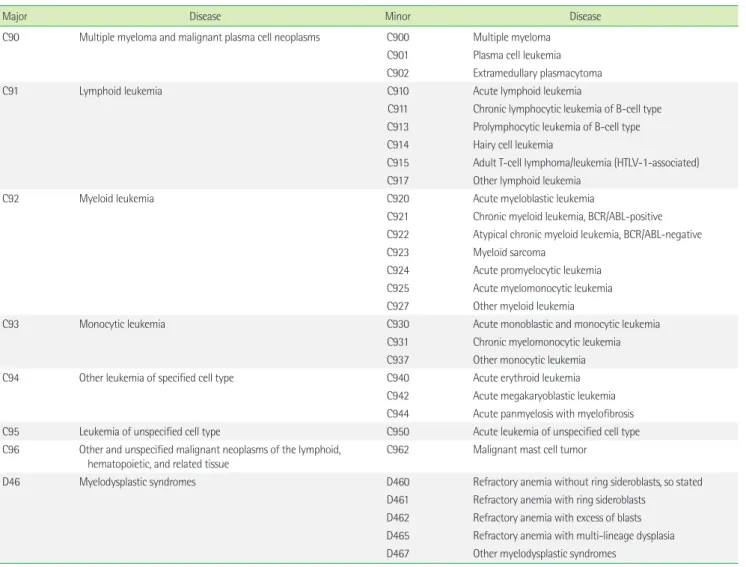
Table 1. Research subjective disease codes defined by the Korean Classification of Disease-6: hematologic malignancies and diseases related to he- matologic malignancies
Major Disease Minor Disease
C90 Multiple myeloma and malignant plasma cell neoplasms C900 Multiple myeloma C901 Plasma cell leukemia C902 Extramedullary plasmacytoma
C91 Lymphoid leukemia C910 Acute lymphoid leukemia
C911 Chronic lymphocytic leukemia of B-cell type C913 Prolymphocytic leukemia of B-cell type C914 Hairy cell leukemia
C915 Adult T-cell lymphoma/leukemia (HTLV-1-associated) C917 Other lymphoid leukemia
C92 Myeloid leukemia C920 Acute myeloblastic leukemia
C921 Chronic myeloid leukemia, BCR/ABL-positive C922 Atypical chronic myeloid leukemia, BCR/ABL-negative
C923 Myeloid sarcoma
C924 Acute promyelocytic leukemia C925 Acute myelomonocytic leukemia C927 Other myeloid leukemia
C93 Monocytic leukemia C930 Acute monoblastic and monocytic leukemia
C931 Chronic myelomonocytic leukemia C937 Other monocytic leukemia
C94 Other leukemia of specified cell type C940 Acute erythroid leukemia
C942 Acute megakaryoblastic leukemia C944 Acute panmyelosis with myelofibrosis
C95 Leukemia of unspecified cell type C950 Acute leukemia of unspecified cell type
C96 Other and unspecified malignant neoplasms of the lymphoid,
hematopoietic, and related tissue C962 Malignant mast cell tumor
D46 Myelodysplastic syndromes D460 Refractory anemia without ring sideroblasts, so stated
D461 Refractory anemia with ring sideroblasts D462 Refractory anemia with excess of blasts D465 Refractory anemia with multi-lineage dysplasia D467 Other myelodysplastic syndromes
was approved by the Institutional Review Board of the NHIS Ilsan Hospital (2017-01-001) and Kyung Hee University Hospital (2018- 08-027) .
2. Incidence and prevalence analysis
A crude incidence rate (CIR) is defined as the number of new patients in a specified population during a year per 100,000 peo- ple. It was calculated using the following formula:
The age-standardized incidence rate (ASR) is defined as the weighted average incidence rate of the age-specific rate. The stan- dard population for the ASR in our study was obtained from the midyear population of Korea in 2000. The annual percentage change (APC) is an indication of the changes in the annual ASRs, indicat- ing the annual increase or decrease rate of cancer incidence rate.
The prevalence rate (PR) is defined as the number of patients who have the disease in a specified population during a year per 100,000 people. It was calculated using the following formula:
3. Other diseases related to hematologic malignancy The status of new patients diagnosed with myelodysplastic syn- drome (MDS) (D46) among the disease codes related to hemato- logic malignancy in the KCD-6 (Table 1) was investigated.
4. Statistical analysis
Statistical analysis of big data from the NHIS was performed us- ing the Statistical Analysis System (SAS) version 9.4 (SAS Institute Ind., Cary, NC, USA).
RESULTS
1. Annual new patients’ status of hematologic malignancy:
C90 to C96
The number of new patients in the study was 52,757, and this
×100,000 Midyear population
The number of new patients
×100,000 Midyear population
The number of new and preexisting patients
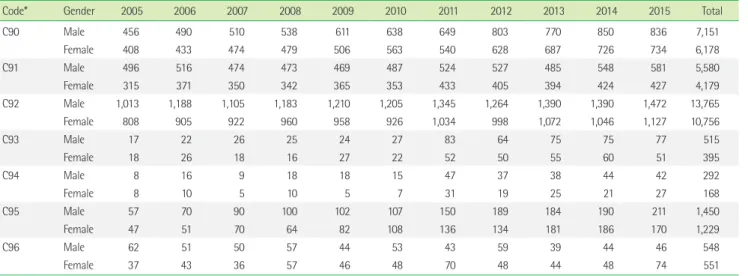
Table 2. Number of new patients diagnosed with hematologic malignancies from 2005 to 2015 by the National Health Insurance Service of Korea according to sex
Code* Gender 2005 2006 2007 2008 2009 2010 2011 2012 2013 2014 2015 Total
C90 Male 456 490 510 538 611 638 649 803 770 850 836 7,151
Female 408 433 474 479 506 563 540 628 687 726 734 6,178
C91 Male 496 516 474 473 469 487 524 527 485 548 581 5,580
Female 315 371 350 342 365 353 433 405 394 424 427 4,179
C92 Male 1,013 1,188 1,105 1,183 1,210 1,205 1,345 1,264 1,390 1,390 1,472 13,765
Female 808 905 922 960 958 926 1,034 998 1,072 1,046 1,127 10,756
C93 Male 17 22 26 25 24 27 83 64 75 75 77 515
Female 18 26 18 16 27 22 52 50 55 60 51 395
C94 Male 8 16 9 18 18 15 47 37 38 44 42 292
Female 8 10 5 10 5 7 31 19 25 21 27 168
C95 Male 57 70 90 100 102 107 150 189 184 190 211 1,450
Female 47 51 70 64 82 108 136 134 181 186 170 1,229
C96 Male 62 51 50 57 44 53 43 59 39 44 46 548
Female 37 43 36 57 46 48 70 48 44 48 74 551
*See Table 1.
Fig. 1. Number of new patients diagnosed with hematologic malig- nancies from 2005 to 2015 by the National Health Insurance Service of Korea.
3,000 2,500 2,000 1,500 1,000 500
0 2005 2006 2007 2008 2009 2010 2011 2012 2013 2014 2015
Multiple myeloma and malignant plasma cell neoplasm (C90) Lymphoid leukemia (C91)
Myeloid leukemia (C92) Monocytic leukemia (C93)
Other leukemias of specified cell type (C94) Leukemia of unspecified cell type (C95)
Other and unspecified malignant neoplasms of the lymphoid, haematopoietic, and related tissue (C96)
number gradually increased from 2005 to 2015 (total increase rate, 56.7%; 5,875/3,749) (Fig. 1). In this study, the number of cases of myeloid leukemia (C92) was the highest (46.5%) followed by those of MM and malignant plasma cell neoplasm (C90) (25.3%) and lymphoid leukemia (C91) (18.5%). Regarding sex, the number of males newly diagnosed with hematologic malignancy was higher than that of females in all hematologic malignancy codes except other and unspecified malignant neoplasms of the lymphoid, he- matopoietic, and related tissue (C96). Moreover, the highest differ- ence in number was observed in myeloid leukemia (C92) (Table 2).
Regarding age distributions, the age group with the largest number of new patients was patients in their 60s (20.0%, 10,542/52,757), followed by patients in their 70s (19.1%, 10,066/52,757). The age group under 9 years constituted the largest proportion in lymphoid leukemia (C91) during the study (22.3%, 2,177/9,759).
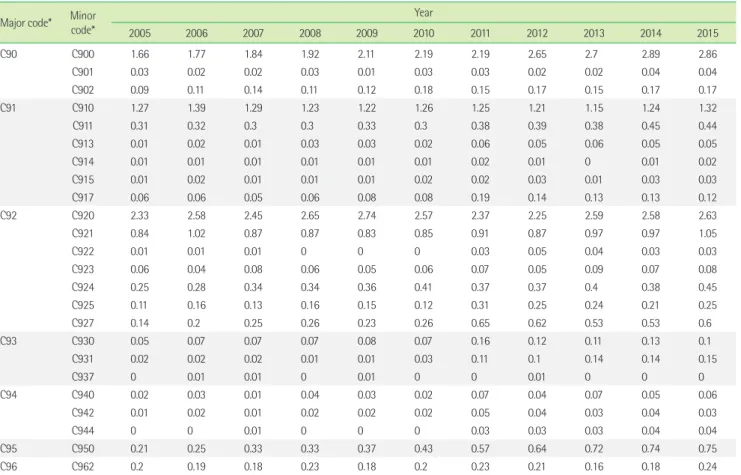
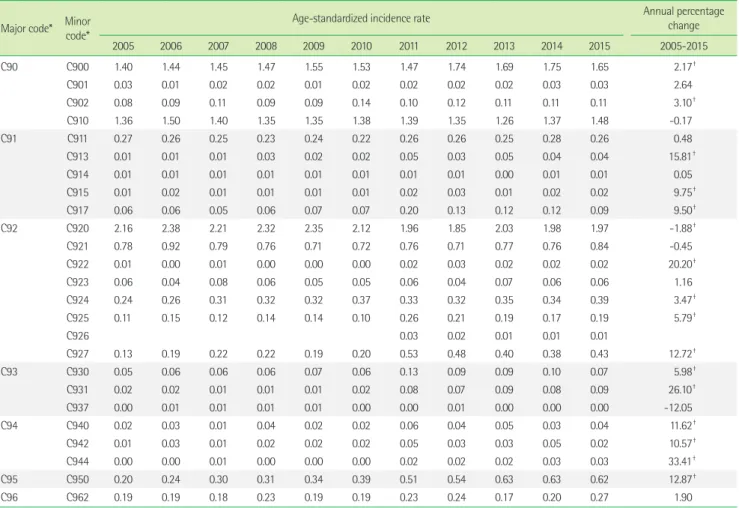
2. Crude incidence rate and age-standardized incidence rate From 2005 to 2011, acute myeloblastic leukemia (C920) showed
the highest CIR (up to 2.65), and after 2012, MM (C900) showed the highest CIR (up to 2.89). The CIR of chronic myeloid leuke- mia, BCR/ABL-positive (C921), ranged from 0.83 (in 2009) to 1.05 (in 2015). Acute lymphoid leukemia (C910) was the code with a CIR of greater than 1 during the study (Table 3). During the study, there were three codes with ASR>1. Among them, the ASR of acute myeloblastic leukemia (C920) decreased from 2.16 in 2005 to 1.97 in 2015, and the APC was -1.88 (P<0.05). In chronic my- eloid leukemia, BCR/ABL-positive (C921), the ASR remained around 0.7. The ASR of MM (C900) increased from 1.40 in 2005 to 1.65 in 2015, and the APC was 2.17 (P<0.05). The ASR of acute lymphoid leukemia (C910) was not statistically significant during the study (Table 4).
3. Prevalence rate
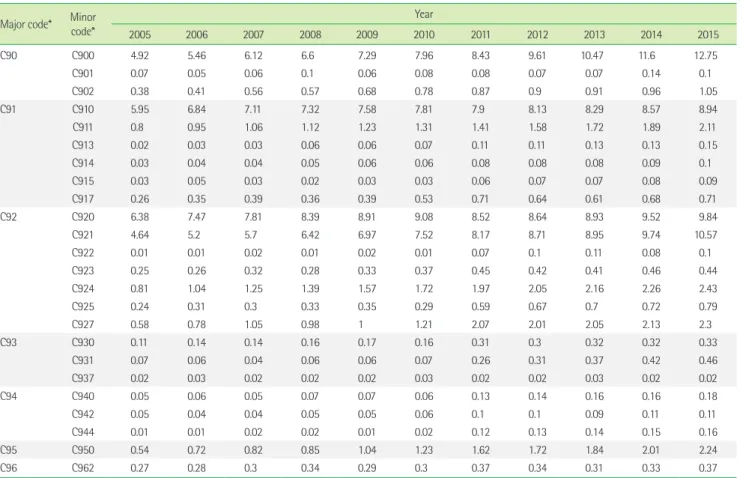
During the study, the PR of all hematologic malignancy codes (C90 to C96) was maintained or increased (Table 5), and the code with the largest PR difference was C900 of MM, which showed an
Table 3. Crude incidence rate in hematologic malignancies by year Major code* Minor
code*
Year
2005 2006 2007 2008 2009 2010 2011 2012 2013 2014 2015
C90 C900 1.66 1.77 1.84 1.92 2.11 2.19 2.19 2.65 2.7 2.89 2.86
C901 0.03 0.02 0.02 0.03 0.01 0.03 0.03 0.02 0.02 0.04 0.04
C902 0.09 0.11 0.14 0.11 0.12 0.18 0.15 0.17 0.15 0.17 0.17
C91 C910 1.27 1.39 1.29 1.23 1.22 1.26 1.25 1.21 1.15 1.24 1.32
C911 0.31 0.32 0.3 0.3 0.33 0.3 0.38 0.39 0.38 0.45 0.44
C913 0.01 0.02 0.01 0.03 0.03 0.02 0.06 0.05 0.06 0.05 0.05
C914 0.01 0.01 0.01 0.01 0.01 0.01 0.02 0.01 0 0.01 0.02
C915 0.01 0.02 0.01 0.01 0.01 0.02 0.02 0.03 0.01 0.03 0.03
C917 0.06 0.06 0.05 0.06 0.08 0.08 0.19 0.14 0.13 0.13 0.12
C92 C920 2.33 2.58 2.45 2.65 2.74 2.57 2.37 2.25 2.59 2.58 2.63
C921 0.84 1.02 0.87 0.87 0.83 0.85 0.91 0.87 0.97 0.97 1.05
C922 0.01 0.01 0.01 0 0 0 0.03 0.05 0.04 0.03 0.03
C923 0.06 0.04 0.08 0.06 0.05 0.06 0.07 0.05 0.09 0.07 0.08
C924 0.25 0.28 0.34 0.34 0.36 0.41 0.37 0.37 0.4 0.38 0.45
C925 0.11 0.16 0.13 0.16 0.15 0.12 0.31 0.25 0.24 0.21 0.25
C927 0.14 0.2 0.25 0.26 0.23 0.26 0.65 0.62 0.53 0.53 0.6
C93 C930 0.05 0.07 0.07 0.07 0.08 0.07 0.16 0.12 0.11 0.13 0.1
C931 0.02 0.02 0.02 0.01 0.01 0.03 0.11 0.1 0.14 0.14 0.15
C937 0 0.01 0.01 0 0.01 0 0 0.01 0 0 0
C94 C940 0.02 0.03 0.01 0.04 0.03 0.02 0.07 0.04 0.07 0.05 0.06
C942 0.01 0.02 0.01 0.02 0.02 0.02 0.05 0.04 0.03 0.04 0.03
C944 0 0 0.01 0 0 0 0.03 0.03 0.03 0.04 0.04
C95 C950 0.21 0.25 0.33 0.33 0.37 0.43 0.57 0.64 0.72 0.74 0.75
C96 C962 0.2 0.19 0.18 0.23 0.18 0.2 0.23 0.21 0.16 0.18 0.24
*See Table 1.
Table 4. Age-standardized incidence rate and annual percentage change in hematologic malignancies by year Major code* Minor
code*
Age-standardized incidence rate Annual percentage
change
2005 2006 2007 2008 2009 2010 2011 2012 2013 2014 2015 2005-2015
C90 C900 1.40 1.44 1.45 1.47 1.55 1.53 1.47 1.74 1.69 1.75 1.65 2.17†
C901 0.03 0.01 0.02 0.02 0.01 0.02 0.02 0.02 0.02 0.03 0.03 2.64
C902 0.08 0.09 0.11 0.09 0.09 0.14 0.10 0.12 0.11 0.11 0.11 3.10†
C910 1.36 1.50 1.40 1.35 1.35 1.38 1.39 1.35 1.26 1.37 1.48 -0.17
C91 C911 0.27 0.26 0.25 0.23 0.24 0.22 0.26 0.26 0.25 0.28 0.26 0.48
C913 0.01 0.01 0.01 0.03 0.02 0.02 0.05 0.03 0.05 0.04 0.04 15.81†
C914 0.01 0.01 0.01 0.01 0.01 0.01 0.01 0.01 0.00 0.01 0.01 0.05
C915 0.01 0.02 0.01 0.01 0.01 0.01 0.02 0.03 0.01 0.02 0.02 9.75†
C917 0.06 0.06 0.05 0.06 0.07 0.07 0.20 0.13 0.12 0.12 0.09 9.50†
C92 C920 2.16 2.38 2.21 2.32 2.35 2.12 1.96 1.85 2.03 1.98 1.97 -1.88†
C921 0.78 0.92 0.79 0.76 0.71 0.72 0.76 0.71 0.77 0.76 0.84 -0.45
C922 0.01 0.00 0.01 0.00 0.00 0.00 0.02 0.03 0.02 0.02 0.02 20.20†
C923 0.06 0.04 0.08 0.06 0.05 0.05 0.06 0.04 0.07 0.06 0.06 1.16
C924 0.24 0.26 0.31 0.32 0.32 0.37 0.33 0.32 0.35 0.34 0.39 3.47†
C925 0.11 0.15 0.12 0.14 0.14 0.10 0.26 0.21 0.19 0.17 0.19 5.79†
C926 0.03 0.02 0.01 0.01 0.01
C927 0.13 0.19 0.22 0.22 0.19 0.20 0.53 0.48 0.40 0.38 0.43 12.72†
C93 C930 0.05 0.06 0.06 0.06 0.07 0.06 0.13 0.09 0.09 0.10 0.07 5.98†
C931 0.02 0.02 0.01 0.01 0.01 0.02 0.08 0.07 0.09 0.08 0.09 26.10†
C937 0.00 0.01 0.01 0.01 0.01 0.00 0.00 0.01 0.00 0.00 0.00 -12.05
C94 C940 0.02 0.03 0.01 0.04 0.02 0.02 0.06 0.04 0.05 0.03 0.04 11.62†
C942 0.01 0.03 0.01 0.02 0.02 0.02 0.05 0.03 0.03 0.05 0.02 10.57†
C944 0.00 0.00 0.01 0.00 0.00 0.00 0.02 0.02 0.02 0.03 0.03 33.41†
C95 C950 0.20 0.24 0.30 0.31 0.34 0.39 0.51 0.54 0.63 0.63 0.62 12.87†
C96 C962 0.19 0.19 0.18 0.23 0.19 0.19 0.23 0.24 0.17 0.20 0.27 1.90
*See Table 1; †P-value<0.05.
increase by 2.59 times from 4.92 in 2005 to 12.75 in 2015. The codes with a PR greater than 10 were C900 of MM and C921 of chronic myeloid leukemia, BCR/ABL-positive.
4. The current incidence state of myelodysplastic syndrome (D46)
Among the five subcodes of MDS (D46), D467 of other MDS had the highest number of new diagnoses (70.1%, 11,346/16,034) and showed a gradual increase in the study. Regarding sex, ex- cept for refractory anemia without ring sideroblasts, so stated (D460), the number of new male patients was higher than that of females in most disease codes (Table 6).
DISCUSSION
In the analysis of the current status of hematologic malignancy from 2005 to 2015, the number of new patients diagnosed with
hematologic malignancy, with increased PR, increased for 10 years. According to a previous study in Korea from 1999 to 2008, the number of new patients showed an increase of approximately 69.1% (8,006/4,735) for total hematologic malignancies [2]. In an- other study from 1999 to 2012 [3], a rate of increase was approxi- mately 42.8% (1,257/880) for AML and approximately 106.9%
(813/393, from 2003 to 2012) for MDS. In this context, a continu- ous reporting system of the current status of hematologic malig- nancy in Korea should be firmly established, such as the systems in international studies on hematologic malignancy. Moreover, studies should expand their scope including not only some major cancers but also other minor cancers such as hematologic malig- nancies.
According to sex, the number of new patients diagnosed with C codes was higher in males than in females. Our results with high male proportions were consistent with those of the previous stud- ies in Korea, Europe, and the USA [2, 3, 7, 8]. Regarding age, the
Table 5. Prevalence rate in hematologic malignancies by year Major code* Minor
code*
Year
2005 2006 2007 2008 2009 2010 2011 2012 2013 2014 2015
C90 C900 4.92 5.46 6.12 6.6 7.29 7.96 8.43 9.61 10.47 11.6 12.75
C901 0.07 0.05 0.06 0.1 0.06 0.08 0.08 0.07 0.07 0.14 0.1
C902 0.38 0.41 0.56 0.57 0.68 0.78 0.87 0.9 0.91 0.96 1.05
C91 C910 5.95 6.84 7.11 7.32 7.58 7.81 7.9 8.13 8.29 8.57 8.94
C911 0.8 0.95 1.06 1.12 1.23 1.31 1.41 1.58 1.72 1.89 2.11
C913 0.02 0.03 0.03 0.06 0.06 0.07 0.11 0.11 0.13 0.13 0.15
C914 0.03 0.04 0.04 0.05 0.06 0.06 0.08 0.08 0.08 0.09 0.1
C915 0.03 0.05 0.03 0.02 0.03 0.03 0.06 0.07 0.07 0.08 0.09
C917 0.26 0.35 0.39 0.36 0.39 0.53 0.71 0.64 0.61 0.68 0.71
C92 C920 6.38 7.47 7.81 8.39 8.91 9.08 8.52 8.64 8.93 9.52 9.84
C921 4.64 5.2 5.7 6.42 6.97 7.52 8.17 8.71 8.95 9.74 10.57
C922 0.01 0.01 0.02 0.01 0.02 0.01 0.07 0.1 0.11 0.08 0.1
C923 0.25 0.26 0.32 0.28 0.33 0.37 0.45 0.42 0.41 0.46 0.44
C924 0.81 1.04 1.25 1.39 1.57 1.72 1.97 2.05 2.16 2.26 2.43
C925 0.24 0.31 0.3 0.33 0.35 0.29 0.59 0.67 0.7 0.72 0.79
C927 0.58 0.78 1.05 0.98 1 1.21 2.07 2.01 2.05 2.13 2.3
C93 C930 0.11 0.14 0.14 0.16 0.17 0.16 0.31 0.3 0.32 0.32 0.33
C931 0.07 0.06 0.04 0.06 0.06 0.07 0.26 0.31 0.37 0.42 0.46
C937 0.02 0.03 0.02 0.02 0.02 0.03 0.02 0.02 0.03 0.02 0.02
C94 C940 0.05 0.06 0.05 0.07 0.07 0.06 0.13 0.14 0.16 0.16 0.18
C942 0.05 0.04 0.04 0.05 0.05 0.06 0.1 0.1 0.09 0.11 0.11
C944 0.01 0.01 0.02 0.02 0.01 0.02 0.12 0.13 0.14 0.15 0.16
C95 C950 0.54 0.72 0.82 0.85 1.04 1.23 1.62 1.72 1.84 2.01 2.24
C96 C962 0.27 0.28 0.3 0.34 0.29 0.3 0.37 0.34 0.31 0.33 0.37
*See Table 1.
Table 6. Number of new patients with D46 according to sex
Code* Gender 2005 2006 2007 2008 2009 2010 2011 2012 2013 2014 2015 Total
D460 Male 108 117 91 114 125 101 132 98 76 69 77 1,108
Female 203 202 187 215 182 136 192 164 102 112 91 1,786
D461 Male 13 20 9 1 4 13 12 7 9 6 6 100
Female 11 16 10 10 9 8 14 11 9 7 9 114
D462 Male 61 35 49 54 53 54 71 78 71 93 108 727
Female 27 15 23 37 38 21 61 32 37 53 52 396
D465 Male 61 36 52 41 52 242
Female 53 27 37 44 54 215
D467 Male 334 475 442 529 554 659 633 674 718 760 818 6,596
Female 334 475 442 529 554 659 633 674 718 760 818 6,596
*See Table 1.
number of new patients aged 50 to 69 years was the highest ex- cept in lymphoid leukemia (C91), where young children are more likely to be diagnosed with lymphoid leukemia (C91) than adults [2, 9]. Nevertheless, as most of the newly diagnosed patients were elderly people, new patients might increase continuously in the future.
The increasing CIR during the study was similar to that of the
previous studies [2, 3, 7, 8], and it is likely that this will continue in the future because of the aging population. Furthermore, the in- creasing PR is likely to continue due to an increased survival rate [3, 10].
The code of other MDS (D467) had the largest proportion (70.8%) among MDS (D46) in our study. In the previous studies on the incidence of MDS in Japan, 73% of the cases were also
coded as MDS not otherwise specified [11]. MDS is a heteroge- neous group of myeloid disease [12], and the classification of the KCD-6 system does not correspond to the World Health Organi- zation (WHO) classification [13], which is one of the possible rea- sons regarding the mismatch between the diagnosis and claim codes.
Our study has a limitation, that is, we were not able to include the medical records, which are not integrated in the NHIS claims data, of individual patients. However, a systemic nationwide study was possible through coded data, and this can be useful to illustrate the general status of hematologic malignancies in Korea.
Additionally, as mentioned above, the classification of the KCD-6 system does not correspond to the WHO classification. Therefore, a more reliable analysis result will be generated and provided when the classification system is revised, considering the WHO classification.
In summary, our study showed the increasing incidence and prevalence of hematologic malignancies including leukemia and MDS. Therefore, further investigation is required. It is also neces- sary to consider introducing a continuous reporting system in Ko- rea, such as the Surveillance, Epidemiology, and End Results re- port from the National Cancer Institute in the USA [7] and the HAEMACARE project from the European HAEMACARE Working Group [8]. This nationwide data could contribute in the studies of hematologic malignancies and would be useful in the improve- ment of national public healthcare.
요 약
배경: 혈액암은 주요 고형암보다 상대적으로 낮은 유병률을 보이 나, 최근 그 빈도가 크게 증가하고 있다. 그러나 혈액암에 대한 질 환별 기초 데이터가 충분하지 않기 때문에 전체적 국내 현황 파악 이 쉽지 않은 상황이다.
방법: 2005년부터 2015년까지 제6차 한국표준질병사인분류에 의 해 분류된 24개의 하위코드를 포함하는 7개의 혈액암 관련 코드 를 분석하였다. 신규 환자 수, 조발생률, 유병률 및 연령 표준화 발 생률도 조사하였다. 결과 분석은 국민건강보험공단의 자료를 기반 으로 하여 이루어졌다.
결과: 신규 환자 수는 시간이 지남에 따라 전체적으로 증가했으며 10년간 최대 56.7%의 증가율을 나타내었다. 남성 환자의 수는 여 성 환자보다 많았으며, 대부분은 60세 이상이었다. 발병률과 유병 률 또한 꾸준히 증가하고 있다.
결론: 이전 연구들과 함께 본 연구가 국내 혈액암의 현 상황을 파 악하는 데 도움이 될 수 있으며 국가 공중보건의 개선에 기여할 수 있기를 기대한다.
Conflicts of Interest
None declared.
Acknowledgements
This research was supported by the National Health Insurance Service (NHIS) Ilsan Hospital grant (2017-20-013). This study used NHIS-National Sample Cohort data (NHIS-2017-1-240 and 2019-1- 179), made by the NHIS.
REFERENCES
1. Li J, Smith A, Crouch S, Oliver S, Roman E. Estimating the prevalence of hematological malignancies and precursor conditions using data from Haematological Malignancy Research Network (HMRN). Cancer Causes Control 2016;27:1019-26.
2. Park HJ, Park EH, Jung KW, Kong HJ, Won YJ, Lee JY, et al. Statistics of hematologic malignancies in Korea: incidence, prevalence and survival rates from 1999 to 2008. Korean J Hematol 2012;47:28-38.
3. Park EH, Lee H, Won YJ, Ju HY, Oh CM, Ingabire C, et al. Nationwide statistical analysis of myeloid malignancies in Korea: incidence and survival rate from 1999 to 2012. Blood Res 2015;50:204-17.
4. Lee H, Park HJ, Park EH, Ju HY, Oh CM, Kong HJ, et al. Nationwide statistical analysis of lymphoid malignancies in Korea. Cancer Res Treat 2018;50:222-38.
5. Korea Central Cancer Registry and National Cancer Center. Annual re- port of cancer statistics in Korea in 2015. Ministry of Health and Wel- fare, 2017.
6. Statistics Korea. Korean Standard Classification of Diseases and Causes of Death (KCD-6). Daejeon: Statistics Korea, 2011.
7. Noone AM, Howlader N, Krapcho M, Miller D, Brest A, Yu M, et al.
SEER Cancer Statistics Review, 1975-2015 https://seer.cancer.gov/csr/
1975_2015/ (Update on Sep. 2018).
8. Sant M, Allemani C, Tereanu C, De Angelis R, Capocaccia R, Visser O, et al. Incidence of hematologic malignancies in Europe by morphologic subtype: results of the HAEMACARE project. Blood 2010;116:3724-34.
9. Terwilliger T and Abdul-Hay M. Acute lymphoblastic leukemia: a com-
prehensive review and 2017 update. Blood Cancer J 2017;7:e577.
10. Song TY, Lee SH, Kim G, Baek HJ, Hwang TJ, Kook H. Improvement of treatment outcome over 2 decades in children with acute myeloid leukemia. Blood Res 2018;53:25-34.
11. Chihara D, Ito H, Katanoda K, Shibata A, Matsuda T, Sobue T, et al. In- cidence of myelodysplastic syndrome in Japan. J Epidemiol 2014;24:
469-73.
12. Montalban-Bravo G and Garcia-Manero G. Myelodysplastic syndromes:
2018 update on diagnosis, risk-stratification and management. Am J Hematol 2018;93:129-47.
13. Hasserjian RP, Orazi A, et al. Myelodysplastic syndromes: Overview.
In: Swerdlow SH, Campo E, et al. eds. WHO classification of tumours of haematopoietic and lymphoid tissues. Revised 4th ed. Lyon: Inter- national Agency for Research on Cancer, 2017:98-120.