Abstract
시각자극의 설계 1.
뇌파실험 과정 2.
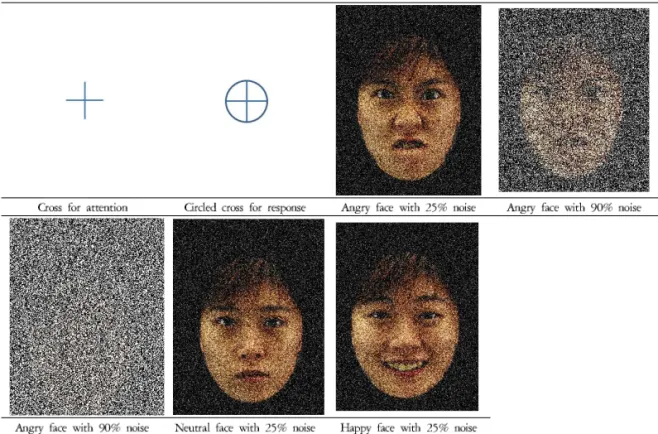
Figure 1. Images used for visual stimulation.
실험 후 후처리 과정 3.
Figure 2. Schematic diagram of stimulation procedure Figure 3. Location of attached electrode from top.
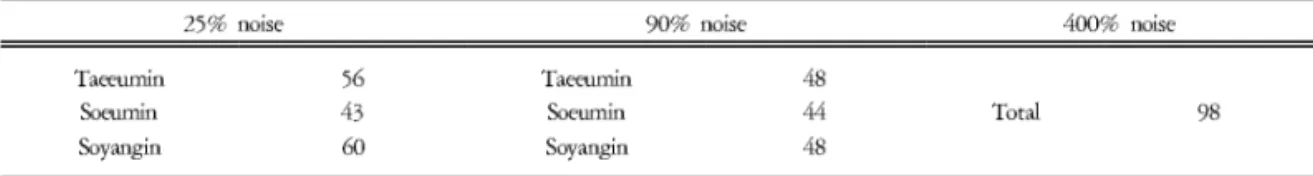
Table 1. Number of Trials Used for Analysis
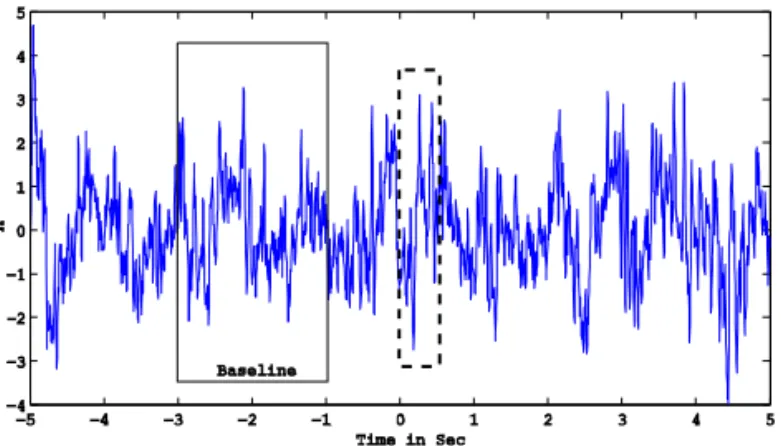
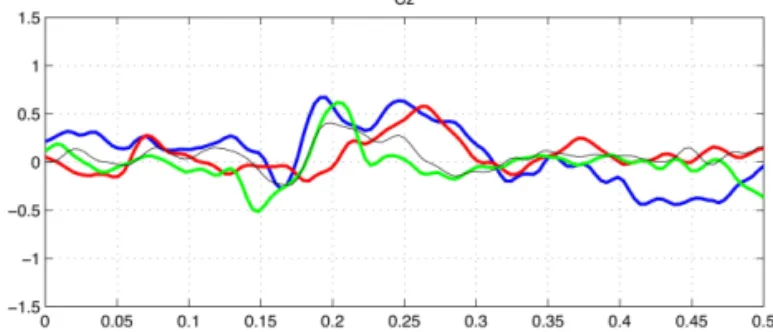
Figure 4. A sample potential trace of Oz from a trial.
Visual stimulation is presented at 0 in time. Solid box represents region for baseline. Dashed box is the region(from 0 to 500 msec) for average evoked potential.
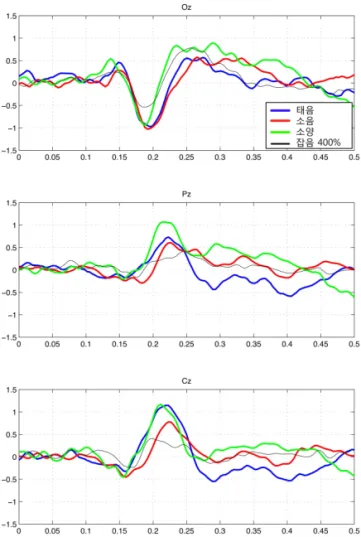
Figure 5. Normalized event related potential for each constitutional group evoked by emotional (angry and happy) face with 25% noise.
Figure 6. Normalized event related potential for each constitutional group evoked by emotional (angry and happy) face with 90% noise.