- 426 - Biomedical Science Letters 2018, 24(4): 426~429
https://doi.org/10.15616/BSL.2018.24.4.426 eISSN : 2288-7415
Different Protein Expression between Human Eosinophilic Leukemia Cells, EoL-1 and Imatinib-resistant EoL-1 Cells, EoL-1-IR
Kee-Hyung Sung1,2,*, In-Sik Kim1,3,* * and Ji-Sook Lee4,†,* *
1Department of Senior Healthcare, BK21 Plus Program, Graduate School, Eulji University, Daejeon 34824, Korea
2Department of Laboratory Medicine, Seoul National University Bundang Hospital, Seongnam, Gyeonggi-do, 13620, Korea
3Department of Biomedical Laboratory Science, School of Medicine, Eulji University, Daejeon 34824, Korea
4Department of Clinical Laboratory Science, Wonkwang Health Science University, Iksan 54538, Korea
Chronic eosinophilic leukemia (CEL) is characterized by eosinophilia and organ damage. Imatinib is widely used for treating CEL, chronic myeloid leukemia (CML) and acute myeloid leukemia (AML). Unfortunately, the cancer cells gain resistance against the drug after prolonged molecular-targeted therapies. Imatinib-resistant EoL-1 (EoL-1-IR) cells were produced from chronic eosinophilic leukemia cells (EoL-1) after treatment with imatinib for a long duration. Two- dimensional electrophoresis (2-DE) analysis revealed numerous protein variations in the EoL-1 and EoL-1-IR sub-types.
Compared to the EoL-1 cells, expression levels of TIP49, RBBP7, α-enolase, adenosine deaminase, C protein, galactokinase, eukaryotic translation initiation factor, IFN-γ, and human protein homologous to DROER were increased, whereas core I protein, proteasome subunit p42, heterogeneous ribonuclear particle protein, chain B, and nucleoside diphosphate were decreased in the EoL-1-IR cells. Taken together, these results contribute to understanding the pathogenic mechanism of drug-resistant diseases.
Key Words: Chronic eosinophilic leukemia, Imatinib, Drug resistance
Chronic eosinophilic leukemia (CEL) is a chronic myelo- proliferative neoplasm characterized by a clonal proliferation of eosinophilic precursors that lead to increase eosinophils in the peripheral blood, the bone marrow, and possibly peripheral tissues (Qu et al., 2016; Kim et al., 2017). The blood shows > 1.5 × 10⁹/L mature eosinophils and often increases the percentage of blasts in the blood or marrow up to and even exceeding 20%. FIP1L1-platelet-derived growth factor receptor-α (PDGFRα) fusion gene is very significant for the diagnosis and treatment of CEL. If there is no in- crease in the number of blasts and no evidence of mono-
clonality, the term hypereosinophilic syndrome (HES) is recommended (Antoniu, 2010; Klion, 2015). CEL is also called myeloid/lymphoid neoplasm with eosinophilia and abnormalities of PDGFRA, PDGFRB, FGFR1 or PCM1- JAK2 based on World Health Organization (WHO) classifi- cation (Reiter and Gotlib, 2017). Imatinib is a small-molecule inhibitor of breakpoint cluster region-abelson (BCR-ABL) kinase with additional activity against receptor tyrosine kinases such as c-KIT, PDGFRA, and PDGFRB. Although imatinib is highly effective in cancer including CEL, cancer cells can have imatinib-resistant characteristics after a long
Brief Communication
Received: September 14, 2018 / Revised: November 7, 2018 / Accepted: November 12, 2018
*Researcher, **Professor.
†Corresponding author: Ji-Sook Lee. Department of Clinical Laboratory Science, Wonkwang Health Science University, Iksan 54538, Korea.
Tel: +82-63-840-1216, Fax: +82-63-840-1219, e-mail: [email protected]
○CThe Korean Society for Biomedical Laboratory Sciences. All rights reserved.
○CCThis is an Open Access article distributed under the terms of the Creative Commons Attribution Non-Commercial License (http://creativecommons.org/licenses/by-nc/3.0/) which permits unrestricted non-commercial use, distribution, and reproduction in any medium, provided the original work is properly cited.
- 427 - term treatment. Therefore, we investigated whether there are differences between imatinib-sensitive and resistant CEL cells or not.
Human eosinophilic leukemia cells, EoL-1 cells were pur- chased from RIKEN BRC Cell Bank (Tsukuba, Japan). The imatinib-resistant EoL-1 (EoL-1-IR) cells were established
by culturing with increasing imatinib concentration (from 1 to 100 nM) for 6 months (Nishioka et al., 2010). EoL-1 and EoL-1-IR cells were cultured in RPMI 1640 including fetal bovine serum (FBS) and antibiotics. The cells were incu- bated at 37℃ in a 5% CO2 incubator. For two-dimensional electrophoresis, cell lysates in sample buffer were applied
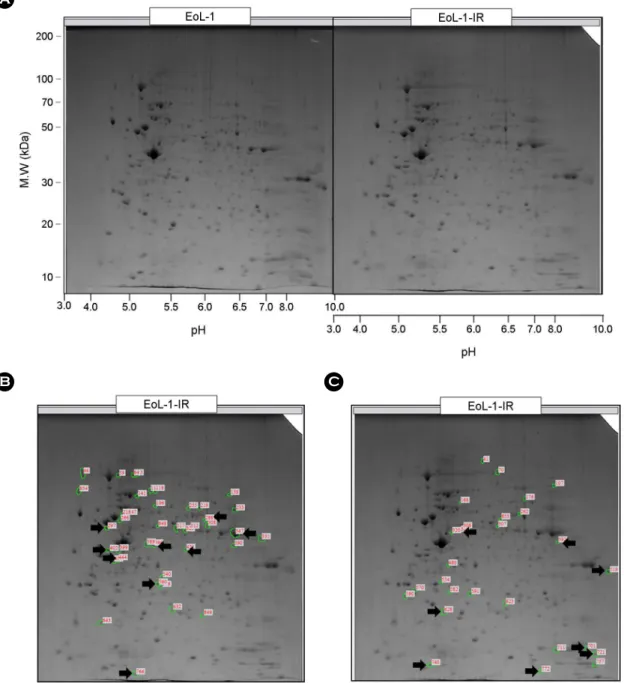
Fig. 1. Two-dimensional electrophoresis with EoL-1 and EoL-1-IR cells. EoL-1 and EoL-1-IR were analyzed by 2-DE. (A) 2-DE image for comparison between EoL-1 and EoL-1-IR. (B) The arrow marks on EoL-1-IR indicate spots for proteins differentially expressed by more than 2-fold compared with EoL-1. (C) The arrow marks on EoL-1-IR indicate spots for proteins differentially expressed by less than 2-fold compared with EoL-1.
C B
A
- 428 - to pH 3-10 nonlinear gradient strips (Amersham Biosciences, Uppsala, Sweden) and isoelectric focusing (IEF) was carried out. The second dimension was analyzed on gradient poly- acrylamide gel at 40 mA for 5 h. After fixation, the gels were stained with CBB G-250 for 12 h. The gels were destained, scanned in a Bio-Rad GS710 densitometer (Richmond, CA, USA) and converted into electronic files. The spots were analyzed with Image Master Platinum 5.0 image analysis program (Amersham Biosciences). For matrix associated laser desorption ionization-time of fight mass spectrometry
(MALDI-TOF/TOF MS) analysis, samples were applied to the R2, R3 column and eluted with an elution buffer. Mass spectra were acquired on a 4800 proteomics analyzer (Applied Biosystems, Foster, CA, USA) operated in MS and MS/MS modes. Peptide fragmentation was conducted by collision- induced dissociation (CID). For MS and MS/MS analysis, the 800~4,000 m/z mass range was used with 1,000 shots per spectrum, and amaximum of 15 precursors with amin- imum S/N of 50 were chosen. The MASCOT algorithm (Matrix Science, Boston, MA, USA) was used for protein
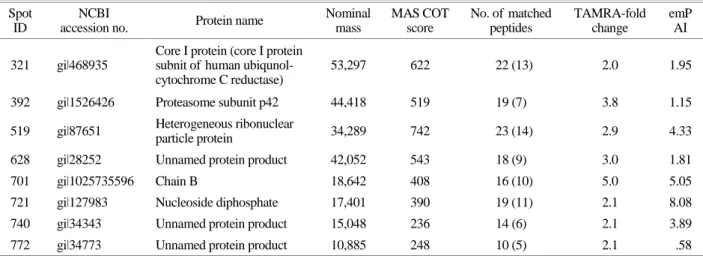
Table 2. List of proteins decreased in EoL-1-IR cells Spot
ID
NCBI
accession no. Protein name Nominal
mass
MAS COT score
No. of matched peptides
TAMRA-fold change
emP AI
321 giǀ468935
Core I protein (core I protein subnit of human ubiqunol- cytochrome C reductase)
53,297 622 22 (13) 2.0 1.95
392 giǀ1526426 Proteasome subunit p42 44,418 519 19 (7) 3.8 1.15
519 giǀ87651 Heterogeneous ribonuclear
particle protein 34,289 742 23 (14) 2.9 4.33
628 giǀ28252 Unnamed protein product 42,052 543 18 (9) 3.0 1.81
701 giǀ1025735596 Chain B 18,642 408 16 (10) 5.0 5.05
721 giǀ127983 Nucleoside diphosphate 17,401 390 19 (11) 2.1 8.08
740 giǀ34343 Unnamed protein product 15,048 236 14 (6) 2.1 3.89
772 giǀ34773 Unnamed protein product 10,885 248 10 (5) 2.1 .58
Ions score is -10*Log(P), where P is the probability that the observed match is a random event. Individual ions scores > 34 indicate identity or extensive homology (P<0.05)
Table 1. List of proteins increased in EoL-1-IR cells Spot
ID
NCBI
accession no. Protein name Nominal
mass
MAS COT score
No. of matched peptides
TAMRA-fold change
emP AI
286 giǀ3132308 TIP49 (RUVBL1, Pontin) 50,538 878 29 (18) 2.0 4.00
297 giǀ11935049 RBBP7 (RbAp46) 66,198 827 20 (13) 2.2 1.56
347 giǀ119339 Alpha-enolase 47,481 889 26 (19) 2.2 4.01
394 giǀ28380 Adenosine deaminase 41,024 411 14 (8) 2.6 1.01
402 giǀ306875 C protein (ribonuclear
protein particle c) 32,004 571 20 (10) 2.3 2.84
421 giǀ1002507 Galactokinase 42,702 599 17 (11) 2.9 2.09
444 giǀ124200 Eukaryotic translation
initiation factor 36,374 791 22 (15) 2.4 6.13
560 giǀ186513 Interferon-gamma 28,876 545 22 (14) 2.5 7.58
764 giǀ1374695 Human protein homologous
to DROER protein 12,422 216 9 (2) 3.3 1.14
Ions score is -10*Log(P), where P is the probability that the observed match is a random event. Individual ions scores > 34 indicate identity or extensive homology (P<0.05)
- 429 - identification.
Here, we investigated the different protein expression between EoL-1 and EoL-1-IR cells. Two-dimensional elec- trophoresis analysis was used for examining different pro- teins between EOL-1 and EOL-1-IR cells. After separation in the second dimension, 511 spots were routinely detected on two-dimensional electrophoresis (2-DE) gels of EoL-1 cell lysates, and 479 spots were detected on 2-DE gels of EoL-1-IR cell lysates (Fig. 1A). Molecular mass and pH values were also indicated. The arrow marks in 2DE of EoL-1-IR lysate indicate spots that were differentially ex- pressed by more than 2-fold compared to spots in 2DE of EoL-1 cell lysate. This analysis identified an increase (Fig.
1B) or a reduction (Fig. 1C) of more than 2-fold spots with a significant difference in EoL-1-IR cells compared to EoL-1 cells. Table 1 describes the names of the proteins, which in- creased more than 2-fold in EoL-1-IR compared to EoL-1.
TIP49 (RUVBL1, Pontin), RBBP7 (RbAp46), Alpha-enolase, adenosine deaminase, C protein (ribonuclear protein particle C), Eukaryotic translation initiation factor, interferon-gamma and human protein homologous to DROER protein were detected MALDI-TOF/TOF. Both TIP49 and RBBP7 pro- teins have been known to be involved in cancer patho- genesis (Si et al., 2010; Yeh et al., 2015). The names of the proteins, which decreased more than 2-fold in EOL-1-IR compared to EOL-1 cells are described in Table 2. Core I protein, Proteasome subunit p-42, Heterogeneous ribonu- clear particle protein, Unnamed protein product Chain B, Nucleoside diphosphate were detected by MALDI-TOF/
TOF. Resistance was observed in various situations as CEL patients take imatinib for a long time. Although we unveiled the proteins increased or decreased by imatinib resistance, their exact mechanisms remain to be unknown. Further study is required to elucidate the exact relationship of the proteins with drug resistance.
ACKNOWLEDGEMENT
This paper was supported by Wonkwang Health Science University in 2018.
CONFLICT OF INTEREST
The authors have no conflicts of interest, financial or
otherwise, to declare.
REFERENCES
Antoniu SA. Novel therapies for hypereosinophilic syndromes.
Neth J Med. 2010. 68: 304-310.
Kim IS, Gu A, Lee JS. The role of S100A8 and S100A9 in differentiation of human eosinophilic leukemia cells, EoL-1.
Biomed Sci Lett. 2017. 23: 44-47.
Klion AD. How I treat hypereosinophilic syndromes. Blood. 2015.
126: 1069-1077.
Metzgeroth G, Walz C, Erben P, Popp H, Schmitt-Graeff A, et al.
Safety and efficacy of imatinib in chronic eosinophilic leu- kaemia and hypereosinophilic syndrome: a phase-II study. Br J Haematol. 2008. 143: 707-715.
Nishioka C, Ikezoe T, Yang J, Yokoyama A. Long-term exposure of leukemia cells to multi-targeted tyrosine kinase inhibitor induces activations of AKT, ERK and STAT5 signaling via epigenetic silencing of the PTEN gene. Leukemia. 2010. 24:
1631-1640.
Qu SQ, Qin TJ, Xu ZF, Zhang Y, Ai XF, Li B, Zhang HL, Fang LW, Pan LJ, Hu NB, Xiao ZJ. Long-term outcomes of imatinib in patients with FIP1L1/ PDGFRA associated chronic eosinophilic leukemia: experience of a single center in China. Oncotarget.
2016. 7: 33229-33236.
Reiter A, Gotlib J. Myeloid neoplasms with eosinophilia. Blood.
2017. 129: 704-714.
Si J, Yu X, Zhang Y, DeWille JW. Myc interacts with Max and Miz1 to repress C/EBPdelta promoter activity and gene ex- pression. Mol Cancer. 2010. 9: 92.
Yeh HH, Tseng YF, Hsu YC, Lan SH, Wu SY, Raghavaraju G, Cheng DE, Lee YR, Chang TY, Chow NH, Hung WC, Liu HS.
Ras induces experimental lung metastasis through up-regulation of RbAp46 to suppress RECK promoter activity. BMC Cancer.
2015. 15: 172.
https://doi.org/10.15616/BSL.2018.24.4.426
Cite this article as: Sung KH, Kim IS, Lee JS. Different Protein Expression between Human Eosinophilic Leu- kemia Cells, EoL-1 and Imatinib-resistant EoL-1 Cells, EoL-1-IR. Biomedical Science Letters. 2018. 24: 426 -429.