Investigation of Job satisfaction, Organizational commitment and Factors of continuing work life for Nano-convergence employees
1)
Hongki Lee*, Sungmin Myoung**
Abstract
In this paper, we analyzed the relationship between employment stability, wage level, welfare system, working condition, job satisfaction and organizational commitment in order to find out ways to develop and competitiveness of the nano-convergence industries. Through this study, we conducted the possibility of deriving organizational commitment by job satisfaction which is given through employment stability, wage level, welfare system, and working condition for continuing their work life.
In order to find relationships between each concepts, we used a multiple regression analysis with job satisfaction and commitment as dependent variable and employment stability, wage level, welfare system, and working condition as independent variables. Through this study, it was expected to increase the organizational commitment through the job satisfaction of the employees if a changing method of employees management is centered on some tasks suggested for the sound working condition and efficient utilization policies.
▸Keyword: Organizational Commitment, Job Satisfaction, Employment stability, Wage Level, Welfare System, Working Condition
I. Introduction
The government is trying to develop strategies and to break the crisis of the domestic manufacturing industry for upgrading existing industries such as Nano Technology, IT (Information Technology), BT (Bio Techn ology), and ET (Environment Technology) [1]. Especially, nano-convergence industry is attracting attention as a major industry in the fourth industrial revolution.
The government emphasized that the nano-convergenc e industry has grown from 6.6% to 9% of total manufactur ing sales over the past five years and is a representative convergence industry. And that means it will continue to support the nano-convergence industry [1-2].
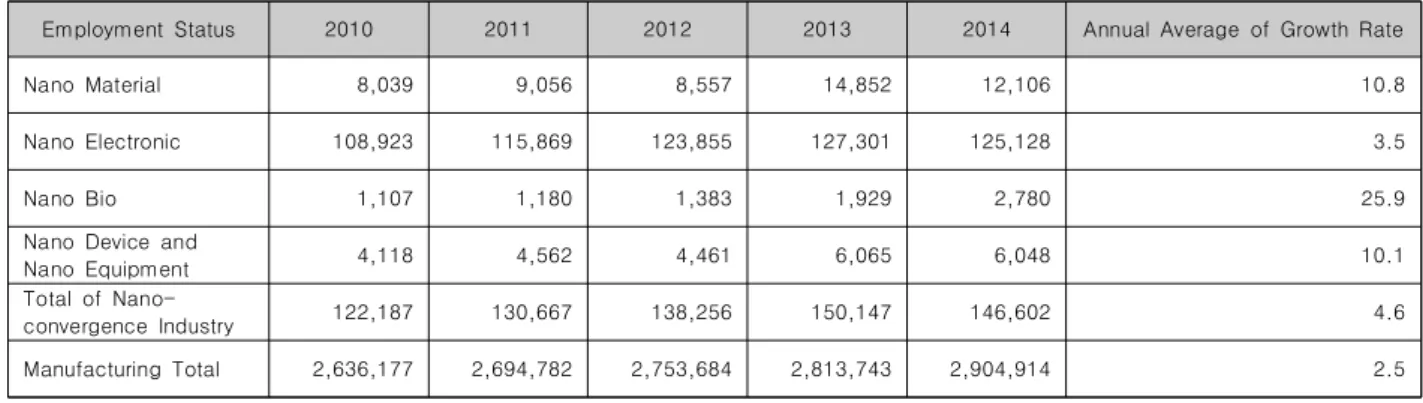
Employment status in the nano-convergence industry is also increasing year by year in Table 1. From contextual
point of view, employees in the nano-convergence industry experience mismatches between their needs and various environmental demands in the course of their duties which cause various stresses for them. Moreover, in the complicated job organization, many problems lead to the difficulty of job performance [1-2].
If those stresses are not adequately resolved, they will feel frustrated or helpless. In particular, recent changes in the fourth industrial revolution have brought a drastic change to the related workers, which has not only worsened their job conditions, increased their workload, but also caused complaints. In general, job stress has been known to be a major factor in reducing job satisfaction and weakening commitment to the organizat
∙First Author: Hongki Lee, Corresponding Author: Sungmin Myoung
*Hongki Lee ([email protected]), Dept. of Management, Jungwon University
**Sungmin Myoung ([email protected]), Dept. of Health Administration, Jungwon University
∙Received: 2019. 04. 08, Revised: 2019. 05. 24, Accepted: 2019. 05. 26.
Employment Status 2010 2011 2012 2013 2014 Annual Average of Growth Rate
Nano Material 8,039 9,056 8,557 14,852 12,106 10.8
Nano Electronic 108,923 115,869 123,855 127,301 125,128 3.5
Nano Bio 1,107 1,180 1,383 1,929 2,780 25.9
Nano Device and
Nano Equipment 4,118 4,562 4,461 6,065 6,048 10.1
Total of Nano-
convergence Industry 122,187 130,667 138,256 150,147 146,602 4.6
Manufacturing Total 2,636,177 2,694,782 2,753,684 2,813,743 2,904,914 2.5
Table 1. Nano-convergence industry workers by industry (5 years)
ion. In some cases, serious job stress results in the decision to move away from the current organization to another [3]. Therefore, recent studies on the stress from job are increasing. However, most of the studies have focused on the effects of job stress on job satisfaction and organizational commitment, as well as on the relationsship between job stress and turnover intention.
Researches on the effects of job stress factors on job satisfaction, organizational commitment, and turnover intention using the structural equation model for nano-convergence workers are insufficient.
Also, unlike other manufacturing industries, employees of nano-industry workers required precise and R&D works, and were expected that the risk of stress and working condition will be higher. In addition, the nano–
convergence industries have the characteristics of being associated with various industrial fields under the existing industrial structure, also it have been mainly known that is characterized by the smallness centered on small and medium-sized enterprises [4].
With this in mind, this study intends to find ways to develop and compete of the nano-convergence industry.
In detail, this study is to induce organizational commitment by providing employment satisfaction, stable working life conditions and welfare satisfaction.
Specifically, we present the relationship between measuring tools consisted of questionnaires, such as organizational commitment, job satisfaction, working conditions and welfare satisfaction, in 200 employees of nano-convergence companies by correlation and regressi on analysis.
Through this research, it was expected to find a relationship between organizational commitment and job satisfaction of the nano-convergence employees which is given some concepts such as employment stability, wage level, welfare system, and working condition.
II. Preliminaries
Job security, suggested by Chant (1958), is defined the probability that an individual will keep her or his job [5].
At the point of employment stability, It means that the employment is stable regardless of which worker is employed [5]. Working conditions is known as the working circumstances and all existing environment influencing labor in the workplace, including job hours, physical aspects, legal rights and responsibilities [7]. Also, job satisfaction is known two most common definitions as: First, the pleasurable emotional state resulting from the appraisal of one’s job as accomplishing [8]. Second, the extent to which people satisfaction or dissatisfaction their jobs [9].
Organizational commitment is the psychological attachm ent that an employee has with their organization. It is known that it plays a important role in ascertaining the bond that the employee shares with the organization [10].
Based on this definition, conceptual and empirical studies on various aspects of job stress, such as job stress theory and model, predecessor and outcome variables, and job stress coping strategies, have been actively conducted
[3,11]. In addition, the concept of job burnout has emerged as a type of job stress, and many studies have been conducted on the concept of job burnout and predecessor and outcome variables which affect to the job burnout [12-14]. In Korea, researches on job stress have been actively conducted.
According to the results of a literature search on
domestic journals before this study 'The effect of job
stress on job involvement and organizational attachment'
is the first study on the job stress [15]. After that study,
researches on job stress in organization have been
carried out for 30 years [16-19]. Although there is a
considerable increase in the number of domestic studies
on job stress [20-22], there are insufficient researches
Measurement Variable No. of
items Operational Definition Scale
Employment Stability 7 the stability that one has in his/her has or desires in job or occupation Likert 5-point
Wage Level 1 monthly average wage level ordinal
Working Condition 5 Subjective conditions in which an individual or staff works, including but not limited to such things as amenities, physical environment, stress and noise levels
Likert 5-point Welfare System 4 Fair to all employees, receive equal treatment with others, compliance with
labor-related laws and regulations
Likert 5-point Job Satisfaction 5 The positive emotional state obtained from the job environment according
to the level of individual attitude, value, belief
Likert 5-point Organizational Commitment 20 Strength of the felling of responsibility that an employee has towards the
mission of the organization
Likert 5-point Demographic Characteristics 4 gender, age, hire type, tenure(year), education nominal/
ordinal
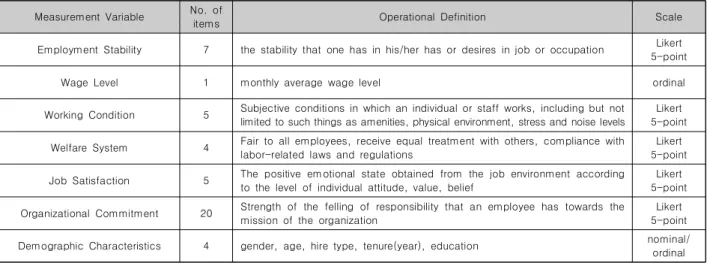
Table 2. Operational definition of variables and composition of questionnaire
on the study of nano-convergence workers and the future direction. At this point, it is necessary to study the trends and limitations of job stress for nano-convergence practitioners and to suggest future research directions.
III. Research Method
1. Research Model
In this study, we collect and analyze data from questionnaires of 200 workers working in the production and R & D of nano-related manufacturers in one metropolit -an area.
The research model to achieve the purpose of this study is shown in <Fig. 1>. In this study, research hypothesis are as follows.
∘ Hypothesis 1: The employment stability factor have positive association for the job satisfaction.
∘ Hypothesis 2: The wage level have positive association for the job satisfaction.
∘ Hypothesis 3: The working condition have positive association for the job satisfaction.
∘ Hypothesis 4: The welfare system have positive association for the job satisfaction.
∘ Hypothesis 5: A positive association between the job satisfaction and the organizational commitment is existed.
2. Survey Design and Statistical Analysis The questionnaires used in this study were reconstructed according to the direction of this study based on the previous studies [23-30].
In detail, the employment stability was 7 items
suggested by Kim et al [18]. The working condition was consisted of 5 items which described the satisfaction of working environment.
The wage level present 1 items, and the welfare system was 4 items which is reflected self-development, welfare system, cultural leisure and health care. Job satisfaction is defined as a positive emotional state experienced according to attitude, value, belief, and demand related to job, and consisted of 5 items. The organizational commitment is 20 items centered on emotional commitment, and normative commitment suggested by Meyer and Allen (1991). All measure tools are rated on 5-point Likert scale. Table 2.
shows the operational definition and measurement of variables presented in this study. All statistical analysis was used SPSS 25.0, and statistical significance was considered for p -value under 0.05. The statistical analysis technique is as follows:
First, demographic characteristics were presented in order to identify the characteristics of respondents. Second, confirmatory factor analysis and reliability analysis were conducted for the validity and reliability analysis of the measurement tools. In addition, Pearson correlation coefficient was demonstrated to understand the correlation between variables. Third, multiple regression analysis was conducted to verify the research hypothesis.
Fig. 1. Research Model
IV. Results
The questionnaires for this study were conducted on 200 workers working in the production and R&D functions of nano-related manufacturers in the metropolitan area.
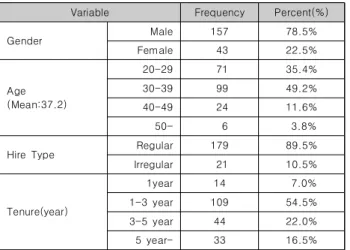
After the purpose of this study was explained to the manager of the company, the questionnaire was distributed to the workers, and the completed questionnaire was collected. As Table 2. shows, regarding the proportion of employ ees’ gender, 78.5% of participan ts were males and 22.5% were females. The mean age was 37.2 years, and 49.2% of workers were 30-39 years and 35.4% were 20-29 years. Regular hire type was specified 179 (89.5%) of the total 200 participants, 1-3 year of tenure were classified the highest as 109 (54.5%).
1. Factor Analysis and Realiability Analysis For the validity of the questionnaire items applied to the empirical analysis, confirmatory factor analysis was presented in Table 4. In order to evaluate the goodness of fit test, chi-squared test result is
=35.14(p-value<0.
001), the value of RMSEA (root mean square error of approxim ation) is 0.014, NNFI (normed fit index)is 0.945, IFI (incre mental fit index) is 0.948, and CFI (comparative fit index) is 0.937, therefore we concluded that the validity of this model was appropriate. Scaling is the process of developing systematic laws and meaningful units of measure and quantifying observations that have been measured on the basis of experiences.
Variable Frequency Percent(%)
Gender Male 157 78.5%
Female 43 22.5%
Age (Mean:37.2)
20-29 71 35.4%
30-39 99 49.2%
40-49 24 11.6%
50- 6 3.8%
Hire Type Regular 179 89.5%
Irregular 21 10.5%
Tenure(year)
1year 14 7.0%
1-3 year 109 54.5%
3-5 year 44 22.0%
5 year- 33 16.5%
Table 3. Demographic Characteristics in this study (N=200)
(p-value)Index of goodness of fit
RMSEA NNFI IFI CFI
35.14
(p<0.001) 0.014 0.945 0.948 0.937
Table 4. Goodness of fit for confirmatory factor analysis
The purpose of this scaling is to assign numbers so that the majority of people with the same attributes or attitudes have the same score. The Thurstone, Likert and Guttman scale have been developed and among which the Likert scale is most widely used [31-33].
Reliability refers to the accuracy associated with measuring an object consistently with some degree of stability. Cronbach’s alpha was widely used to evaluate the reliability. Cronbach’s alpha measures the correlation between measured items or the correlation between observed and true scores and is expressed as a value between 0 and 1. Usually, a value of 0.5 or more is considered reliable [34-38].
In this study, it was judged that Cronbach’s alpha value is more than 0.6. Table 5 shows the result of the analysis of the reliability of measurement variables and items.
These results show appropriate validity and reliability of all factors in this study.
2. Correlation Analysis
We analyzed the relevance significance of employment stability, wage level, welfare system and working conditions. In order to assess the strength and direction of the relationships among the variables of employment stability, wage level, welfare system, working condition, job satisfaction and organizational commitment, correlation analysis was present in Table 6. In a matrix of correlations, welfare system and working conditions are highly correlated. Other than this, the significance levels of relationship with other variables were low.
Measurement Variable Cronbach’s alpha
Employment Stability 0.8516
Wage Level 0.8277
Welfare System 0.8778
Working Condition 0.6801
Job Satisfaction 0.7491
Organizational Commitment 0.7884
Table 5. Reliability Analysis Result
ES WL WS WC JS OC
ES 1.00
WL 0.13 1.00
WS 0.12 0.22 1.00
WC 0.01 0.18 0.27* 1.00
JS 0.12 0.03 0.40* 0.55* 1.00
OC 0.20 0.03 0.07 0.14 0.34* 1.00
†ES: Employment Stability, WL: Wage Level, WS: Welfare System, WC: Working Condition, JS: Job Satisfaction, OC: Organizational Commitment
*p-value<0.001
Table 6. Correlation analysis for variables
†The variables with high correlation with job satisfaction were welfare system and working condition, and variable with high correlation with organizational commitment was job satisfaction.
3. Regression Analysis
For the purpose of verification of research hypothesis, we conducted multiple regression analysis to examine effects of factors such as employment stability, wage level, welfare system and working conditions. The results of regression analysis are shown in Table 7. The independent variables were considered employment stability, wage level, welfare system and working conditions, and the job satisfaction was selected as the dependent variable. The adjusted
was 42.80% and F -statistic was 14.65. This implies that the regression model is statistically significant ( p -value<0.001). The positive effect of job satisfaction on welfare system and working condition was statistically significant ( p -value<0.001). This means that the higher the welfare system and working conditions, the higher the job satisfaction. In addition, employment instability and wage level showed positive effects on job satisfaction and statistically significant. The greater the instability of employment was related with the lower the job satisfaction. Wage level was analyzed to have a positive effect on job performance. In addition, working condition was the highest regression coefficient (beta=0.4913), that means working condition was the most influential factor for job satisfaction among the four variables. In order to diagnose multicolinearity, each VIF(variance inflation factor)s of variables were confirmed to be less than 10, and there was no problem of multicolinearity.
Variables B‡ Beta* t p-value
Intercept 1.7888 4.1183 <0.001
ES 0.1665 0.2444 2.7046 0.008
WL 0.2116 0.2326 2.5065 0.015
WS 0.2882 0.3492 3.6950 0.004
WC 0.5791 0.4913 5.2972 <0.001
adj
=0.4280, F=14.65(p-value<0.001), VIF=3.45†ES: Employment Stability, WL: Wage Level, WS: Welfare System, WC: Working Condition
‡B: Unstandardized Regression Coefficient
*Beta: Standardized Regression Coefficient
Table 7. Regression Results for Job Satisfaction
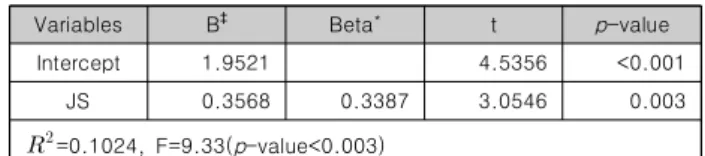
†In order to examine the effect of job satisfaction on organizational commitment, job satisfaction was selected as independent variable and regression analysis was conducted by selecting organizational commitment as dependent variable (Table 6). The regression analysis result was 0.1024 adjusted
, and the F-value indicating the significance of model was 9.3306, which was statistically significant at p -value<0.001 level. The regression coefficient confirmed that job satisfaction was a positive effect (B=0.3568) on commitment, and statistically significant (p-value=0.003).
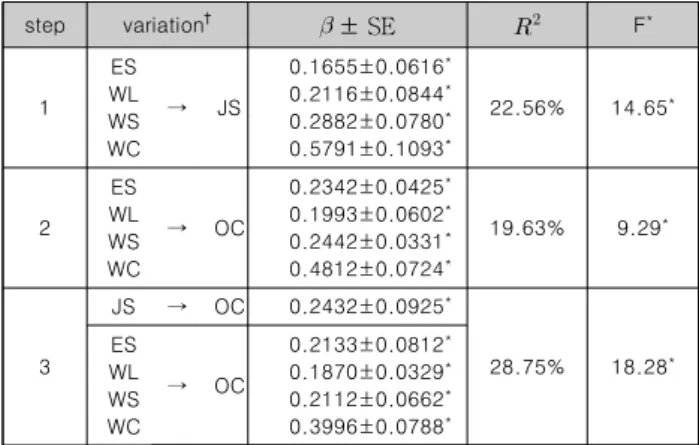
In addition, Baron and Kenny’s 3-step regession analysis is presented in Table 9. in order to confirm the mediating effect of job satisfaction on the relationship between employment stability, wage level, welfare system and working condition.
The effects of employment stabilit y, wage level, welfare system and working condition on job satisfaction (step 1) were statistically significant. The effect of independent variables on organizational commitm ent (step 2) was also positive regression coefficients, which was statistically significant (p-value<0.001).
Variables B‡ Beta* t p-value
Intercept 1.9521 4.5356 <0.001
JS 0.3568 0.3387 3.0546 0.003
=0.1024, F=9.33(p-value<0.003)†JS: Job Satisfaction
‡B: Unstandardized Regression Coefficient
*Beta: Standardized Regression Coefficient
Table 8. Regression Results for Organizational Commit ment
†step variation†
± SE
F*1 ES WL WS WC
→ JS
0.1655±0.0616* 0.2116±0.0844* 0.2882±0.0780* 0.5791±0.1093*
22.56% 14.65*
2 ES WL WS WC
→ OC
0.2342±0.0425* 0.1993±0.0602* 0.2442±0.0331* 0.4812±0.0724*
19.63% 9.29*
3
JS → OC 0.2432±0.0925*
28.75% 18.28* ES
WL WS WC
→ OC
0.2133±0.0812* 0.1870±0.0329* 0.2112±0.0662* 0.3996±0.0788*
†ES: Employment Stability, WL: Wage Level, WS: Welfare System, WC: Working Condition, JS: Job Satisfaction, OC: Organizational Commitment
*p-value<0.01