An Analytical Study on Bearing Mechanism of Very Soft Ground Covered with Geotextile by Effects of
Friction between Ground and Geotextile
토목섬유로 표층 처리된 초연약지반의 지지 메커니즘에 미치는 토목섬유와 지반의 마찰 영향
안 동 한
1Ahn, Dong-Han 유 승 경
2* You, Seung-Kyong
ABSTRACT
In general, ground surface strengthening such as using geotextile is needed to secure trafficability of construction equipment.
There are many researches for mechanical beha-vior of very soft ground covered with geotextile, however, most of them are under the condition to fix geotextile completely. In this study, numerical analyses were carried out to figure out the effects of restricting conditions of geotextile on bearing mechanism of very soft ground covered with geotextile. In numerical analyses, joint elements were used to figure out the friction properties between ground and geotextile. The results of numerical analyses were compared with the results of model test. In conclusion, the effects of restricting conditions of geotextile on bearing mechanism of very soft ground covered with geotextile became clear.
요 지
일반적으로 초연약지반에서는 건설장비의 주행성 확보 등을 위하여 토목섬유와 같은 표층 보강재를 적용하게 된다. 그러나
최근 토목섬유로 표층 처리된 초연약지반의 거동에 관한 많은 고찰이 수행되어 왔지만 대부분의 연구에서 토목섬유와 지반의
경계조건을 적절히 표현하지 못하고 있는 실정이다. 따라서 본 연구에서는 토목섬유와 지반의 경계조건이 토목섬유로 표층
처리된 초연약지반의 거동에 미치는 영향에 대하여 수치해석적 고찰을 수행하였다. 수치해석에서는 토목섬유와 지반의 마찰에
대한 경계조건을 다양하게 표현하기 위하여 조인트 요소를 적용하였다. 수치해석의 결과는 기존의 실내모형실험 결과와의 비교를 통하여 그 신뢰성을 검증하였으며 파라메트릭 스터디를 통하여 토목섬유와 지반의 경계조건에 따른 초연약지반의 거동을 규명하였다.
Keywords : Very soft ground, Geotextile, Restricting conditions, Bearing mechanism, Ground surface strengthening 한국토목섬유학회논문집 제9권 4호 2010년 12월 pp. 47 ∼ 55
J. Korean Geosynthetics Society Vol.9 No.4 December. 2010 pp. 47 ~ 55
1 비회원, 오사카대학 토목공학과 대학원 박사과정 (Non-member, Graduate Student, Dept. of Civil Eng., Osaka University)
2* 정회원, 명지전문대학 토목공학과 부교수 (Member, Associate Professor, Dept. of Civil Eng., Myongji College, E-mail: [email protected])
1. Introduction
A large number of reclamation projects have been carried out in coastal regions to develop many kinds of infrastructures such as ports, airports, new towns, industrial complexes and agricultural fields by spreading sand or
clay on the very soft ground in recent years. It is usually impossible that construction equipments used to develop the very soft ground enter the very soft ground area.
Therefore, ground surface strengthening such as using
geotextile is needed to secure trafficability of construction
equipment.
Fig. 1. Outline of model test
Table 1.Physical property of the Kwangyang clay Specific
gravity
Unit weight (kN/m3)
Liquid limit (%)
Plastic limit (%)
2.65 16.82 45.9 21.7
Table 2.Result of wide width tensile test for geotextile Test No. Wide width tensile strength
(kN/m)
Tensile strain (%)
1 33.94 21.1
2 36.10 16.5
3 37.28 16.9
4 32.37 20.7
5 37.38 17.3
Average 35.41 16.0
There are many researches (Fukusumi et al, 1967;
Yamanouchi et al, 1979; Watari et al, 1986; Ahn et al, 2008, 2009, 2010a, 2010b) for mechanical behavior of very soft ground covered with geotextile. However, most of them are under the condition to fix geotextile com- pletely. Although the end region of getextile is fixed gen- erally, tensile force at geotextile occurs by embankment and geotextile moves retaining constant confining force being at the breaking point.
The purpose of this paper is to clarify effects of re- stricting conditions of geotextile on bearing mechanism of very soft ground covered with geotextile through nu- merical analyses. Numerical analyses applying the joint elements are carried out to consider the slip between ground and geotextile which occurs if the shear stress exceeds the frictional resistance. The results of numerical analyses are compared with the results of model test which was carried out under the complete fixed condition and three kinds of partial fixed conditions. After verifi- cation of numerical analysis method, Effects of shear strength of joint elements and initial tensile force of geotextile on bearing mechanism of very soft ground covered with geotextile are figured out to the effects of restricting conditions of geotextile on it.
2. Outline of model test
Fig. 1 shows the outline of model test for bearing capacity of very soft clay ground covered with geotextile (Ham et al., 2008, 2009). The soil box used in this model test is 2 meters in length, 1 meter in height and 0.5 meters in width. The soils used in the model test are dredged clays in Kwangyang port, Korea. Table 1 shows the physical properties of the Kwangyang clay. After remolding under the about 2.5 times of liquid limit, the soil box was filled with this clays. The vane shear test revealed that undrained shear strength is about 1 kN/m
2.
A loading plate which had 0.1 meter in width was put on the center of the geotextile as shown in Fig. 1. Loading pressure was measured by load cell and displacement was measured by LVDT.
Moreover, wide width tensile test was carried out to figure out maximum tensile strength and tensile strain.
Table 2 shows the result of wide width tensile test for geotextile. As a result, the rigidity of geotextile is about 220 kN/m.
The boundary conditions of geotextile are divided by the complete fixed condition and the partial fixed con- dition. The complete fixed condition is that the both end regions are fixed by clamp and the partial condition is to provide preloading to geotextile by weight. In the partial fixed conditions, three kinds of weights which are 23 kgf, 55.6 kgf and 85.6 kgf are used in model test.
3. Analytical method
In the numerical analyses, an elastoplastic finite element
analysis was applied. Ground material was modeled by
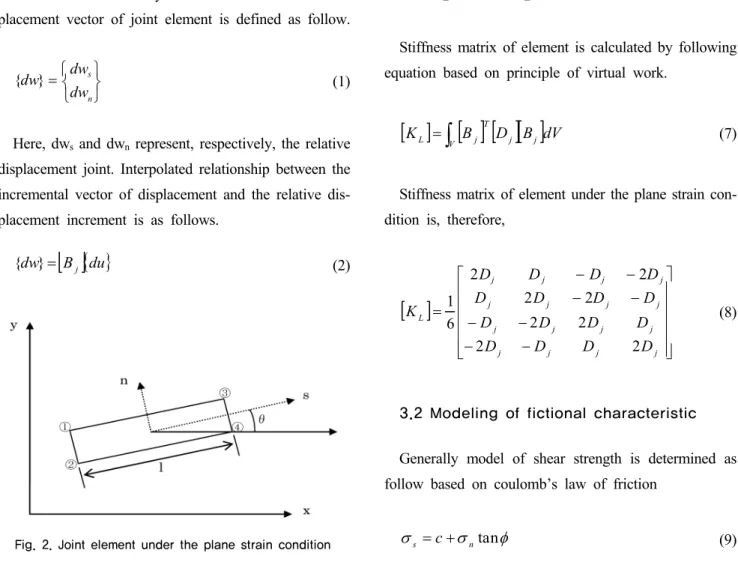
Fig. 2. Joint element under the plane strain condition
the elastoplastic ground based on the von Mises criterion because it is very soft clay which water content is very high and permeability is very low. In numerical analysis, return mapping algorithms (Ortiz et al, 1986) and displac- ement controlled by Arc Length Method (Crisfield, 1981) are used to get a stable value until residual displacement state. Geotextile is modeled by cable elements to consider effect of tensile force because bending rigidity and com- pressive rigidity is very small. Joint elements are also used to consider the slip between ground and geotextile which occurs if the shear stress exceeds the frictional resistance.
3.1 Constitutive model of joint element Fig. 2 shows joint element under the plane strain condition. In this figure, node 1 and node 4 have same coordinates as and node 2 and node 3 under the initial condition, respectively. Therefore, the thickness of this element is 0 in the analytical model. The relative dis- placement vector of joint element is defined as follow.
⎭ ⎬
⎫
⎩ ⎨
= ⎧
n s
dw dw} dw
{ (1)
Here, dw
sand dw
nrepresent, respectively, the relative displacement joint. Interpolated relationship between the incremental vector of displacement and the relative dis- placement increment is as follows.
[ ]
B{ }
dudw
} =
j{ (2)
[ ] ⎥
⎦
⎢ ⎤
⎣
⎡
−
−
−
= −
A A B B B B A
Bj A
0
0 0 0 0 0 0 0 2
1 (3)
Incremental vector of stress of joint element is defined as follow.
⎭ ⎬
⎫
⎩ ⎨
= ⎧
n s
d d d
σ σ } σ
{ (4)
where dσ
sand dσ
nare shear stress increment and vertical stress increment, respectively. Mechanical characteristic of joint elements can be expressed by on the supposition that the relationship between the relative displacement increment and the relative stress increment is as Eq. (5).
[ ]
D{ }
dw d} =
j{ σ (5)
[ ] ⎥ ⎥
⎦
⎤
⎢ ⎢
⎣
= ⎡
21 2212 11
j j
j j
j D D
D
D D
(6)
Stiffness matrix of element is calculated by following equation based on principle of virtual work.
[ ]
K[ ] [ ][ ]
B Dj Bj dV TV j
L
= ∫ (7)
Stiffness matrix of element under the plane strain con- dition is, therefore,
[ ]
⎥ ⎥
⎥ ⎥
⎥
⎦
⎤
⎢ ⎢
⎢ ⎢
⎢
⎣
⎡
−
−
−
−
−
−
−
−
=
j j
j j
j j j j
j j j
j
j j
j j
L
D D
D D
D D D D
D D
D D
D D
D D K
2 2
2 2
2 2
2 2
6
1 (8)
3.2 Modeling of fictional characteristic
Generally model of shear strength is determined as follow based on coulomb’s law of friction
φ σ
σ
s= c +
ntan (9)
Fig. 3. Joint element under the plane strain condition
Fig. 4. Analytic model
Fig. 5. Analytical model of end region of geotextile
Here σ
s, σ
n, c and φ are stress at shear direction, stress at vertical direction, cohesion and friction angle, respectively.
Fig. 3 shows the relationship between the relative displacement at shear direction and shear stress. K
sis the gradient of the relationship between σ
sand W
s. It also means the shear stiffness of joint element. When linear relationship like line in Fig. 5 is given, if K
shas very great value, the relative displacement does not occur, in other words, the elements combined by joint element behave like one element until reaching τ
max. After reaching τ
max, W
sincreases without increase of shear stress, in other
word, slip of joint element can be expressed. However, if K
shas very great value, the number of repeat cal- culation resulted from the sharp change of shear stiffness increase remarkably at the point to change area of linear relationship to area of occurring slip of joint element.
Here, dotted line in this figure is the relationship which shear stiffness becomes smaller and relative displacement becomes bigger and they also approach zero when Ws has small value. This relationship can be expressed by following equation.
5 . 0 , 10 3
exp 1
4 0
0 max
=
×
=
⎪⎭
⎪ ⎬
⎫
⎪⎩
⎪ ⎨
⎧
⎟⎟ ⎠
⎜⎜ ⎞
⎝
⎛ −
−
=
− m
W
w ws m
s
τ
σ (10)
Shear stiffness for relative displacement is
⎪⎭
⎪ ⎬
⎫
⎪⎩
⎪ ⎨
⎧
⎟⎟ ⎠
⎜⎜ ⎞
⎝
⎛ −
× −
= ×
=
−m s m
m s s
s
s w
w W
W
m dW
k d
0 0 1
max
exp
τ
σ (11)
4. Outline of numerical analysis
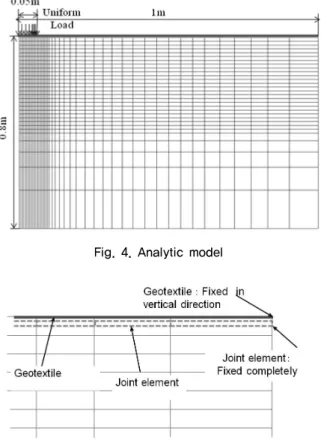
Fig. 4 shows an analytic model. Area of analytical model is the half section which the center of the loading plate is a symmetric axis to consider symmetry. Length and depth of the model ground are 1 meter and 0.8 meters. The boundary condition is that right side and left side are rollers which are free in vertical direction and bottom of the model ground is also roller which is free in horizontal direction. Further, the cable element modeling geotextile is arranged on the model ground surface. In numerical analysis, uniform load which is different from model test was used as loading method.
Fig. 5 shows modeling of end region of geotextile. In
this figure, line is a geotextile and area surrounded by
dotted line is joint element. In this figure, joint element
has a thickness to pick it out although in reality it does
not have thickness. Joint element arranged under geotextile
is to evaluate the friction between ground and geotextile.
Table 3.Analytical parameters
E0 ν c φ
Ground 8 0.45 1 0
Geotextile EA=220 T=34
E0(kN/m2):modulus of elasticity, ν:Poisson’s ratio, c(kN/m2):
cohesion, φ(deg):internal fiction angle, EA(kN/m):tensile stiffness, T(kN/m): tensile strength
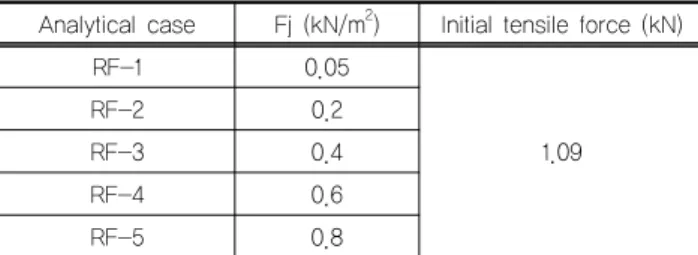
Table 4.Analytical cases
Analytical case Fj (kN/m2) Initial tensile force (kN)
RF-1 0.05
1.09
RF-2 0.2
RF-3 0.4
RF-4 0.6
RF-5 0.8
Fig. 6. Analytical results and experimental result on S-P curve
Fig. 7. Relative displacement of joint elements
Geotextile is fixed only in vertical direction and joint
element is fixed completely shown in Fig. 5.
Table 3 shows the parameters of model ground and geotexlile. Results of vane shear test and wide width tensile test are used for cohesion of ground and tensile strength and stiffness of geotextile.
5. Effects of shear strength of joint element on mechanical behavior
In this chapter, numerical analysis using joint element are carried out to estimate the effects of restricting con- dition of geotextile on the bearing mechanism of very soft ground covered with geotextile.
Table 4 shows analytical cases. Fj is shear strength of joint element. Analytical cases are which angle of shearing resistance has fixed value 0° and shear strength of joint element is changed. Initial tensile force of geotextile is given to repeat result of model test in partial fixed con- ditions using 55.6 kgf weight. However, the area where tensile force occurs becomes smaller because the shape of geotextile used in this test is like net. Therefore, tensile force occurs bigger than 55.6 kgf in experiment case using 55.6 kgf weight. Initial tensile force of geotextile is given 111.2 kgf because it was estimated twice as 55.6 kgf weight in the analytical result.
Fig. 6 shows analytical results and experimental result
on load-settlement curve. In this figure, lines stand for analytical results and point stands for experimental result.
RF-3 almost corresponds with experimental result. And the gradients of load-settlement curves for all of analytical cases are same until settlement reaches 5 cm. However, they increase shapely according to shear strength of joint element due to the increase of settlement.
Fig. 7 shows relative displacement of joint elements
when loading pressure reaches 25 kN/m
2. The positive
direction is when geotextile slips in the direction of
loading plate. In case of RF-3, the slip occurs at almost
whole geotextile. The gradient of load-settlement changes
sharply when loading pressure reaches 25 kN/m
2in case
of RF-3. Therefore, it is because of slip of geotextile. In
cases of RF-4 and RF-5, the relative displacement of geo-
textile occurs from the area where is 20 cm apart from
the center of the loading plate. Therefore, the gradients
of load-settlement do not change when loading plate
reaches 25 kN/m
2shown in Fig. 6.
Fig. 8. Tensile force at several spots in case of RF-3 Fig. 9. Tensile force at several spots in case of RF-5
Fig. 10. Distribution of vertical stress in case of RF-3 Fig. 11. Distribution of vertical stress in case of RF-5
Figs. 8 and 9 show tensile force at several spots due to loading pressure in case of RF-3 and RF-5, respectively.
In case of RF-5, tensile force increases linearly due to the increase of loading pressure at whole spots. However, tensile force does not increase largely at the end region of geotextile where slip of geotextile occurs. In case of RF-3, the increased percentage of tensile force becomes smaller because slip of geotextile occurs at whole spots of geotextile after loading plate reaches 25 kN/m
2. Therefore, the gradient of load-settlement curves in case of RF-3 increases sharply shown in Fig. 6 because tensile force of geotextile does not increase due to the increase of loading pressure after slip of geotextile occurs.
Fig. 10 shows distribution of vertical stress on the surface of ground in case of RF-3 when loading pressure reaches 10, 20, 25 and 30 kN/m
2. The maximum tensile force also occurs around the edge of loading plate. And vertical stress formed right side of loading plate where does not receive loading pressure deceases sharply. This
is because dispersive effect of geotextile becomes smaller due to the slip of geotextile. Therefore, dispersive effect of geotextile is under the control by the slip of geotextile.
Fig. 11 shows distribution of vertical stress on the surface of ground in case of RF-5 when loading pressure reaches 10, 20, 25 and 30 kN/m
2. When the loading pres- sure reaches 10 kN/m
2, vertical stress is bigger than RF-3 because slip of geotextile does not occur. However, dis- persive effect of geotextile becomes smaller due to the increase of loading pressure even though it is bigger than RF-3.
6. Effects of initial tensile force of geotextile on mechanical behavior
Table 5 shows analytical cases. R is the analytical case
which geotextile is completely fixed. Other analytical cases
which angle of shearing resistance and shear strength of
joint element are fixed by value 0° and 0.4 kN/m
2, respect-
Table 5.Analytical cases Analytical
case
Fj (kN/m2)
Initial tensile force (kgf)
Boundary condition of geotextile
R 0.4 0 Complete Fixed
RT-1
0.4
0
Partial fixed
RT-2 46
RT-3 171.2
RT-4 408
RT-5 816
Fig. 12. Analytical results and experimental result on S-P curve
Fig. 13. Relative displacement of joint elements
Fig. 14. Distribution of vertical stress on the surface in case of R
ively, and initial tensile force of geotextile is changed.
Five cases are given including RT-2 and RT-3 to repeat result of model test in partial fixed conditions using 23 kgf and 85.6 kgf weights, respectively.
Fig. 12 shows analytical results and experimental result on load-settlement curve. In this figure, lines stand for analytical results and points stand for experimental results. Experimental results are under the partial fixed conditions which 23 kgf, 55.6 kgf and 85.6 kgf weight are used in model test. Analytical results in cases of RT-2, RF-3 and RT-3 almost correspond with experimental results even though RT-2 is little different from experimental result. The gradients of load-settlement curves become smaller due to the increase of initial tensile force of geotextile. Especially, the gradients of load-settlement curves in cases of RT-4 and RT-5 are smaller than R until the maximum settlement of ground reaches about 7 cm.
However, they are not changed in cases of RT-4 and RT-5 as compared with case of R which it becomes smaller due to the increase of loading pressure. Then they become bigger exceeding the limitation.
Fig. 13 shows relative displacement of joint elements when loading pressure reaches 25 kN/m
2. In case of RT-2, slip of geotextile occurs at almost whole geotextile. In case of RT-3, the relative displacement of geotextile occurs from the area where is 30 cm apart from the center of the loading plate. In cases of RT-4 and RT-5, slip of geotextile almost does not occur even though the relative displacement occurs very little around the edge of geo- textile. Therefore, slip of geotextile becomes smaller due to the increase of initial tensile force of geotextile. Because initial tensile force of geotextile resists pull out force of geotextile.
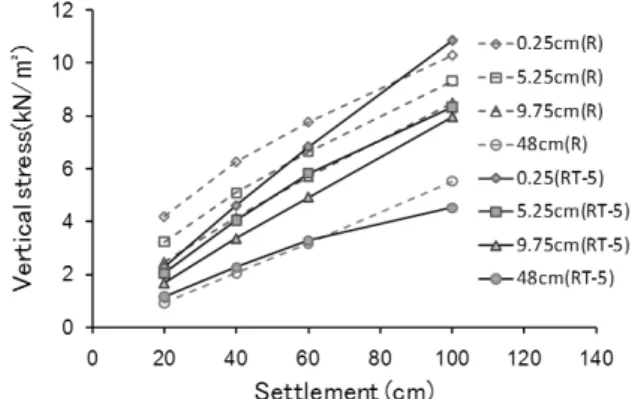
Fig. 14 shows the distribution of vertical stress on the surface of the model ground in case of R. Vertical stress is when loading pressures are 20 kN/m
2, 40 kN/m
2, 60 kN/m
2and 100 kN/m
2. The maximum vertical stress occurs at the left side of model, in other word, the center of the model ground. Remarkable vertical stress is also formed right side of loading plate where does not receive loading pressure because of dispersive effect of geotextile.
Fig. 15 shows distribution of vertical stress on the
Fig. 15. Distribution of vertical stress in case of RT-5 Fig. 16. Vertical stress at several spots in cases of RT-5 and R
Fig. 17. Distribution of tensile force of geotextile in case of R Fig. 18. Distribution of tensile force of geotextile in case of RT-5
surface of ground in case of RT-5 when loading pressure reaches 20, 40, 60 and 100 kN/m
2. The maximum vertical stress also occurs at the left side of model, in other word, the center of the model ground. Dispersive effect becomes smaller when loading pressure reaches 100 kN/m
2.
Fig. 16 shows vertical stress of ground surface in cases of R and RT-5 to figure out the difference of dispersive effect of geotextile between them. Spots are 0.25 cm, 5.25 cm, 9.75 cm and 48 cm from the left side model ground. In case of RT-5, vertical stress occurs smaller than R due to the big initial tensile force. However, Burden of ground becomes bigger due to the slip of geotextile.
Therefore, the maximum vertical stress becomes bigger than R and vertical stress at the spot which is 48 cm from the left side model ground after loading pressure reaches 80 kN/m
2. In other words, dispersive effect of RT-5 be- comes smaller than R after loading pressure reaches 80 kN/m
2due to the slip of geotextile.
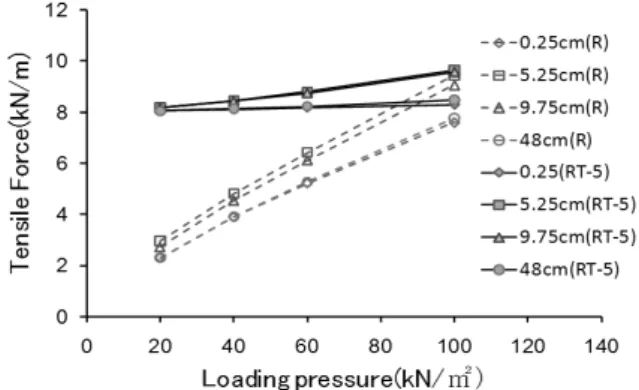
Fig. 17 shows the distribution of tensile force of geo- textile in case of R. Tensile force of geotextile is when loading pressure reaches 20, 40, 60 and 100 kN/m
2. The
maximum tensile force occurs around the edge of loading plate. Remarkable tensile force is also formed right side of loading plate where does not receive loading pressure by the dispersive effect of geotextile. Therefore, the gradient of load-settlement curves in case of R becomes smaller due to the increase of loading pressure shown as Fig. 12.
Fig. 18 shows distribution of tensile force of geo- textile in case of RF-5 when loading pressure reaches 20, 40, 60 and 100 kN/m
2. Tensile force which is almost same as initial tensile force occurs at whole geotextile until Dispersive effect of geotextile is bigger than R shown as Fig. 9 until loading pressure reaches 60 kN/m
2.
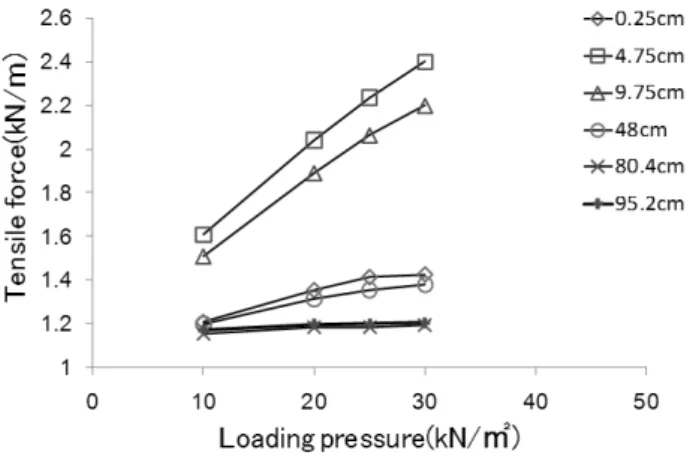
Fig. 19 shows tensile force of geotextile in several spots in cases of R and RT-5. Spots are 0.25 cm, 5.25 cm, 9.75 cm and 48 cm from the left side model ground.
In case of RT-5, tensile force is bigger than R until
loading pressure reaches about 80 kN/m
2. However, in
case of RT-5, tensile force of geotextile almost does not
increase due to the increase of loading pressure. Because
stiffness of geotextile becomes bigger due to the big initial
tensile force, small settlement occurs. Therefore, tensile
Fig. 19. Tensile force at several spots in cases of RT-5 and R
force does not increase due to the increase of loading pressure until loading pressure reaches about 80 kN/m
2. After loading pressure reaches 80 kN/m
2, tensile force of geotextile does not increase due to slip of geotextile. In case of R, by contrast, it increases linearly due to the increase of loading pressure. And in case of RT-5, it becomes smaller than R after loading pressure reaches about 80 kN/m
2. Therefore, the bigger dispersive effect in partial fixed condition with big initial tensile force could be expected than in complete fixed condition until a certain limitation because the bigger tensile force occurs.
7. Conclusion
Numerical analyses were carried out to figure out effects of restricting condition of geotextile on bearing mechanism of very soft ground covered with geotextile.
Main conclusions in this paper can be summarized as follows;
(1) Numerical analysis method proposed by authors could depict model test on very soft ground covered with geotextile.
(2) Due to increase of tensile strength between ground and geotextile and initial tensile force of geotextile, fictional resistance of geotextile and dispersive effect of geotextile becomes bigger.
(3) In partial fixed condition which initial tensile force exceeds the limitation, gradients of load-settlement curves are smaller than in complete fixed condition in initial loading steps. However, it becomes smaller than in complete fixed condition because dispersive
effect of geotextile becomes smaller due to slip of geotextile.
References
1. Ahn, D.H., You, S.K., Oda, K and Tokida, K. (2008), “Effect of Length of Geotextile on Bearing Capacity of Very Soft Clay Ground with Geotextile through Numerical Analysis.”, Proceedings of Second Japan-Korea Geotechnical Engineering Workshop, pp.13-17.
2. Ahn, D.H. and You, S.K. (2009), “Numerical Analysis on Behaviors of Very Soft Ground Improved by Geotextile”, j. Korean Geosynthetics Society, Vol.8, No.3, pp.9-16.
3. Ahn, D.H., Oda, K., Tokida, K. and You, S.K. (2010a),
“Numerical Analysis on Bearing Mechanism of Very Soft Ground Covered with Geotextile”, ISOPE-2010 Beijing Conference, pp.720-725.
4. Ahn, D.H., Oda, K, Tokida, K. and You, S.K. (2010b),
“Effects of Yeild of geotextile on Bearing Mechanism of Very Soft Ground Covered with Geotextile”, Twin Interna- tional Conferences on Geotechnical and Geo-Environmental Engineering cum (7th) Ground Improvement Techniques, pp.43-50.
5. Crisfield, M.A. (1981), “A Fast Incremental/iterative Solution Procedure that Handles Snap Through”, Computer and Structure, Vol.13, pp.55-62.
6. Fukusumi, K and Nishibayashi, K. (1967), “Surface Soil Stabilization of Soft Ground Using Vinylon Sheet”, The 22th Conferences on Geotechnical Engineering, pp.1-4.
7. Ham, T.K., Cho, S.D., Yang, K.S. and You, S.K. (2008), “A Study on The Improving Effects of the Bearing Capacity of Very Soft Ground by Restricting Conditions of Reinforce- ment”, j. Korean Geosynthetics Society, Vol.7, No.3, pp.41-49.
8. Ham, T.K., Cho, S.D., Yang, K.S. and You, S.K. (2009),
“Characteristics of Settlement for Non-woven Geotextile through Cyclic Loading Model Test”, j. Korean Geosynthetics Society, Vol.8, No.2, pp.11-20.
9. Ortiz, M. and Simo, JC. (1986), “An Analysis of a New Class of Integration Algorithms for Elasoplasic Constitutive Relations”, International Journal for Numerical Method in Engineering Vol.23, pp.353-366.
10. Watari, Y. et al (1986), “Field study of behavior of geogrids and soft ground”, 3tj Int. Conf. of Geotextiles, pp.187-191.
11. Yamanouchi, T. and Goto, K. (1979), Suggestion of Rational Bearing Capacity Formula for Surface Soil Stabilization Using Sheet, Weekly News of Engineering in Kyushu University, pp.201-207.
(논문접수일 2010. 9. 27, 심사완료일 2010. 12. 22)