ⓒ Korean Meteorological Society, 2010 153
1. Introduction
Weather observations at the surface level are the fundamental data used for safety as well as climatological purpose. There are needed to forecast weather and issue warnings worldwide. Observations can be taken manually by a weather observer or by computer through the use of automated weather stations. The capabilities of an Automatic Weather Station (AWS) allow the retrieval of important weather information without having to have a person on duty at each site (WMO, 1992a). However, as the 70% of the Korean Peninsula is covered by mountains, gathering of the meteorological information of particular regions (extreme high mountains, canyons, small islands etc) by wired transmission systems is difficult (Chang
et al., 2005). An AWS usually forms a part of a networkof meteorological station, each transmitting its processed data to a central network processing system by various data transmission modes. While planning the installation and
operation of a network of AWSs, it is of utmost importance to consider the various problems associated with maintenance and calibration facilities, the cost of which is prohibitive.
Of late, weather research and operation is undergoing a major technological revolution because of the interfaces developed among atmospheric science, engineering and information technology (Estrin et al., 2003; Oh, 2005).
These advances have been spurred by decreasing cost, size and weight, and improved reliability, of sensing hardware and software. For instance technological developments coupled with the miniaturization of electronics and wireless communication technology have had to the emergence of sensor network (Chang et al., 2005; Hart and Martinez, 2006; Suri et al., 2006; Walter and Nash, 2009).
In this study, a web-base open data capture and processing infrastructure has been proposed with a multi-scale effective weather monitoring system over ubiquitous sensor network. The web-base data management framework enables to serve as a model for collaborative, cost effective performance weather monitoring for the public domain (Samuelson, 2003). Section 2 describes the instrumentation and data utilized in this study.
Section 3 describes the procedure designed for the weather monitoring system which is able to observe
Prototype for the Weather Monitoring System with Web - Based Data Management - Construction and Operation
Jinwoo Kim1, Jin-Young Kim1, Jai-Ho Oh1,* and Do-Yong Kim2
1Department of Environmental Atmospheric Sciences, Pukyong National University, Busan, Korea
2Center for Atmospheric Sciences & Earthquake Research, Korea Meteorological Administration, Busan, Korea (Manuscript received 12 February 2010; in final form 12 May 2010)
Abstract
In this paper, an attempt has been made to build and test self-configuring weather sensor networks and internet based observation system to gather atmospheric data. The aim is to provide integrated or real-time weather information in stand- ard form using network data access protocol. This system was successfully developed to record weather information both digital as well as visual using sensor network and web-enabled surveillance cameras. These data were transformed by network based data access protocol to access and utilize for public domain. The competed system has been successfully utilized to monitor different types of weather. The results show that this is one of the most useful weather monitoring system.
Key words: Field Server, Ubiquitous Sensor Network, Wireless Sensor Network, data sharing, weather monitoring
*Corresponding Author:Jai-Ho Oh, Department of Environmental Atmospheric Sciences, Pukyong National University, 599‐1, Daeyeon 3‐Dong, Nam‐gu, Busan, 608‐
737, South Korea.
Phone: +82-51-629-6643, Fax: +82-51-629-7991 E-mail: jhoh@ pknu.ac.kr
154 Prototype for the Weather Monitoring System with Web - Based Data Management - Construction and Operation
weather condition, transmit and standardize the observed data, distribute it to researchers, forecasters, as well as the general public regarding gathering important meteorological information. The results of the construction and operation are presented in Section 4. Concluding remarks are given in the final chapter.
2. Method
2.1 Instrumentation and data
To monitor weather conditions an Internet Field Observation Robot, FieldServer (FS, Honda, 2009) has been utilized in this study. The FS has been developed by National Agricultural Research Center in Japan.
Currently this is being used not only in agricultural field (Honda, 2009; Fukatsu et al., 2006; Fukatsu and Hirafuji, 2005; Hirafuji et al., 2004; Kiura et al., 2002) but also in other disciplines. For instance Nepal Research Center has installed this system in some strategic area of the Himalayas to observe the glacial lake being created upon melting of glacier due to global warming. Photograph and schematic diagram in the right and the left side of
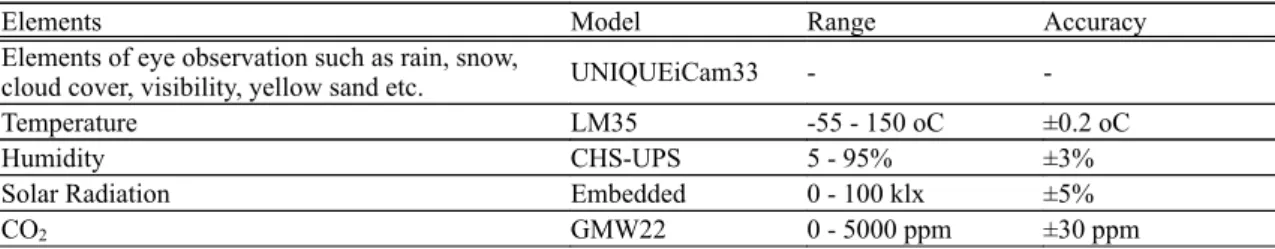
Fig. 1 show appearance and inner parts of the FS, respectively. To minimize the direct influence of radiant energy from the Sun, the FS uses a white color container made of acrylic. All the instruments are put inside the container to decrease the possibility of corrosion based on oxidation. The diameter and height of the container are 36.5 cm and 47.6 cm, respectively. It is also manufactured as closed-type except for the two upper holes to allow flow of air. The FS captures the actual real time weather condition using Internal Protocol (IP, Internet, Network) camera so that users are able to observe the weather elements by eye such as rain, snow, visibility, cloud cover, ceiling, yellow sand etc with their own eyes. The four kinds of weather elements are recorded using sensors as shown in Table 1. The net solar radiation and carbon dioxide (CO
2) are measured using radiometer and CO
2analyzer. The air temperature and relative humidity are obtained using standard instruments.
All the observations are recorded every 10 min. Moreover the FS has adapted wireless card, control card and solar power. Wireless FS denote a node of IP-Ubiquitous Sensor Network (IP-USN) in the monitoring system used here.
2.2 Observation site and period
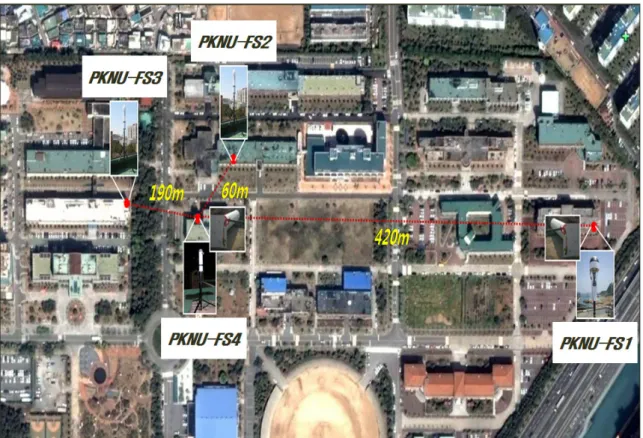
The Pukyoung National University (PKNU) located near the coastal area has been selected as a testbed for monitoring the waterfront weather. Observations have been taken at the four different locations during the period June to December, 2009. The four different locations denoted in red in Fig. 2 are FS1 (35.85
oN, 129.63°E), FS2 (35.85
oN, 129.62°E), FS3 (35.84
oN, 129.70°E) and FS4 (35.84
oN, 129.62°E). These are located on the roof of building considering practicability
Fig. 1. Photograph and schematic diagram of Fieldserver.Table 1. Specification of FS launched on PKNU.
Elements Model Range Accuracy
Elements of eye observation such as rain, snow,
cloud cover, visibility, yellow sand etc. UNIQUEiCam33 - -
Temperature LM35 -55 - 150 oC ±0.2 oC
Humidity CHS-UPS 5 - 95% ±3%
Solar Radiation Embedded 0 - 100 klx ±5%
CO2 GMW22 0 - 5000 ppm ±30 ppm
rather than an ideal site at which there is no effect of direct and indirect heating from building or tree, and measure weather elements in height of 1.5 m (Joo et al., 2005).
The distance between two stations varies between 60 to 420 m. These have been indicated by dashed line. The FS1 is located toward beach side. The location and height specification of FS launched on PKNU has shown in Table 2.
3. Design of the weather monitoring system using IP-Ubiquitous Sensor Network with web-based data management
A weather monitoring system has been constructed using the FS with IP-USN technique and new data management for monitoring severe weather condition and forecasting. The main concept of weather monitoring
system is to utilize the techniques in terms of ‘ubiquitous sensor and standardized data sharing’. Of late the USN is known as an epoch-making method considering low energy, expansibility, and mobility (Shin et al., 2008).
This can be established by simple installation of wireless network. Fig. 3 shows observing and network Infrastructure for the FS used in this study using IP-USN. The dashed line and solid line indicate wireless network and the FS-Agent access boundary, respectively. The arrows
Fig. 2. Satellite imagery of observational site. Pukyong National University (PKNU) is located near the Sea beach. The points in red indicate the location of FS1, FS2, FS3 and FS4. The dash of red between two stations denotes the shortest distance in meters.Table 2. Location and height of observation sites.
Instrumentation
Location
Height Latitude (m)
(oN) Longitude (oE)
FS1 35.85 129.63 25.8
FS2 35.86 129.62 12.6
FS3 35.84 129.70 26.7
FS4 35.84 129.62 27.5
156 Prototype for the Weather Monitoring System with Web - Based Data Management - Construction and Operation
indicate the direct access and data transmission between the FS and the FS-Agent. The FS located far away from FS-Agent is able to connect and transfer signal information to FS-Agent passing through closest FS node. This flexible whole network in this figure refers to as IP-USN.
Observed data given by FS are collected by FS-Agent.
The FS-Agent distinguishes observation from each FS using point access of IP. These data are available for use at any time by directly accessing using a web browser.
Thus the FS-Agent could serve the weather dataset and images to researchers who know IP address of FS-Agent and each FS. To overcome the limitation, the Open-source Project for a Network Data Access Protocol (OPeNDAP) has been proposed in this study. The OpeNDAP is a software framework that simplifies all aspects of scientific data networking, allowing simple access to remote data. This has been developed by joint efforts of the staff and scientists of the Graduate School of Oceanography at the University of Rhode Island and Department of Earth Atmospheric and Planetary Science at the Massachusetts Institute of Technology for the purpose of oceanographic data management. The Data Access Protocol (DAP) of OPeNDAP uses the dialog between requesting clients and responding servers, but
it does not specify implementation of that dialog. As long as the program can hold up its end of the conversation, there is no limit on how it is done. Specifically, this means that though the DAP specifies the persistent representation of its abstract data type, it does not specify the data structures that may implement these data types in a computer program. This also means that the programs can use any means to transport to request and response, although the DAP protocol has been designed with protocols such as Simple Object Access Protocol (SOAP) over Hypertext Transfer Protocol (HTTP), Grid File Transfer Protocol (FTP), etc. Thus, this is a data transmission protocol designed specifically for scientific data to allow users to define their own data types (name-datadype- value tuples). In addition the OPeNDAP uses different web service design. Two classes of web services have emerged. The web service system is based on HTTP, Extensible Mark-up Language (XML) and Uniform Resource Identifier (URI). In these systems, XML is typically used to encode the representation (although for the web in general, Hypertext Mark-up Language, HTML is used). Such systems are also often called
‘network-based’ because the existence of network operations is made explicit. The second type of system follows the Remote Procedure Call (RPC) model and uses the SOAP along with other technologies such as Web Services Description Language (WSDL) and Universal Description, Discovery, and Integration (UDDI) and builds a distributed system (where the network operations are hidden from client programs). Unlike HTTP/URI systems, using SOAP/WSDL/UDDI it is possible to build a system where clients can access machine readable interface descriptions (using WSDL records which can themselves be located using UDDI) and then use the RPCs in those descriptions to access a server. (Samuelson, 2003; Sgouros, T. 2004)
The weather monitoring system with web-based data management can be classified into three components: (i) instrumentation for meteorological observations, (ii) web based data collector and simply distribute through instrumentation using IP-USN, (iii) advanced distributor and visualization tool for the use of the researchers as well as public. These were named PKNU-FS, PKNU-
Fig. 3. Schematic illustration of observing and network infrafor Field Server (FS) using Internal Protocol-Ubiquitous Sensor Network (IP-USN). The dashed line and Solid line indicate wireless network and the FS-agent access boundary.
The arrows indicate the direct connection between the FS and the FS-Agent. The cross over arrow represents the direct disconnection between the FS and the FS-Agent. The blanked arow represents data transferring way. The whole network of this figure refer to IP-USN.
Agent and PKNU-OPeNDAP, respectively. Fig. 4 presents in detail the process of data-collection and -distribution among PKNU-FS, PKNU-Agent and PKNU-OPeNDAP
at web-based environment. The observed data (temperature, relative humidity, solar radiation, CO
2etc) given by PKNU-FS are transferred through wireless (Ethernet).
Fig. 4. Process of data collection, conversion and distribution among FS, PKNU-Agent, PKNU-OPeNDAP, respectively.
The numbers indie the circles represent the sequence of process.
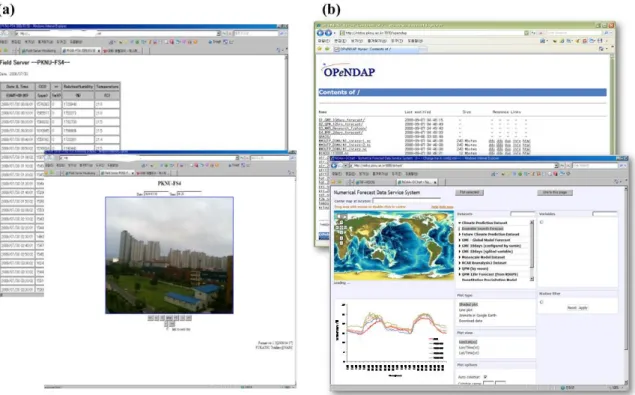
Fig. 5. Data viewed in simple table and image from (a) PKNU‐Agent and (b) PKNU‐OPeNDAP.
158 Prototype for the Weather Monitoring System with Web - Based Data Management - Construction and Operation
This is managed by the PKNU-Agent which is connected to access point of each FS. The PKNU-Agent is written in Java language on Linux operating system and the observed digital data saved into standard units of parameter in the form of HTML. Thus user will be able to access these data through web browser. Then the PKNU-OPeNDAP transforms into Network Common Data Form (NetCDF) and is categorized. Finally standardized datasets can be distributed through PKNU-OPeNDAP HTTP protocol. Therefore, users are capable of accessing data with convenience by using preexisting web browser whenever they want. Furthermore users can easily change the form of data in which they want.
4. Results
The data retrieved from the weather monitoring system were in the form of simple data and graphs for the period July to December, 2009 in real-time as shown in Fig. 5. The data are divided into PKNU-Agent Fig.5(a) and PKNU-OPeNDAP Fig.5(b). PKNU-Agent can easily show the integrated data in the form of table and image as shown in Fig. 5(a). The image is also provided by 10 pre-sets position for the camera, according to which the camera will rotate periodically and transfer images in all these positions. PKNU-OPeNDAP in Fig.
5(b) shows various kinds of meteorological data including FS observed digital data in the form of NetCDF. Any
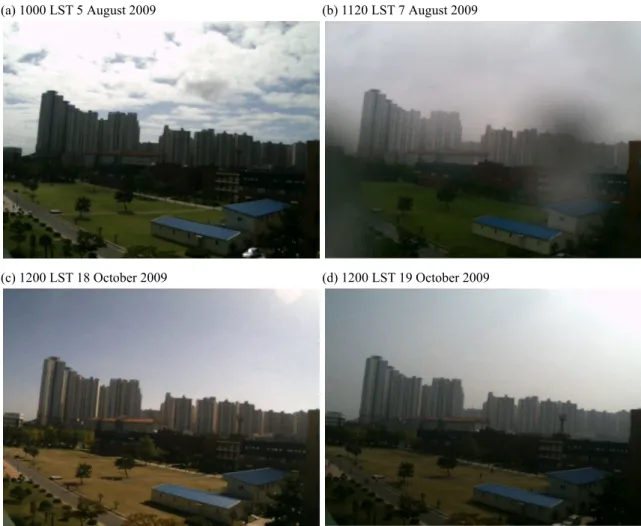
(a) 1000 LST 5 August 2009 (b) 1120 LST 7 August 2009
(c) 1200 LST 18 October 2009 (d) 1200 LST 19 October 2009
Fig. 6. Variable weather conditions. Cloudy (a), cloudy and rain (b), clear (c) and haze and dust (d) for 1100 LST 5 August, 1120 LST 7 August, 1200 LST 18 October and 1200 LST 19 October, 2009, respectively.
meteorological element selected in the chart page of OPeNDAP can be plotted by users as shown in this figure.
To evaluate monitored information collected by this experiment has been compared with difference cases of weather condition and sites of observation in terms of possibility of eye observation and dependency of observation site (Fig 6 and Fig 7, respectively). Fig. 6 shows the example images of variable weather conditions obtained by this system. The figures indicate the four different weather types at 1000 LST 5 August, 1120 LST 7 August, 1200 LST 18 October and 1200 LST 19 October, 2009, respectively. The scattered cloud in the sky monitored has been shown in Fig. 6(a). Fig. 6(b) shows gray cloud and rain deduced by spots over camera.
Heavy rain with thunder was recorded by KMA on 7 August, 2009. Fig. 6(c) shows clear sky and good visibility. But after 24 hours (Fig. 6(d)) it was hazy and dust was observed.
Diurnal variation of weather elements has been shown in Fig. 6(c, d) and compared with the four observations in Fig. 7 to evaluate continuous time-dependence weather change based on observation. The temperature recorded by the AWS and PKNU-FSs is for the period from 0000 LST 18 October 2009 and 2350 LST 19 October 2009.
The red line denotes the actual temperature in degrees Celsius (
oC) recorded every 10 min. The blue, orange, green and pink lines indicate observed temperatures by PKNU-FS1, PKNU-FS2, PKNU-FS3 and PKNU-FS4, respectively. The observed value given by PKNU-FSs represents the variation in temperature. The observed temperature at PKNU-FS1 was relatively low compared to that recorded by the other PKNU-FSs even through it is installed on the roof of the tallest building. The observation recorded at PKNU-FS1 which is located at coastal side might have been affected by the strong sea breeze on clear day. There are also considerable high temperatures, about 2 and 8
oC of PKNU-FSs compared to those recorded by AWS. The difference of temperature may be due to the effect of heating by conduction above the concrete building as solar energy strikes the surface each morning. On 19 October the atmosphere was hazy and dust was observed when light winds prevailed.
5. Conclusions
The weather monitoring system using PKNU-FS
based on IP-USN, data collecting and distributing system
have been constructed for observation of natural weather
Fig. 7. Comparison of air temperature given by Automatic Weather System (AWS) and PKNU‐FS1 to FS4 for the period from 0000 LST 18 October and 2350 LST 19 October 2009. The red line denotes actual temperature in degrees Celsius (oC) per 10 minutes. The blue, orange, green and pink lines indicate observed temperatures by PKNU‐FS1, PKNU‐FS2, PKNU‐FS3 and PKNU‐FS4, respectively.160 Prototype for the Weather Monitoring System with Web - Based Data Management - Construction and Operation
change. This system was successfully developed and the digital meteorological data and visual data have been obtained by using the weather monitoring system with web-based data management during the period July to December 2009. The images captured by the network camera every 10 minutes have shown informative eye observations such as rainy, cloudy, hazy and clear days through web browser. This indicates that this system was capable of monitoring the changes in weather which took place in a very short period of a few minutes to a long period of several days or even more. The difference of temperature and temperature lag given by weather monitoring system at four different sites located at coastal area existed due to the effect of heating by conduction and wind. All observation sites in this research project were around one AWS site. This indicates the importance of the locations of the sites of the instruments. Therefore, the weather monitoring system with web-based data management is quite useful in monitoring and recording different atmospheric phenomena even though it is in the infant stage. Further improvement is possible with the next generation technology.
Acknowledgements
The research was funded by the Korea Meteorological Administration Research and Development Program under grant CATER (Center for ATmospheric sciences and Earthquake Research) 2006-1101. The first and second authors were financially supported by the second stage of BK21 Project. Thanks to Mr. Kyoung-Min Lee for providing the initiative help of FS installation.
REFERENCES
Chang, K.-B., I.-J. Shim, S.-W. Shin, and G.-T. Park, 2005:
Meteorological Phenomena Measurement System Using the Wireless Network. Lect. Notes Comput. Sci., 3681, 861-865.
Estrin, D., W. Michener, and G. Bonito, 2003: Environmental
Cyberinfrastructure Needs for Distributed Sensor Networks.
A Report from a National Science Foundation Sponsored Workshop, Scripps Institute of Oceanography. 60 pp.
Fukatsu, T., and M. Hirafuji, 2005: Field Monitoring Using Sensor-Nodes with a Web Server. J. Robot. Mechatron., 17(2), 164-172.
______, ______, and T. Kiura, 2006: Agent System for Operating Web-Based Sensor Nodes via the Internet. J.
Robot. Mechatron., 18(2), 186-194.
Hart, J. K., and K. Martinez, 2006: Environmental Sensor Network: a revolution in the earth system science?, Earth Sci. Rev., 78, 177-191.
Hiraguji, M., T. Fukatsu, and H. Haoming, 2004: Full- Wireless Field Monitoring Server for Advanced Sensor- network. Proc. of AFITA/WCCA Joint Congress on IT in Agriculture, 692-697.
Honda, K., A. Shrestha, A. Witayangkurn, R. Chinnacholdteeranun, and H. Shimanura, 2009: Fieldservers and Sensor Service Grid as Real-time Monitoring Infrastructure for Ubiquitous Sensor Networks. Sensors, 9, 2363-2370.
Joo, H.-D., M.-J. Lee, and I.-H. Ham, 2005: The Characteristics of Air Temperature according to the Location of Automatic Weather System. Atmosphere, 15, 179-186. (in Korean) Kiura, T., T. Fukatsu, and M. Hirafuji, 2002: Field Server
Gateway: Gateway Box for Field Monitoring Servers.
Proc. of the 3rd Asian Conference for Information Technology in Agriculture, 410-413.
Oh, J-H, 2005: Atmospheric Science and e-Science. Phys.
High Technol., 14(10), 30-35. (in Korean)
Samuelson, P. 2003: Preserving the Positive Functions of the Public Domain in Science. Data Sci. J., 2, 192-197.
Sgouros, T. 2004: OPeNDAP User Guide V1.14 Internal draft documentation (http://www.opendap.org/user/guide- html/guide.html).
Shin, S. B., K. H. Kim, and H. J. Yeh, 2008: USN Testbed;
Technique and Testbed Trend and Practival Usage Plan.
Korean Assoc. Inf. Soc., 14, 55-84. (in Korean) Suri, A., S. S. Iyengar, and E. Cho, 2006: Ecoinfomatics
using wireless sensor networks; An overview. Ecol.
Inform., 1, 287-293.
Walter, K., and E. Nash, 2009: Coupling Wireless Sensor Networks and the Sensor Observation Service-Bridging the Interoperability Gap. 12th AGILE International Conference on Geographic Information Science, Germany, 1-9.
World Meteorological Organization, 1992a: International Meteorological Vocabulary. WMO-No. 182, Geneva.
784 pp.