JDCS
Journal of Digital Contents Society Vol. 19, No. 4, pp. 789-799, Apr. 2018스마트 팩토리 모니터링을 위한 빅 데이터의 LSTM 기반 이상 탐지
Van Quan Nguyen · Linh Van Ma · 김 진 술* 전남대학교 전자컴퓨터공학과
LSTM-based Anomaly Detection on Big Data for Smart Factory Monitoring
Van Quan Nguyen · Linh Van Ma· Jinsul Kim*
School of Electronics and Computer Engineering, Chonnam National University, Gwangju, 61186, South Korea
[요 약]
이 논문에서는 이러한 산업 단지 시스템에서의 비정상적인 동작이 일어날 때, 시간 계열의 데이터를 분석하기 위하여 Big 데이 터를 이용한 접근을 기반으로 하는 머신 러닝을 보여줍니다. Long Short-Term Memory (LSTM) 네트워크는 향상된 RNN버전으로 서 입증되었으며 많은 작업에 유용한 도움이 되었습니다. 이 LSTM 기반 모델은 시간적 패턴뿐만 아니라 더 높은 레벨의 시간적 특 징을 학습 한 다음, 미래의 데이터를 예측하기 위해 예측 단계에 사용됩니다. 예측 오차는 예측 인자에 의해 예측 된 결과와 실제 예 상되는 값의 차이입니다. 오차 분포 추정 모델은 가우스 분포를 사용하여 관찰 스코어의 이상을 계산합니다. 이러한 방식으로, 우 리는 하나의 비정상적 데이터의 개념에서 집단적인 비정상적 데이터 개념으로 바뀌어 갑니다. 이 작업은 실패를 최소화하고 제조 품질을 향상시키는 Smart Factory의 모니터링 및 관리를 지원할 수 있습니다.
[Abstract]
This article presents machine learning based approach on Big data to analyzing time series data for anomaly detection in such industrial complex system. Long Short-Term Memory (LSTM) network have been demonstrated to be improved version of RNN and have become a useful aid for many tasks. This LSTM based model learn the higher level temporal features as well as temporal pattern, then such predictor is used to prediction stage to estimate future data. The prediction error is the difference between predicted output made by predictor and actual in-coming values. An error-distribution estimation model is built using a Gaussian distribution to calculate the anomaly in the score of the observation. In this manner, we move from the concept of a single anomaly to the idea of the collective anomaly. This work can assist the monitoring and management of Smart Factory in minimizing failure and improving manufacturing quality.
색인어 : Long Short-Term Memory (LSTM), 이상탐지, SCADA
Key word : Long Short-Term Memory (LSTM), Anomaly Detection, SCADA
http://dx.doi.org/10.9728/dcs.2018.19.4.789
This is an Open Access article distributed under the terms of the Creative Commons Attribution Non-CommercialLicense(http://creativecommons .org/licenses/by-nc/3.0/) which permits unrestricted non-commercial use, distribution, and reproduction in any medium, provided the original work is properly cited.
Received 10 April 2018; Revised 18 April 2018 Accepted 25 April 2018
*Corresponding Author; Jinsul Kim Tel: +82-62-530-1808
E-mail: [email protected]
Ⅰ. Introduction
To take advantages of the rapid development of information technology, electric and electronic technology along with advanced manufacturing technology, the government has been investigating resource to transfer production mode of manufacturing enterprises from digital to intelligent as the name of Industry 4.0 [1]. This circumstance leads to the predominant on complex systems in which there are hundreds to thousands of industrial components, sub-systems working together in complicated connections. As the results, the quantity of monitored data coming from industrial processes, smart factories have been increasing day by day [2]. This requires an intelligent system for management operator to mentally process these collected data in order to discover event or operation state of whole components in a factory. The utilization of Big Data combined with Operation Technology strategies is currently revealing business insights that include transformational process, asset health, energy, safety, regulatory and quality improvements. One of the most significant challenges, as faced with big data analytics, is collecting data in scalable, reliable and consistent manner. We introduce the big data framework Hadoop come up with available tools to support for streaming, storage, and query in the next section.
Recently, the industrial processes are supervised in Supervisory Control and Data Acquisition (SCADA) systems that based on computers, networked data communications and graphical user interfaces for high-level process supervisory management, they are becoming more complex [2]. This makes the process of making the proper decision in the real-time very difficult and more challenging. Many manufacturing systems integrated SCADA systems that use sensors for streaming of big data over the years. These datasets contain useful clues and information about the state of such systems. Thus, we should efficiently utilize this source for monitoring system and real-time anomaly identification and detection [3]. Several examples of use Control and Data Acquisition (SCADA) systems on demand of continuously monitoring and controlling are the industrial processes, power industry, water distribution and oil refineries. Many of them control nations’ critical components, like nuclear power generation, public transport, wastewater plants and so on [4]. We prove that the management and maintenance of smart systems are tricky, so we need an efficiency procedure covering the real-time information transferring, analysis and decision-making framework with potential support from big data analytics. Such mention is the primary objective of this paper that aims at making an anomaly
identification and timely alarming. Moreover, we would like to use modern machine learning technologies in order to generate the knowledge about anomaly happened in the system to announce a warning/alarm instantly. In other words, we are trying to automate the analysis real-time/ near real-time of situations.
For this problem, objective investigated are driven by time, usage machine learning based approach to deal with sequence data make sense. As keep in mind, the machine learning (ML) should be one of the core parts of modern industrial information and control system [2]. This researching work will explore implicit information about degradation state of the sub-system in complex systems and identify anomaly event during operation, to enable real-time maintenance planning programs [5]. The real-time maintenance is very useful in cost savings and increasing availability of the facilities. In the real-world, mechanical devices such engines, industrial sub-system, operable component are typically instrumented by the various physical sensor to recorded the behavior and state of objectives. Based on monitoring signal, the expert can determine the current state and how healthy they are. For example, we analyze the signal from sensor built-in smart factory to recognize that what is going wrong, need to be replaced and repaired. For monitoring status during operation, we would like to be able to discriminate between the normal and anomalous status of a considered system [1]. Generally, anomaly detection is the identity of data points, pattern, observations or events that do not conform to the desired pattern of a given dataset. The usage anomaly detection system is very helpful in behavior analysis or support for other kinds of analysis like detection, identification, and prediction of the occurrence of these anomalies. However, the normal data is not always available for comparing with normal data in many situations, so detecting anomaly based on normal signal has become challenging. In our method, detecting anomalies is performed using predictor model.
Because of expected to reduce the unplanned failures in the smart factory through anomaly detection, immediately repair, system maintaining, we have to know pre-knowledge of the components' behaviors in the normal situation, and then the abnormal state should be identified. Hence, a framework for integrating machine learning based big data analytics is a destination. Moreover, issue of real-time anomaly detection for complex systems will be presented. This will be achieved using the future values, the output of the prediction model. The predictor is modeled with the input data be source/control components’ degradation information from history SCADA sensor data in a database. The successful implementation of the proposed framework will make maintenance planning, inspection
and repairs quicker, and at a reduced cost, due to the elimination of downtimes arising from unplanned maintenance schedules [3].
The rest of the paper is configured as follows: Section 2 briefly introduces the background of Hadoop framework, Machine Learning in Big Data and literature of machine learning based anomaly methods. Section 3 focuses on proposed framework, designing LSTM architecture as a predictor for anomaly detection event, how to train model offline and deploying online anomaly detection algorithm. Then, that different data from several domains are applied to investigate performance is the main content of Section 4. Finally, in section 5, we conclude and discuss future work.
Ⅱ. Related Works
From above discussion, it is necessary to integrate big-data analytics techniques for real-time monitoring, anomaly detection on SCADA based system. In this section, we first introduce the concept of big data platform, which plays an essential role in the general system. Next is of how to use Machine Learning techniques in big data. Last, we give a background of machine learning techniques in learning time series data and its applications in case of anomaly detection.
2-1 Big Data framework
In industrial operations, it is very important to recognize that the volume and frequency of data are hugely different to typical business feeds since the number of sensors for an operation can run in the millions and there’s a need for long-term archival, indexing and reporting. Hadoop framework currently is becoming the best option for big data analysis as well as distributed data, streaming data. Hadoop ecosystem is an excellent choice for our work since it can play with distributed big data. [6] Hadoop Ecosystem is framework includes both official Apache open source project and a various commercial tools and components which have proficient advantage in solving problems in case of big data situation. Maybe, each component was developed with separate architecture for their aims; however, what keeps them all together under a single roof is that they all derive their functionalities from the scalability and power of Hadoop. Hadoop Ecosystem composes four different layers: data storage, data processing, data access, or data management. As above diagram, Hadoop framework includes different modules like MapReduce [7], Yarn, Flume [8], Hive [9], Pig, Sqoop, Oozie, Zookeeper, HBase for different functionality. Depend on the application on Hadoop
cluster, we can use this one or the other for meeting requirement. Example for, Hive is a SQL dialect and Pig is a data flow language for that hide the tedium of creating MapReduce jobs behind higher-level abstractions more appropriate for user target. HBase is a NoSQL column-oriented database management system that runs on top of HDFS. Sqoop is used to transfer data between relational databases and Hadoop. Also, we use additional Zeppelin [10] as a collaborative data analytics and visualization tool for distributed, general-purpose data processing system.
2-2 Machine Learning on Big data
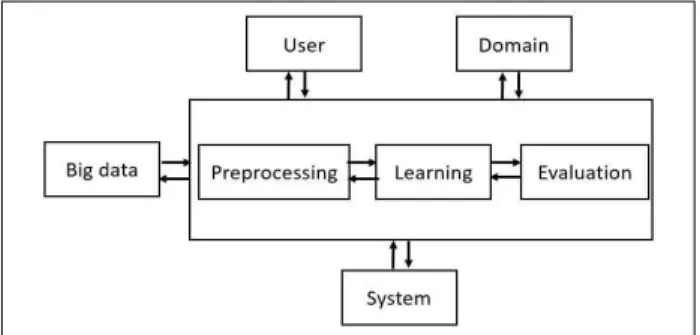
Machine learning (ML) continuously demonstrate its power in various applications about the learning ability. And [11] state that big data enables ML algorithms to discover more fine-grained patterns and perform more timely and accurate than ever before. This study also introduces a framework of Machine Learning on big data as shown in Fig.1. It contains four interactive, different components including big data, user, domain, and system. In short, big data will provide training data for training stage which generate output model or meaning information, this information can return to become a part of big data. Besides, the user can feedback or interact with ML by providing domain knowledge, personal preferences and response [11] to leverage performance. While domain can serve both as a source of knowledge to guide ML and as the context of applying learned models; system architecture has an impact on how learning algorithms should run and how efficient it is to run them, and simultaneously meeting ML may lead to a co-design of system architecture.
그림 1. 빅 데이터 환경에 기계 학습을 사용하는 프레임 워크 Fig. 1. A framework of using machine learning on big data
environment
ML is the process that reveals how to build a computer system that improves automatically through experience [12].
Three main parts are going through data preprocessing step, learning model, and evaluation phases. Preprocessing block is
responsible for preparing raw data into filtered data, structured format for next steps. Transformation of such data into a form that can be used as inputs to learning via cleaning, extraction feature, and fusion is made by preprocessing step. The learning block mainly focuses on selecting learning algorithms and tunes model parameters to obtain expected model. The performance of the trained model is evaluated through evaluation step before being used in practical application.
2-3 Machine Learning based Anomaly detection
Recently, deep neural network-based learning is the hot trend and becomes one of the fastest growing and most exciting areas of Machine Learning, especially cooperating with big data to discover hidden information. Similar to operation manner of biological neural, Neural networks are a family of models that consist of interconnected neurons whose connections can be tuned and adapted to inputs. Deep neural networks refer neural networks with many hidden layers, or deep-layered architecture to enhance the high-level feature learning capacity, each layer can apply a nonlinear transformation from the output of the previous layer to get output [11], and also be the input of the next layer. Sensor data from industrial factories are the typical instances of time series data. We need analyze hidden information behind them to understand the behavior of sequence pattern and determine outlier pattern considered as anomalous patterns. Traditional anomaly detection method usually based on statistical measure, in which, we have to identify irregularities in given data to flag data point that deviate from common statistical properties of distribution, including mean, median, mode, and quantities [13]. Since features come from special unit “memory cell” [14] LSTM neural network is also utilized to overcome the vanish gradient problem that is experienced by Recurrent Neural Network (RNN). LSTM networks are improved version of Recurrent Neural Network (RNN) [15] that have been used for many sequences earning tasks due to the capacity of learning long-term dependencies. [16] proposed an unsupervised approach for detect anomalies at the collective level. This probabilistically aggregates the contribution of the individual anomalies for detecting significantly anomalous groups.
Because of the collective anomalous score using an unsupervised manner, both unsupervised and supervised approaches can be used for scoring individual anomaly. The proposed model was evaluated on moving crane and fuel consumption dataset. On acoustic novelty detection, [17]
presented a novel approach based on non-linear predictive denoising autoencoders (DA) with LSTM for isolating
abnormal acoustic signals. Long-Short Term Memory (LSTM) recurrent denoising autoencoders predict the auditory spectral features of the next short-term frame based on the previous frames. The reconstruction error between the input and the output of the autoencoder play role as an activation signal to detect novel. In [14], Malhotra et al. used LSTM network to detect anomaly on time series data. The stacked LSTM network trained on only normal data to generate predictor over some time steps. The distributed probability of error signal was estimated and was used to assess the likelihood of anomaly score. We can solve anomaly by LSTM based classifier on two classes including normal label and anomalous one. In fact, recording anomalous data is costly or even make the situation dangerous out of the control. The balance between training classes does not ensure. From the idea of [14] and window based method using adaptive error measure [18] for the particular application, in this work, we use LSTM for building a prediction model for anomaly system is the better choice. This anomaly function can be integrated to supervisory control and data acquisition (SCADA) [19] based factory system in which sensor data are gathered from industrial devices to analyze and discover information as well as visualization or alarm via SCADA or dashboard website.
Ⅲ. System Overview 3-1 Overview Framework
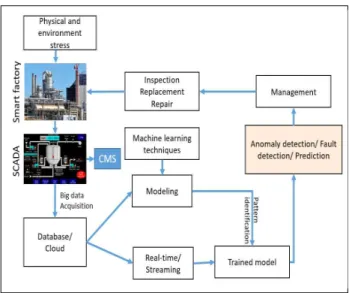
The Fig.2 is proposed framework for real-time anomaly detection integrated into the smart industrial factory. Under physical and environmental stress, the anomaly can happen in any part of manufacture system. In order to maintain manufacture system efficiency, process data for smarter decisions and mitigate downtime SCADA systems have become crucial for the industrial organization. They help to control industrial processes both local and remote location. As shown in the diagram, SCADA block directly interacts with devices such as sensors, valves, pumps, motors to monitor, gather, record event into a database as well as support for processing real-time data. Interaction can perform through human-machine interface (HMI) software. In the experiment, we use a solution for visualization event from the database.
This framework also has machine learning based anomaly detection on big data coming from a smart factory (signal send from all components through built-in Condition Monitoring Sensor (CMS)), and then these sensor data are stored into the structure database or unstructured data for big data/ cloud.
그림 2. 스마트 팩토리의 빅 데이터에 기반한 기계 학습 기반의 프레임 워크
Fig. 2. A framework of machine learning based anomaly detection on big data of smart factory
Processing of these data is vital for the prediction of the future state of the components, which is done by using different models belong to machine learning techniques to model data.
We will describe more details on our machine learning based approach in the later. When obtaining the model, we use to apply the model to prediction procedure, anomaly detection algorithm or release warning announcement to the human operator for immediately repair solution. In the smart factory, it must be equipped a CCTV (Closed-circuit television) system assisting an administrator to manage the factory efficiently.
When an anomaly is detected, an automation program via SCADA can activate multi cameras at the location where the anomaly occurs. For high-quality streaming video, the smart factory may be supplied multiview camera system with the advanced technologies such as Multiview Video Coding (MVC). The technique assembles views from multi-camera to form an overview of the anomaly location to support an appropriate reaction. In case, we want to monitor factory from far distant, Mobile Edge Computing (MEC) will be a solution for intelligent manufacturing. MEC enable manufacturers to utilize big data, generated by machines, into insightful and actionable data. More specifically, MEC acts as an intermediate between the control center and the smart factory. For example, the surveillance video is recorded with ultra-high-quality (4K) which cannot be transmitted efficiently to the control center.
MEC support encoding/decoding between the two locations.
Especially, MEC can reduce latency which is crucial in the real-time SCADA system.
3-2 Long Short Term Memory Network
Recurrent Neural Network (RNN) was known as a class of Artificial Neural Network where the connection between cell units (annotation as A) create a directed graph along a sequence. This structure helps it to be power for handling temporal behavior for time series data instead of static input data only. Because of the ability to remember relevant events over time, RNN makes itself more dynamic than conventional feed-forward networks. We image that such network is with the loop structure in them, it allows information to persist along the timeline as illustrated in Fig. 3.
그림 3. 펼쳐진 RRN
Fig. 3. An unrolled recurrent neural network
We saw that the applications of Recurrent Neural Network such as time series prediction, musical rhythm detection, speech recognition, language model, machine translation become popular. However, many practical problems with long time lags between relevant information make learning in RNNs difficult.
Rapid decay of backpropagated error is the major reason for this problem. That is why we consider Long-Short Term Memory network is as a special version of RNN, which play the role as a solution by enforcing error constant flow. Almost all exciting results based on recurrent neural networks are achieved come from LSTM, as a special kind of recurrent neural network which works, for many tasks, much better than the standard version. Therefore, we will explore LSTMs in the next section and how it used in anomaly detection task.
Originally, Recurrent Neural Networks can have long-term memory refer to information transmission from the previous cell to current cells. Therefore, an extended model called Long Short-Term Memory [15] will inherit such nature feature;
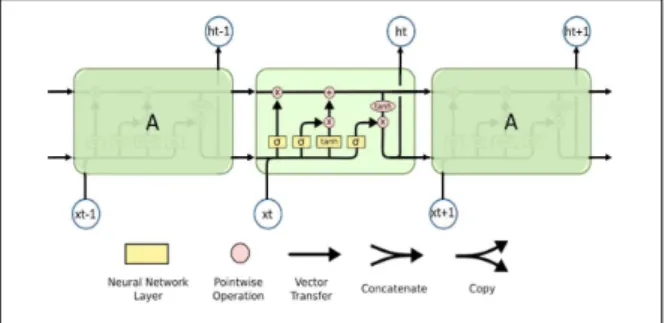
moreover, it is capable of handling long time sequence. Like standard RNNs, LSTMs also have this chain like structure with repeating modules, but the repeating module has a different inside structure. Instead of having a single neural network layer only, it contains four layers, interacting in special procedure [20] as depicted in Fig. 4.
그림 4. LSTM 세포
Fig. 4. Long Short Term Memory cells
There are several architectures of LSTM cell units, but a general architecture is under control of on/off state of a memory cell, an input gate, an output gate and a forget gate. The option of remove or add information to the cell state depends on the operation of structures called gates, which run on the signals they receive. The LSTM gates often use logistic functions to compute an activation. Intuitively, the input gate controls the extent to which a new value flows into the cell, the forget gate controls the extent to which a value remains in the cell, and the output gate controls the extent to which the value in the cell is used to compute the output activation of the LSTM unit. As the idea of neural network’s nodes, gates structure block or pass on information with their own sets of weights. Those weights, like the weights that modulate input and hidden states, are adjusted through the recurrent networks learning the process. The learning iterative process of making guesses, back propagating error, and adjusting weights are still based on gradient descent.
3-3 LSTM based approach for anomaly detection
We use LSTM-RNN as sequence prediction model which feeds input data underlying time series form. In this study, the trained model is used to estimate the distribution of prediction error. The prediction error model verifies the likelihood of anomaly behavior. Our method overcomes some limitations coming from many situations with not enough anomalous data.
Whole flow work of identification of anomaly is as Fig. 5.
그림 5. 이상 탐지의 흐름 작업
Fig. 5. Flow work of anomaly detection
Assuming that we get a time-series data
with a length of L where each sample
∈ is an m-dimensional vector at time instance i. We
trained a predictor f with learned parameters denoted as . The model predicts the next l values from N input samples. The equation of prediction problem is described as regression problem (3) (k is offset):
(3).
The function f may be any prediction method. In our case, we utilize Recurrent Neural Network (RNN) with LSTM architecture. In training phase, the prediction method adapts its parameters , which become the characteristic of the normal training [14]. In order to adapt a LSTM-RNN for time series data [18] introduced some term prediction errors such as Relative Error (RE), the Average Relative Error (ARE), Relative Error Threshold (RET), Minimum Attack Time (MAT) or Danger Coefficient (DC). We use absolution of difference
to estimate of the distribution of errors fitting a parametric multivariate Gaussian distribution ∑.For any point the anomaly scores are expressed as likelihood
of error vector the based on ∑. If ≺ the observation is classified as “anomaly candidate”, else
“normal candidate” is assigned. The threshold can learned by maximizing or pre-defined.
With a similar procedure from [14], the normal data are divided into four sets namely (normal training), (normal validation-1), (normal validation-2) and (normal test) while the anomalous time-series can be divided into two sets (anomaly validation) and (anomaly test).
The architecture is composed of three stacked LSTM layer with the number of LSTM cells {64, 256, 100} respectively as shown in Fig. 6, that followed by one fully connected layer. We also regularize between each layer with dropout operation 0.2 (20%). Besides, we can use a look-ahead step in the configuration of prediction more than one as the prediction accuracy still ensure. If it is not imperative, we should define look-ahead step equal to one. The normal training is used to learn the prediction models. We used Adam optimizer with the learning rate of 0.1. We also configured training script of 100 epochs with early stopping to get trained model for anomaly detection algorithm.
The normal validation-1 is used for early stopping during the training phase. The error vector calculated on the normal validation-1 time series are used to estimate and ∑ of Normal distribution using Maximum Likelihood Estimation (MLE) algorithm. The threshold is chosen with maximum
.
×
, (1)
where, P is precision, R is recall on the validate sequences in
and . We consider anomaly candidates belong to positive class and normal candidates belong to negative class. We consider anomaly candidates belong to positive class and normal candidates belong to negative class.
그림 6. 스택 된 LSTM 네트워크 아키텍처 Fig. 6. Stacked LSTM Network Architecture
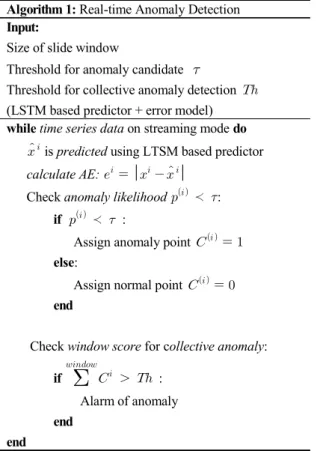
To detect an anomaly in real-time/streaming mode, we proposed a real-time anomaly detection algorithm to deal with the streaming data using classifier model, predictor model, and error model are already trained using historical data which are stored in data base. Based on the timing of training data, this is divided into the batch learning, entire training data are learned.
While online learning can be implemented to update the model based on each new input.
Algorithm 1: Real-time Anomaly Detection Input:
Size of slide window
Threshold for anomaly candidate
Threshold for collective anomaly detection (LSTM based predictor + error model) while time series data on streaming mode do is predicted using LTSM based predictor calculate AE:
Check anomaly likelihood ≺ :
if ≺ :
Assign anomaly point else:
Assign normal point end
Check window score for collective anomaly:
if
:Alarm of anomaly end
end
Algorithm 1 called “Real-time anomaly detection” use both prediction model and error-distribution model to detect temporal information of events. Before running real-time anomaly detection, LSTM-RNN based predictor model and error distribution model are trained as before discussed. For reducing cost computing, points are accumulated using window-based method (sliding window = time interval (∆T) or are averaged to be transformed to time series data. Some preprocessing can be implemented here. Next, the predictor that already learned normal data behavior could predict future signal using normal historical signal. To check how incoming signals fit to normal signals, absolute differences between actual signals and predicted signals are computed to estimate anomaly score through the error distribution model. From optimized threshold based on , we can determine anomaly candidate (anomaly point) before moving to collective anomaly detection.
Ⅳ. Experiments
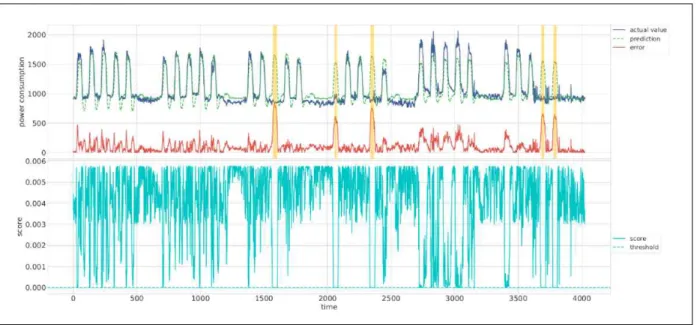
그림 7. 시계열 데이터의 이상 검출 (전력 소비 데이터)
Fig. 7. Anomaly detection on time series data (power consumption data)
그림 8. SCADA 기반 시각화를 통한 모니터링 Fig. 8. Monitoring via SCADA based visualization
The dataset we used for conducting experiment is power consumption within 52 weeks. Each sample data corresponds to every 15 minutes. So we have about 35040 data points totally.
To train necessary model for anomaly detection system, we
considered anomalies as weekdays that have low level on power consumption. Obviously, we notice that Saturday and Sunday are exception because of weekends. As previous procedure of training, we divided the given data into training dataset of 32 weeks, testing dataset of 6 weeks and the rest for validation dataset.
The LSTM model are implemented in Python with Tensorflow backend using Keras deep learning library. Graphic User Interface based on PyQt was designed for usage.
Hadoop-based architecture also is deployed with pseudo mode to run Hadoop MapReduce Programing in python script using Hapdoop Streaming API for real-time anomaly detection.
Beside, a data warehouse Hive is built on top of Hadoop to access/parse content Json file locating on HDFS storage.
For see performance of the result of anomaly detection system, as a result, we have output as shown in Fig. 7. The top plot shows the prediction done by predictor model (green dash), the corresponding prediction error is plotted in the form of the solid red line. The below plot is anomaly score and learned threshold. This threshold close to zero is used to assign if the sample is anomaly candidate or not. Anomaly point detection candidates are marked with orange color.
Finally, we use industrial automation software solution developed by Xisom [21] to visualize time series data, anomaly detection and query data from traditional SQL database for monitoring operation as in Fig. 8.
Ⅴ. Conclusion
From existing big data infrastructure of industry 4.0, this study introduces a big data-based framework for anomaly detection in the smart factory. Both benefits of big data and machine learning are utilized in industrial Supervisory Control and Data Acquisition (SCADA) based management systems to understand time series data. This overall architecture of our SCADA scenario, which is supported by proposed knowledge generation from deep learning. This design is different from what we can see in conventional commercial SCADA solutions on the traditional database. About anomaly detection, LSTM based predictor perfectly run on time series data to learn temporal signal feature that uses to detecting anomaly pattern.
This anomaly detection model is very potential for applying in different time series data from the industrial complex system (temperature, electric, water level, humidity, etc.). Currently, the necessary model was trained offline using normal data from database/cloud and apply for the real-time application. In future, we will research on online learning techniques and integrate more data mining, machine-learning based algorithm into a system, Mobile Edge Computing technique as well.
Acknowledgement
This work (Grants No. C0513295) was supported by Business for Cooperative R&D between Industry, Academy, and Research Institute funded Korea Small and Medium Business Administration in 2017. Also, this research was supported by Basic Science Research Program through the National Research Foundation of Korea (NRF) funded by the Ministry of Education, Science, and Technology (MEST)(Grant No. NRF-2017R1D1A1B03034429).
References
[1] B. Chen, J. Wan, L. Shu, P. Li, M. Mukherjee, and B. Yin,
“Smart Factory of Industry 4.0: Key Technologies, Application Case, and Challenges,” IEEE Access, Vol. 6, pp. 6505-6519, 2017.
[2] T. Skripcak and P. Tanuska, “Utilisation of on-line machine learning for SCADA system alarms forecasting,”
Proceedings of 2013 Science and Information Conference, SAI 2013, pp. 477-484, 2013.
[3] S. Mohanty, M. Jagadeesh, and H. Srivatsa, “ ‘Big Data’
warehouse, ‘BI’implementations and analytics,” Apress, 2013.
[4] I. Garitano, R. Uribeetxeberria and U. Zurutuza, “ A review of SCADA Anomaly Detection System,” Soft Computing Models in Industrial and Environmental Applications, 6th International Conference SOCO 2011, Vol. 87, 2011.
[5] M. Shafiee and M. Finkelstein, “An optimal age-based group maintenance policy for multi-unit degrading systems,” Reliability Engineering \& System Safety, Vol.
134, pp. 230-238, 2015.
[6] Kv, R. Satish, and N. P. Kavya, “Trend Analysis of E-Commerce Data using Hadoop Ecosystem,”
International Journal of Computer Applications, Vol. 147, No. 6, pp. 1-5, 2016.
[7] J. Dean and S. Ghemawat, “MapReduce: simplified data processing on large clusters,” Communication of ACM, Vol. 51, No. 1, pp. 107-113, 2008.
[8] Flume: http://flume.apache.org/
[9] Hive:https://hive.apache.org/
[10] Zeppelin: https://zeppelin.apache.org/docs/0.6.2/
[11] L. Zhou, S. Pan, J. Wang, and A. V. Vasilakos, “Machine learning on big data: Opportunities and challenges,”
Neurocomputing, Vol. 237, pp. 350-361, 2017.
[12] Jordan, I. Michael and M. M. Tom, “Machine learning:
Trends, perspectives, and prospects,” Science , Vol.349, No. 6245, pp. 255-260, 2015.
[13] V. Chandola, A. Banerjee, and V. Kumar, “Anomaly detection: A survey,” ACM Computing survey (CSUR), Vol. 41, No. 3, pp. 1-58, 2009.
[14] P. Malhotra, L. Vig, G. Shroff, and P. Agarwal, “Long short term memory networks for anomaly detection in time series,” Proceedings, pp. 89, 2015.
[15] S. Hochreiter and J. Urgen Schmidhuber, “Long Short-Term Memory,” Neural Computation, Vol. 9, No. 8, pp. 1735-1780, 1997.
[16] T. Olsson and A. Holst, “A Probabilistic Approach to Aggregating Anomalies for Unsupervised Anomaly Detection with Industrial Applications,” in FLAIRS Conference, pp. 434-439, 2015.
[17] E. Marchi, F. Vesperini, F. Weninger, F. Eyben, S.
Squartini, and B. Schuller, “Non-linear prediction with LSTM recurrent neural networks for acoustic novelty detection,” in Neural Networks (IJCNN), 2015 International Joint Conference, pp. 1-7, 2015.
[18] L. Bontemps, J. McDermott, N.-A. Le-Khac, and others,
“Collective anomaly detection based on long short-term memory recurrent neural networks,” in International Conference on Future Data and Security Engineering, pp.
141-152, 2016.
[19] S. D. Anton, D. Fraunholz, C. Lipps, F. Pohl, M.
Zimmermann, and H. D. Schotten, “Two decades of SCADA exploitation: A brief history,” in Application, Information and Network Security (AINS), 2017 IEEE Conference, pp. 98-104, 2017.
[20] Understanding LSTM Network [Internet]. Available:
http://colah.github.io/posts/2015-08-Understanding-LSTM s
[21] Xisom solution: http://www.xisom.com
Van Quan Nguyen
2014 : Hanoi University of Science and Technology, Vietnam (B.S. Degree).
2017 : Chonnam National University, South Korea (M.S Degree).
2014~2015: Researcher assistant at Advance Integrated Circuit System, HUST
2015~2018: School of Electronics and Computer Engineering - Smart Computing Laboratory.
2018~now: School of Electronics and Computer Engineering - Smart & Media Computing Laboratory.
※Research Interests : Mobile Cloud Computing, Machine Learning, Data Mining, Big Data
Linh Van Ma
2013 : Hanoi University of Science and Technology, Vietnam (B.S. Degree).
2017 : Chonnam National University, South Korea (M.S Degree).
2013~2015: Researcher and Developer at Samsung Vietnam Mobile R&D Center – SVMC.
2015~now: School of Electronics and Computer Engineering - Smart & Media Computing Laboratory.
※Research Interests : Mobile Cloud Computing, Next Generation of Mobile Platform, Mobile Operating System and Peer-to-Peer Network
김진술 (Jinsul Kim)
2001 : University of Utah, Salt Lake City, Utah, USA (B.S. Degree).
2005 : Korea Advanced Institute of Science and Technology (KAIST) (M.S Degree).
2008 : Korea Advanced Institute of Science and Technology (KAIST) (Ph.D Degree).
2005~2008: Researcher in IPTV Infrastructure Technology Research Laboratory, Broadcasting/Telecommunications Convergence Research Division, Electronics and Telecommunications Research Institute (ETRI).
2009~2011: Professor in Korea Nazarene University, Chon-an, Korea.
2011~now: Professor in Chonnam National University, Gwangju, Korea.
※Research Interests : QoS/QoE, Measurement/ Management, IPTV, Mobile IPTV, Smart TV, Multimedia Communication and Digital Media Arts.