INTRODUCTION
Head and neck squamous cell carcinoma(HNSCC) are neoplastic lesions found predominantly in the oral cavi- ty, including the salivary glands, larynx and pharynx1). It is the sixth most common cancer and with an estimated annual worldwide incidence of 500,000 cases2). Despite significant advances in treatment, the 5-year survival
rate of HNSCC is relatively lower than that of colorectal, cervix and breast cancer3). The high morbidity rate for this malignancy can be attributed to several factors, which include lack of suitable markers for early detec- tion, late presentation, insensitivity to available treat- ment and our limited understanding of the molecular mechanisms responsible for this malignancy4). In this regard, the identity of those genes that may have a role in the progression of HNSCC has yet to be fully elucidat- ed.
The National Cancer Institute(NCI) established The Cancer Genome Anatomy Project(CGAP), whose goal has been to compile a complete catalogue of all genes expressed in different tumor cells. CGAP’s sixth focus is about HNSCC5). CGAP generated sequence information
* Corresponding author Jung-Wan Kim
Departmant of Oral Microbiology
School of Dentistry, Kyungpook National University Samduck 2-Ga, 188-1, Jung-gu, Daegu, 700-412, Korea Tel: 82-53-660-6831 Fax: 82-53-422-6596
Use of Real-Time Quantitative PCR to Identify High Expressed Genes in Head and Neck Squamous Cell Carcinoma Cell Lines
Yong-Gyoo Lee1, So-Young Chun2, Hae-Ahm Lee2, Yoon-Kyung Sohn3, Ku-Seong Kang3, Joung-Ok Kim3, Sang-Mo Yun4, Jung-Wan Kim2, Hyun-Jung Jang1
1Department of Oral and Maxillofacial Surgery, School of Dentistry, 2Department of Oral Microbiology, School of Dentistry,
3Department of Pathology, School of Medicine, Kyungpook National University, Daegu, Korea
4Department of Therapeutic Radiology and Oncology, College of Medicine Yeungnam University, Daegu, Korea
Head and neck squamous cell carcinoma(HNSCC) is the sixth most common cancer among men in the developed world affecting the tongue, pharynx, larynx and oral cavity. HNSCC is thought to represent a multistep process whereby carcinogen exposure leads to genetic instability in the tissue and accumulation of specific genetic events, which result in dysregulation of proliferation, differentia- tion, and cell loss and the acquisition of invasive capacity. Despite therapeutic and diagnostic progress in oncology during the past decades, the prognosis of HNSCC remains poor. Thus it seems that finding a biological tumor markers which will increase the early diagnosis and treatment monitoring rates, is of paramount importance in respect to improving prognosis.
In an effort to identify gene expression signatures that may serve as biomarkers, this study several genes were selected, such as H3,3A, S100A7, UCHL1, GSTP1, PAI-2, PLK, TGFβ1 and bFGF, and used 7 HNSCC cell lines that were established various anatomical sites, and also 17 other cancer cell lines were used for control group using real-time quantitative RT-PCR and immunocytochemical analysis with a monoclonal antibody.
In this study, S100A7 showed a clearly restricted occurrence in tongue originated cell line, and GSTP1 expression level in the pharynx originated cell line was very increased, relative to corresponding other cell lines. These results suggest that S100A7 and GSTP1 genes’
expression can occur during tongue and pharynx originated head and neck tumorigenesis and that genetic change is an important dri- ving force in the carcinogenesis process. This data indicate that S100A7 and GSTP1 expression pattern in HNSCC reflect both diagnostic clue and biological marker. And this is provides a foundation for the development of site-specific diagnostic strategies and treatments for HNSCC.
Key words
Real-Time Quantitative PCR, HNSCC, S100A7, GSTP1, Immunocytochemical analysis Abstract
initially from representational cDNA libraries derived from HNSCC cell lines and primary oral keratinocytes, to gain information on the nature of those genes expressed in this particular cell type6). Among those genes, several candidate genes were selected for this study. The genes were H3 histone family S100A7, 3A(H3.3A), ubiquitin C-terminal hydrolase L1(UCHL1), glutathion S-transferase P1(GSTP1), plasminogen activa- tor inhibitor-2(PAI-2), polo-like kinase(PLK), transform- ing growth factorβ1(TGFβ1), and basic fibroblast growth factor(bFGF). These are thought to be positively related to HNSCC development.
This study applied gene expression through the Real- Time Quantitative PCR (RTQ-PCR) and immunocyto- chemical method to a group of 7 HNSCC cell lines and compared the genes expression to 6 gastric cancer cell lines, 5 lung cancer cell lines, 2 prostate cancer cell lines, 2 colon cancer cell lines, 1 kidney cancer cell line and 1 liver cancer cell line. This study’s aims are to obtain a comprehensive view of gene expression differences in HNSCC cell lines and other carcinoma cell lines and to identify gene expression and localization signatures that correlate with defined clinical parameters with the hope of identifying the unique prognostic gene expression- based biomarkers in HNSCC.
MATERIALS AND METHODS Cell lines and cell culture
Human head and neck squamous cancer cell lines (SCC-15, SCC-25, FaDu, RPMI 2650, CAL 27, SNU-1066 and SNU-1214), human gastric cancer cell lines (SNU-5, SNU-216, SNU-484, SNU-668, SNU-719 and MKN-74), human colon cancer cell lines (HT-29, HCT 116), human lung cancer cell lines (A549, H157, H358, H1299, H1703), human kidney cancer cell line (ACHN), human prostate cancer cell lines (DU 145, PC-3), and human liver cancer cell line (HepG2) were obtained from Korean Cell Line Bank (KCLB) and American Type Culture Collection (ATCC) (Table 1).
SNU-5, SNU-216, SNU-484, SNU-668, SNU-719, SNU- 1066, SNU-1214, A549, H157, H358, H1299, H1703, MKN74 and PC3 were grown in RPMI1640 medium (Gibco/BRL), SCC-15 and SCC-25 were grown in DMEM/F-12 medium (Gibco/BRL), FaDu, ACHN, DU145, HepG2 and RPMI2650 were grown in MEM
medium (Gibco/BRL), CAL27 was grown in DMEM medium (Gibco/BRL), HT-29 and HCT 116 were grown in McCoy’s 5a medium (Gibco/BRL) in a humidified atmosphere containing 5% CO2 at 37℃. All of these mediums were supplemented with 10% of heat-inactivat- ed fetal bovine serum.
RNA extraction and cDNA preparation
Total RNA was extracted with Trizol (Invitrogen, Carlsbad, CA) according to the manufacture’s instruc- tions. RNA was resuspended in diethylpyrocarbonate- treated water and was quantitated by spectrophotome- ter. Purified 5 ㎍ RNA was reverse transcribed with the First Strand cDNA Synthesis Kit (MBI Fermentas) using Oligo(dT)18 primers and M-MuLV reverse transcriptase in a 20 ㎕ reaction volume.
Table 1.Primary sites and tumor sources of cell lines Cell lines Primary site Gen/Age, Race
SCC-15 tongue M/55
SCC-25 tongue M/70
FaDu pharynx M/56, Caucasian
CAL 27 tongue M/56, Caucasian RPMI 2650 nasal septum M/52
SNU-1066 larynx, glottic M/62, Mongoloid SNU-1214 larynx, glottic M/55, Mongoloid SNU-5 stomach F/33, Mongoloid SNU-216 stomach F/46, Mongoloid SNU-484 stomach M/53, Mongoloid SNU-668 stomach M/63, Mongoloid SNU-719 stomach M/53, Mongoloid
MKN-74 stomach M/37, Mongoloid
A549 lung M/58, Caucasian
H157 lung H358 lung H1299 lung H1703 lung
HT-29 colon F/44, Caucasian
HCT 116 colon M
ACHN kidney M/22, Caucasian DU 145 prostate M/69, Caucasian PC-3 prostate M/62, Caucasian HepG2 liver
Primer design
The PCR primers were designed with the use of Primer Express 1.5 (Applied Biosystems). Each gene sequence was designed to produce approximately 100-bp ampli- con. Primer sequences for amplification of S100A7, GSTP1, H3.3A, UCHL1, PAI-2, PLK, TGFβ1, bFGF and GAPDH by RTQ-PCR were listed in Table 2.
Real-Time Quantitative PCR (RTQ-PCR)
RTQ-PCR assays were carried out by using ABI Prism Sequence Detection System 7000 (PE Biosystems) with SYBR Green PCR Master Mix (Applied Biosystems, war- rington, UK). RTQ-PCR amplification was performed in 20 ㎕ of reaction mixture containing 5 ㎕ of cDNA sam- ples, 10 ㎕ of SYBR Green PCR Master Mix and 200 nM specific primer sets. cDNA samples and primers were diluted 10 fold. The thermal cycling conditions com- prised two initial denaturation steps at 50℃ for 2 min and 95℃ for 10 min and 50 cycles at 95℃ for 15 sec and 60℃ for 1 min. All samples were measured in triplicate.
A nontemplate control was included in each experiment.
To ensure that amplifiable material was present in all of the cell lines and to avoid false-negative results, real-time amplification of housekeeping gene GAPDH was per-
formed for all of the samples. Dissociation curve analysis was performed at the end of 50 cycles to verify PCR product identity. The cycle threshold values of all sam- ples were measured by the same machine. The final PCR products were run on 2% minigel to ensure single prod- uct amplification during the PCR assay.
Relative quantitation using the comparative Ct method
The comparative Ct method is similar to the standard curve method, except it uses arithmetic formulas to achieve the same result for relative quantitation.
Quantitative values were obtained from the cycle num- ber (Ct value) at which the increase in fluorescent signal associated with exponential growth of the PCR products.
GAPDH was chosen for the housekeeping gene.
Expressed as N-fold differences in target gene expression relative to the GAPDH gene, termed ‘Ntarget’, were deter- mined by the formula Ntarget= 2-△△Ct sample, where the △Ct value of the sample was determined by subtracting the Ct value of the target gene from the average Ct value of the GAPDH gene. The calculation of △△Ct involves subtraction by the △Ct calibrator value. The Ntarget values of the samples were subsequently normalized such that the mean of the Ntargetvalues of the control populations equal 1.
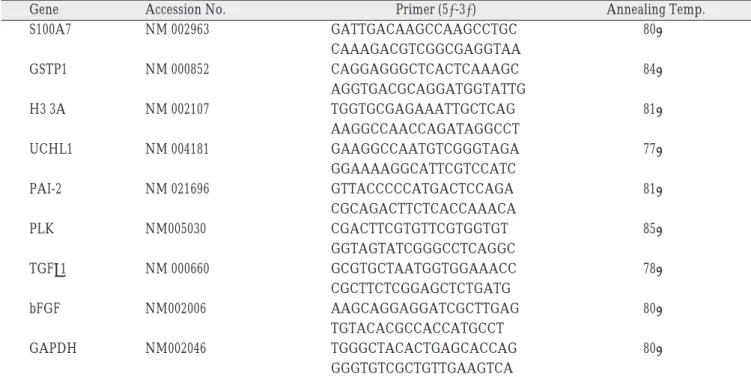
Table 2.Primers for RTQ-PCR
Gene Accession No. Primer (5’-3’) Annealing Temp.
S100A7 NM 002963 GATTGACAAGCCAAGCCTGC 80℃
CAAAGACGTCGGCGAGGTAA
GSTP1 NM 000852 CAGGAGGGCTCACTCAAAGC 84℃
AGGTGACGCAGGATGGTATTG
H3 3A NM 002107 TGGTGCGAGAAATTGCTCAG 81℃
AAGGCCAACCAGATAGGCCT
UCHL1 NM 004181 GAAGGCCAATGTCGGGTAGA 77℃
GGAAAAGGCATTCGTCCATC
PAI-2 NM 021696 GTTACCCCCATGACTCCAGA 81℃
CGCAGACTTCTCACCAAACA
PLK NM005030 CGACTTCGTGTTCGTGGTGT 85℃
GGTAGTATCGGGCCTCAGGC
TGFβ1 NM 000660 GCGTGCTAATGGTGGAAACC 78℃
CGCTTCTCGGAGCTCTGATG
bFGF NM002006 AAGCAGGAGGATCGCTTGAG 80℃
TGTACACGCCACCATGCCT
GAPDH NM002046 TGGGCTACACTGAGCACCAG 80℃
GGGTGTCGCTGTTGAAGTCA
Immunocytochemistry
Cells were fixed for 20 min at room temperature in 2%
Bax and permeabilized in 0.1% Triton-100 for 2 min.
After a rinse in phosphate-buffered saline (PBS), cells were incubated for 1 hr with primary S100A7 monoclon- al antibody (1:100 dilution, imgenex). After rinsing 3x5 min in PBS, cells were incubated with the secondary anti- body (1:150 dilution, goat anti-mouse), for 40 min at room temperature and countstaining with SYTOX green, followed by dehydration, clearing and mounting.
Stained cells were examined under a Nikon-Diaphot inverted microscope.
Statistical analysis
All determinations were made in triplicate, and the results were expressed as the mean standard deviation (S.D.). Statistical significance was determined by ANalysis Of VAriance (ANOVA) Duncan test. P values of 0.05 or less were considered significant.
RESULT
Relative quantitation of gene expression
Analysis of the gene expression patterns of HNSCC cell lines and other tumor cell lines has revealed S100A7 and
Table 3.Relative quantitation in S100A7 mRNA using the comparative(△△ Ct) method
Cell line △Ct △△Ct S100A7
S100A7-GAPDHa △Ct-△Ct, SNU668b Rel.to SNU668c
SCC15 2.16 20.3 1290948
SCC25 6 16.46 90148
FaDu 10.21 12.25 4871
RPMI2650 17.33 5.13 35
CAL27 1.72 20.24 1751306
SNU1066 7.74 14.72 26987
SNU1214 6.83 15.63 50711
SNU5 17.87 4.59 24
SNU216 14.8 7.66 202
SNU668 22.46 0.0 1
MKN74 13.76 8.7 416
SNU484 17.87 4.59 24
SNU719 13.63 8.83 455
A549 14.11 8.35 326
H157 15.05 7.41 170
H358 13.13 9.33 644
H1299 18.95 3.51 11
H1703 22.33 0.13 1
DU145 12.6 9.86 929
PC3 14.29 8.17 288
HT29 15.8 6.66 101
HCT116 15.39 7.07 134
ACHN 14.16 8.3 315
HepG2 20.46 2 4
a. The △Ct value is determined by subtracting the average GAPDH Ct value from the average S100A7 Ct value. The standard devia- tion of the difference is calculated from the standard deviations of the S100A7 and GAPDH values.
b. The calculation of △△Ct involves subtraction by the △Ct calibrator value. This is subtraction of an arbitrary constant, so the stan- dard deviation of △△Ct is the same as the standard deviation of the △Ct value.
c. The range given for S100A7Nrelative to SNU668 is determined by evaluating the expression 2-△△Ctwith △△Ct+s and △△Ct-s, where s = the standard deviation of the △△Ct value.
GSTP1 genes those are highly and specifically up-regu- lated (Table 3, only S100A7 gene’s mRNA expression level was showed).
The tongue originated cell lines, such as SCC15, SCC25 and CAL27, expressed significantly high levels (the
range given for S100A7 relative to SNU668 is determined by evaluating the expression 2-△△Ct), the highest S100A7 mRNA expression was observed in CAL27, while phar- ynx, nasal or larynx originated cell lines, such as FaDu, RPMI2650, SNU1066 and SNU1214, showed low levels.
Fig. 1.Real-time quantitative RT-PCR analysis.
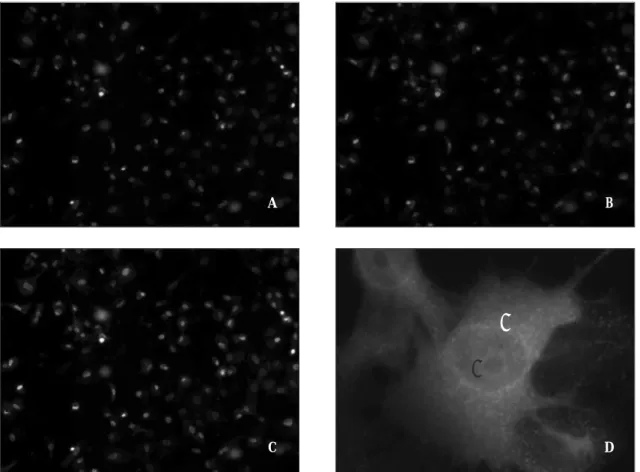
Fig. 2.Immunocytochemical analysis of the cellular distribution and patterns of expression of S100A7 antibody within CAL27(A, B and C). ×200 and ×1000. S100A7 antibody is localized in CAL27 cell in cytoplasm(D, white arrow) and in nuclei(D, black arrow).
A B
A B
C D
⇒
⇒
In the other cell lines, this gene’s mRNA expression was significantly low (Fig. 1A). In case of GSTP1 gene, the expression level was also high in HNSCC cell lines as S100A7 gene. FaDu cell line showed tremendous expres- sion level of GSTP1 gene relative to ACHN. The expres- sion of GSTP1 gene in other HNSCC cell lines and the other cell lines were significantly low (Fig. 1B).
H3.3A mRNA was expressed in the most of the HNSCC cell lines and the control group. UCHL1 mRNA showed its expression highly in lung cancer cell lines, the other cancer cell lines include HNSCC cell lines, showed very low levels. In case of UCHL1 gene, this study did not find some correlation with HNSCC cell lines. In case of PLK gene, similar pattern of expression was observed in all cancer cell lines, except HepG2 cell line, which showed high expression level. PAI-2 mRNA was expressed very low level in HNSCC cell lines and other cancer cell lines. TGFβand bFGF gene were expressed very low level in the most cancer cell lines, except stom- ach cancer cell lines. The expression of these genes were not founded specificity with HNSCC cell lines(these genes’figures were not showed).
Immunocytochemistry
Because S100A7 mRNA expression was found to be higher than that in the other cancer cell lines, immunocy- tochemical analysis was carried for S100A7 first. S100A7 antibody was used in CAL27, SNU484, SNU1066, A549 and ACHN, and was expressed in CAL27 cells but in other cancer cells showed absent or barely detectable lev- els. Figure 2 showed CAL27 immunoactivity to S100A7 antibody. S100A7 monoclonal antibody was localized in cytoplasm (Fig. 2D, white arrow) and nucleus (Fig. 2D, black arrow). Original magnification for panels at the microscope, ×200 and ×1000.
DISCUSSION
The aim of this study was to identify the useful candi- date genes related to HNSCC oncogenesis. In this study, the gene expression level was determined using a quanti- tative method, RTQ-PCR, which is considered to be a very accurate and reproducible method for assessing the gene expression level7). Among HNSCC-related genes6), genes whose expression level has association with HNSCC development were selected and assessed their expression level in HNSCC cell lines. We found that
S100A7 gene and GSTP1 gene level in the HNSCC cell lines were significantly increased, relative to correspond- ing other cancer cell lines.
S100A7 gene was first detected as a low molecular mass calcium-binding protein in psoriatic keratino- cytes8-10). This gene’s postulated function is association with keratinocyte differentiation, psoriasis and breath and bladder cancer progression. A possible role for S100A7 in HNSCC is only emerged by Banerjee11)as a invasion related biomarker and the exact function is not known. In our results, S100A7 gene expression showed a clearly restricted occurrence in tongue originated cell lines(CAL27, SCC15, and SCC25, especially increased in CAL27) and rarely detected in pharynx, larynx or nasal septum originated cell lines. In addition, to analyze the expression level and location of the S100A7 protein, this study performed immunocytochemical analysis of HNSCC cells using monoclonal anti-S100A7/HID-5 anti- body. Figure 2 shows that S100A7 proteins localize in the cytoplasm and nucleus, this means that S100A7 protein performs function such as cell cycle progression and dif- ferentiation at both site. In HNSCC cell lines, the high expression of S100A7 gene suggests that it may play a role in the regulation of the HNSCC growth, survival or differentiation, so S100A7 gene could be one of the can- didate for diagnostic marker in the tongue originated HNSCC.
The considerable importance of lifestyle in HNSCC, particularly the use of tobacco and alcohol and the role of diet, are well recognized12). However, despite the importance of these casual habits, relatively few persons who have them actually develope cancer, often despite years of exposure and, conversely, there are patients who develope HNSCC in no histology such habits or other identifiable lifestyle or environmental aetiological fac- tors. Host susceptibility must therefore play a important role. Factors determining the individual susceptibility to HNSCC are still largely unknown. An imbalance between enzymes involved in the toxification and detoxi- fication of (pre)-carcinogens closely related to HNSCC.
Genetic polymorphisms in Glutathione S-transferases (GSTs) often result in altered detoxification, which may contribute to individual susceptibility to HNSCC13). GSTs was a family of enzymes that play an important role in detoxification by catalyzing the conjugation of many hydrophobic and electrophilic compounds with reduced glutathione. Based on their biochemical, immunologic, and structural properties, the soluble GSTs is categorized
into 5 main class : alpha, mu, pi, theta and zeta. The glu- tathione S-transferase pi gene (GSTP1) is a polymorphic gene encording active, functionally different GSTP1 vari- ant proteins that are thought to function in xenobiotic metabolism and play a role in susceptibility to cancer, and other diseases14). GSTP1 expression level, like S100A7 gene pattern, differs depending on the cell line. In HNSCC cell lines, GSTP1 showed a distinctly restricted occurrence in pharynx originated cell line (FaDu) and rarely detected in tongue, larynx, nasal septum originat- ed cell lines and the other cancer cell lines. This results support the view that GSTP1 expression related to sus- ceptibility to cancer of the pharynx. This data suggests that the patient with highly expressed GSTP1 pattern may be at increased risk of HNSCC of the pharynx.
CONCLUSION
These results are provides a foundation for the devel- opment of site-specific diagnostic strategies and treat- ments for HNSCC and also additional analysis are need- ed to elucidate the exact role of S100A7 and GSTP1 genes in HNSCC tumorigenesis.
REFERENCE
1. Leethanakul C, Patel V, Gillespie J, Shillitoe E, Kellman RM, Ensley JF: Gene expression profiles in squamous cell carcinomas of the oral cavity. Oral Oncology 2000;36:474- 483.
2. Squire JA, Bayani J, Luk C, Unwin L, Tokunaga J, MacMillan C, Irish J, Brown D, Gullane P, Kamel-Reid S:
Molecular cytogenetic analysis of head and neck squamous cell carcinoma: By comparative genomic hybridization, spectral karyotyping, and expression array analysis. Head Neck 2002;24:874-87.
3. Hwang D, Alevizos I, Schmit WA, Misra J, Ohyama H,
Todd R: Genomic dissection for characterization of cancer- ous oral epithelium tissues using transcription profiling.
Oral Oncology 2003;39:259-268.
4. Califano J, van der Riet P, Westra W, Nawroz H, Clayman G, Piantadosi S, Corio R, Lee D, Greenberg B, Koch W, Sidransky D: Genetic progression model for head and neck cancer: implications for field cancerization. Cancer Res 1996;56:2488-2492.
5. Leethanakul C, Knezevic V, Amornphimoltham P, Gillespie J, Shillitoe EJ, Emko P, Patel V: Gene discovery in oral squamous cell carcinoma through the head and neck cancer genome anatomy project. Oral Oncology 2003;
39:248-258.
6. Shillitoe EJ, May M, Patel V, Leethanakul C, Ensley JF, Strausberg RL: Genome-wide analysis of oral cancer early results from the Cancer Genome Anatomy Project. Oral Oncol 2000;36:8-16.
7. Ha PK, Pai SI, Westra WH, Gillison ML, Tong BC, Sidransky D, Califano JA: Real-Time Quantitative PCR demonstrates low prevalence of human papillomavirus Type 16 in premalignant and malignant lesions of the oral cavity. Clinical Cancer Res 2002;8:1203-1209.
8. Watson PH, Leygue ER, Murphy LC: Psoriasin. The Int J Bio & Chem 1998;30:567-571.
9. Kulski JK, Lim, CP, Dunn DS, Bellgard M: Genomic and phylogenetic analysis of the S100A7 gene duplications within the region of the S100 gene cluster on human chro- mosome 1q21. J Mol Evol 2003;56:397-406.
10. Celis JE, Cruger D, Kiil J, Lauridsen JB, Ratz G, Basse B, Celis A: Identification of a group of proteins that are strongly upregulated in total epidermal keratinocytes from psoriatic skin. FEBS Lett. 1990;262:159-164.
11. Banerjee A: DNA microarray profiling for diagnostic for therapeutic targets. Food Science & Engineering 2004; sem- inar series F21C.
12. Cho YS, Kim MJ: Expression of multidrug resistance-relat- ed genes in oral squamous cell carcinomas. Oral Oncology 2001;37:652-659.
13. Mironova NJ, Voho A, Bouchardy C, Wikman H, Dayer P, Hirvonen A: Glutathione S-transferase GSTM1, GSTM3, GSTP1 and GSTT1 genotypes and the risk of smoking-re- lated oral and pharyngeal cancers. Int J Cancer 1999;81:44- 48.
14. Oude Ophuis MB, Roelofs HM, Brandt PA, Peters WHM, Manni JJ: Polymorphisms of the glutathione S transferase P1 gene and head and neck cancer susceptibility. Head and Neck 2003;25:37-43.