• 검색 결과가 없습니다.

Utilization Trends and Concentration Ratio of Korean Medicine: Based on the National Health Insurance Data

N/A
N/A
Protected

Academic year: 2021

Share "Utilization Trends and Concentration Ratio of Korean Medicine: Based on the National Health Insurance Data"

Copied!
10
0
0

로드 중.... (전체 텍스트 보기)

전체 글

(1)

Utilization Trends and Concentration Ratio of Korean Medicine: Based on the National Health Insurance Data

Hye-Jae Lee

1

, Hye In Jeong

2

, Kyeong Han Kim

3,4

*

1

Department of Pharmacy, College of Pharmacy, Woosuk University, Wanju, Republic of Korea

2

Department of Preventive Medicine, College of Korean Medicine, Kyung Hee University, Seoul, Republic of Korea

3

Woosuk Institute of Smart Convergence Life Care (WSCLC), Woosuk University, Wanju, Republic of Korea

4

Department of Preventive Medicine, College of Korean Medicine, Woosuk University, Wanju, Republic of Korea

Received July 20, 2021 Reviewed July 22, 2021 Accepted August 23, 2021

Objectives: Although Korean Medicine (KM) subsidized by the National Health Insurance (NHI) has been used for a long time, there has been no active analysis using claims data . Therefore, the purpose of this study was to examine the NHI KM utilization trend using NHI statistics and to measure the level of market concentration by year.

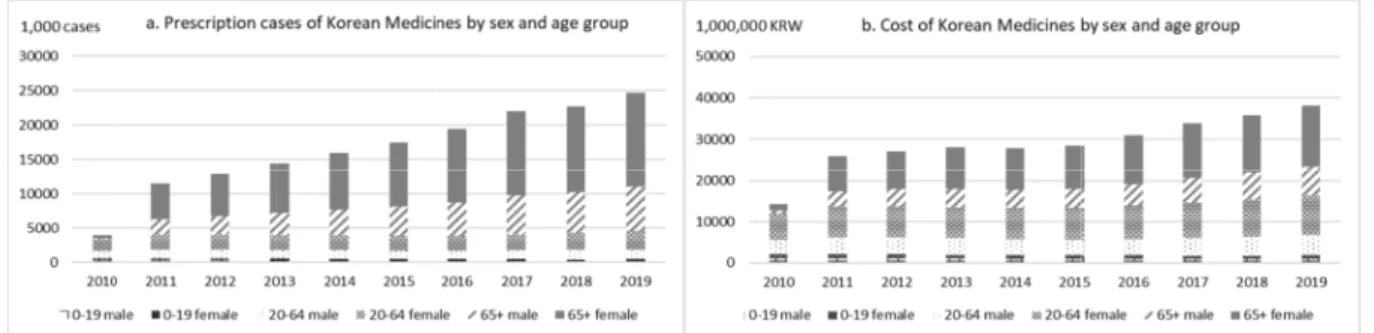
Methods: By restructuring the contents of NHI Statistics for Pharmaceuticals for 2010- 2019, the claim cases, costs, and annual growth rates of KM were demonstrated by year, sex, age group, region, therapeutic group, and KM treatment. The proportion of highly used k treatments in cost was calculated as the concentration ratio (CR) k and its trend by year was investigated.

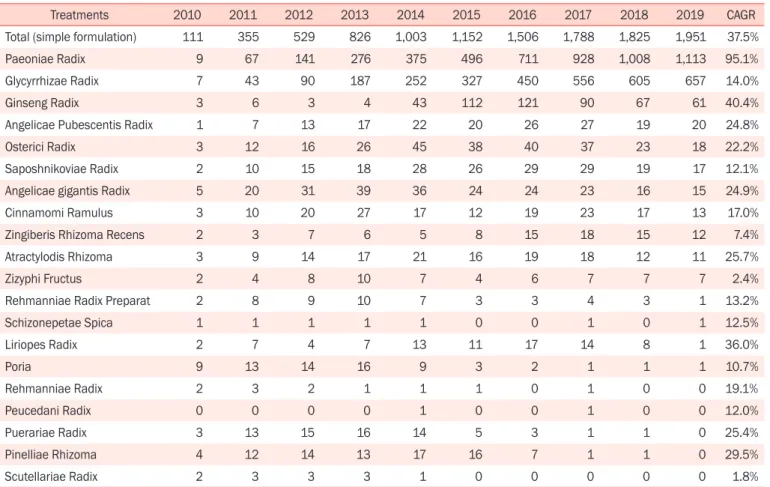
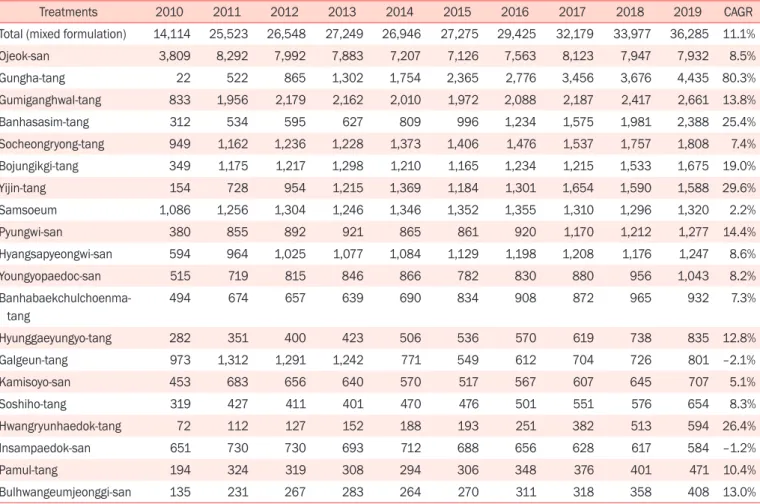
Results: In 2019, the NHI cost on KM amounted to ₩38.2 billion KRW, increasing by 11.6% per year on average in 2010-2019. Notably, KM was used more frequently among women and patients aged ≥ 65 years, and the mixed formulation accounted for 95% of the total cost of KM. The CR of the simple formulation increased rapidly, whereas that of the mixed formulation remained constant. In 2019, three simple formulation treatments—

peony, licorice, and ginseng— accounted for 93.8% of the total cost for KM (CR3 = 93.8%).

Conclusion: NHI KM is rapidly increasing. Investigating the CR of KM confirmed that KM prescriptions have been concentrated in small numbers over the past 10 years.

Keywords: korean medicine, herbal preparation, national health insurance, concentration ratio, utilization trend

*Corresponding Author Kyeong Han Kim

Department of Preventive Medicine, College of Korean Medicine, Woosuk University, 443, Samnye-ro, Samnye-eup, Wanju 55338, Republic of Korea Tel: +82-63-290-9031

E-mail: [email protected]

INTRODUCTION

Herbal preparations are defined as “dried, cut, or refined herbal substances, mainly collected from animals, plants, or minerals” under the Pharmaceutical Law, wherein certain herb- al preparations are covered by health insurance services [1]. As of 2020, there were 1,327 herbal preparations in total available on the health insurance service, comprising 682 single herbal preparations, 645 mixed herbal preparations, and 56 standard prescriptions [2].

Recently, Korean medical care has become health insurance- oriented and the overall market for its health insurance has also been steadily increasing. However, there has been no change in

the type of medicine that can be covered by health insurance services, and thus the usage of herbal preparations is low, ac- counting for a low percentage of total medical expenses. Cur- rently, 56 herbal preparations are covered by health insurance, which have been maintained since 1990 following its expansion from 36 in 1988 due to the recognition of 26 mixed prescrip- tions in 1987 [3].

Herbal preparations are relatively safe since they are based on traditionally used prescriptions; however, they can cause synergies or drug interactions when administered in combi- nation with other medications. Studies that show this have included interactions with certain drugs or diseases such as an- tiplatelet drugs and osteoarthritis, reporting that a combination

pISSN: 2093-6966 • eISSN: 2234-6856 https://doi.org/10.3831/KPI.2021.24.3.142

(2)

of herbal preparations and medicines is relatively safe [4, 5].

Previous studies have also shown that drug costs in standard prescriptions were concentrated on a small number of drugs, with 10 herbal preparations accounting for more than half of the claims and the top 20 diseases accounting for 90% of the total claims [6]. Although there have been suggestions—such as adding new prescriptions or improving manufacturing meth- ods—instead of deleting those with low frequency of use, many prescriptions remain concentrated on this small number of drugs [7].

Despite this situation, the current use of herbal preparations using health insurance claims data remains unreported. With the government’s policy to strengthen guarantees, Korean med- icine (KM) is also being promoted, and it is therefore necessary to investigate the changes in how herbal preparations are used.

To that end, there have been studies that have analyzed major diseases and standard prescriptions using health insurance data [6], studies on doctors’ drug administration [8], and studies that investigated doctors’ recognition and satisfaction [9].

In this study, we examined how the status of herbal prepara- tions has changed over the past decade. Since prior research has reported the concentration of their use in a small number of herbal preparations, the study is intended to analyze the use of herbal preparations and interpret their policy implications by applying the concept of market concentration to quantitatively represent them. The results of this study will provide basic data on the research and policies related to herbal preparations by suggesting how they should be used nationwide.

MATERIALS AND METHODS

1. Source of data

This study used data from one of the statistics using health insurance claims, referred to as “medicine statistics covered by insurance.” [10] The contents of the herbal preparations in this study were extracted and reconstructed from the Health Insur- ance Review and Assessment Service (hereinafter referred to as HIRA), which publishes medicine statistics every year. The herbal preparations presented in this study were based on single herbal and mixed herbal preparations listed in the “A health insurance list of herbal preparations and upper limit amount,”

which included health insurance claims other than medical benefits. The analysis period starts in 2010, when herbal medi- cine statistics started being produced, and continues until the

most recent data, 2019.

2. Variables

The status of herbal preparation use was presented as the number of claims, the expense of claims, and the rate of their increase. Specifically, the number of claims for each year re- fers to the number of medical statements prescribed by herbal preparations, whereas the expense claimed is the sum of insur- ance benefit costs and the patients’ own charges multiplied by the unit price and the cost of use for each herbal preparation.

To quantify the change in claims for 2010-2019, the growth rate period was calculated as the compound annual growth rate (CAGR), which can be interpreted as the average annual growth rate of the value (V) over a period of time (t years).

CAGR = (V final / V begin) ^(1 / t) – 1 3. Method of analysis

The study analysis was divided into three parts: (1) macro- level analysis of the trend in Korean herbal preparation use, (2) analysis of the status of use for individual herbal preparations, and (3) market concentration of herbal preparations. First, to analyze the trend of herbal preparation use in Korea, both the total number and cost of claims were presented on an annual basis and the increase rate was calculated and compared to the total KM treatment expenses from health insurance. Afterward, this was again classified by sex (male and female) and by pa- tient age (0-19 years, 20-64 years, and ≥ 65 years). Moreover, the use of herbal preparations was presented in subdivisions by region and by group of medicinal efficacies, confirming which region and which group of drugs with a certain medical efficacy were used more frequently and had increased rapidly.

For the efficacy group based on the Ministry of Food and Drug

Safety, only statistics for 2010-2017 were presented, which was

the only period for which data could be obtained. Second,

an analysis of individual herbal preparation claims identified

which of the single or mixed herbal preparations were used the

most and had increased in use. Finally, the market concentra-

tion of frequently used herbal preparations was presented as a

concentration, which quantitatively identified its changes dur-

ing the analysis period. Market concentration is a concept that

measures the monopoly power and level of market competition

of certain products in the market. However, in this study, the

concentration ratio k (CRk) was used to refer to prior research

(3)

to indicate the share of the top k products in the market [11]. In other words, CR3 refers to the share of the top three products in the overall market, wherein a high concentration meant that only a few products were mainly used. In this study, CR3, CR5, and CR10 were measured for single herbal preparations and CR3, CR5, CR10, and CR20 were measured for mixed herbal preparations.

RESULTS

1. Annual claim status of herbal preparations

According to the 2010-2019 health insurance statistics, the number of herbal preparations claims and expenses steadily in- creased (Table 1). Specifically, the expenses of claims for herbal preparations increased by 11.6% annually while the number of claims increased by 22.5% annually, which indicates that the ex- penses of claims per case have been decreasing. In fact, the ex- pense in 2010 was noted to be ₩36,000 KRW per prescription of herbal preparations, which decreased to ₩15,000 KRW per prescription in 2019. Moreover, according to a survey of claims for herbal preparations by type of nursing institution, herbal preparations were only used in KM hospitals and medicine clinics; by 2019, these institutions charged ₩2.7 billion KRW and ₩35.6 billion KRW, respectively. Furthermore, the rate of increase in prescribing expenses of KM clinics was 12.0%, which was higher than that of KM hospitals (6.7%). Therefore, herbal preparations were found to be mainly used in KM clinics rather than hospitals.

However, calculating the prescription expense per case showed that KM hospitals spent approximately ₩10,000 KRW in 2019 on average, whereas KM clinics only spent approxi- mately ₩1,450 KRW on average, indicating that KM clinics prescribed relatively cheaper preparations. According to sex- specific usage, as of 2019, the number of claims made by men and women were 8.26 million and 16.49 million, respectively, costing ₩12.9 billion KRW and ₩25.4 billion KRW, respec- tively. Over the past decade, the use of herbal preparations by women was noted to have increased more rapidly than that by men, with women’s claims increasing by 12.3% annually and men’s claims by 10.3% annually. According to age-specific us- age, 450,000 cases, 3.18 million cases, and 20.11 million cases of herbal preparations were reported in the age groups 0-19 years, 20-64 years, and ≥ 65 years, respectively. Over the past decade, the use of herbal preparations has decreased in the 0-19 years Ta ble 1

. Utiliza tion tr en ds of K or ean Medicin e b y pr escriber typ e, pa tien ts se x, a nd a ge gr ou p Ye ar To tal Ho spital Clinic Male Fe male 0-1 9 y ear s 20-6 4 y ear s 65+ y ear s Rx case s Co sts Rx cases Co sts Rx cases Co sts Rx cases Co sts Rx case s Co sts Rx cases Co sts Rx case s Co sts Rx case s Co sts 201 0 3,98 1 14 2 16 5 15 3,8 16 128 1,528 5,3 12 2,454 8,9 16 653 2,060 2,7 42 9,936 587 2,232 201 1 11 ,51 0 259 16 2 14 11 ,348 24 5 3,836 8,933 7,673 16,9 46 681 2, 142 3,386 11 ,53 7 7,4 42 12,200 20 12 12,9 16 271 202 14 12,7 14 257 4,3 10 9,333 8,608 17,7 44 670 2,092 3,465 11 ,672 8,783 13 ,3 13 201 3 14,5 18 281 19 2 15 14,325 266 4,8 15 9,59 7 9,70 7 18,4 79 605 1, 91 6 3,4 48 11 ,535 10,469 14,625 201 4 16,020 27 9 205 16 15 ,8 15 263 5,22 4 9,40 1 10,796 18,54 7 566 1,89 1 3,39 7 11 ,386 12,05 7 14,67 1 201 5 17,52 4 28 4 222 19 17,302 265 5,752 9,555 11 ,7 71 18,869 525 1, 81 7 3,3 74 11 ,43 1 13,62 4 15 ,1 76 201 6 19,5 18 309 238 22 19,28 1 288 6,395 10,390 13, 122 20,54 1 506 1,833 3,392 11 ,99 4 15,6 19 17, 104 20 17 21 ,996 340 24 8 24 21 ,7 48 31 5 7,233 11 ,385 14,7 64 22,580 469 1,78 4 3,6 15 12,8 46 17,9 13 19,339 201 8 22,68 1 358 259 25 22,422 333 7,55 7 12,045 15, 125 23,758 457 1,7 63 3,9 18 13,69 1 18,30 7 20,349 201 9 24,7 49 382 268 27 24,48 1 356 8,25 7 12,8 79 16,490 25,356 458 1,8 43 4, 179 14,5 71 20, 11 0 21 ,8 21 Gr owth rat e 22.5% 11 .6% 5.5% 6.7% 22.9% 12.0% 20.6% 10.3% 23.6% 12.3% –3.9% –1 .2% 4.8% 4.3% 48. 1% 28.8% No te : Rx me ans pre scriptio n. The u nit o f the Rx case s are 1 ,000 case s, and co sts are 1 00,000,000 KR W . Gr owth rat e w as calcu lat ed u sing CA GR (Co m po und Annu al Gr owth Rat e) f ormu la which me ans a ve rage gr owth rat e o f v alu e (V) du ring time in y ear s (t) calcu lat ed b y a f ormu la; (V

final

/V

begin

)^(1/t) – 1 .

(4)

group but has slightly increased in the 20-64 years group. How- ever, use in the 20-64 years old group was lower than the overall average growth rate, which increased by 48.1% per year in the

≥ 65 years group, indicating that the use of herbal preparations among the elderly has led to an increase in the number of herb- al preparations claims (Table 1 and Fig. 1). Claims by age group were also high among those aged ≥ 65 years, but the average annual growth rate was 28.8%, which was lower than that of the number of claims.

Looking at the expenses of claims made by 17 cities and provinces between 2010 and 2019, Seoul was found to use herbal preparations the most, followed by Gyeonggi, Busan,

Gyeongbuk, and Gyeongnam (Table 2). As of 2019, Seoul had used 8.1 billion KRW worth of herbal preparations, while Gyeonggi had used ₩7.7 billion KRW worth of herbal prepara- tions. During the analysis period, Sejong’s growth rate reached 27.5%, whereas the country’s growth rate reached 11.6%. Since then, Gyeongnam, Busan, Gyeongbuk, and Jeju have been iden- tified as areas with high growth rates.

As a result of classifying herbal preparations into therapeutic groups between 2010 and 2019, the use of drugs for the ner- vous system and sensory organs (190) was found to be the most common, followed by use as digestive organ solvents (239), heat-resisting painkillers (114), and digestive medicines (233)

Figure 1. Utilization trends of Korean Medicines by sex and age group: prescription cases (A) and cost (B).

Table 2. Utilization trends of Korean Medicines by region (unit: 1,000,000 KRW)

Region 2010 2011 2012 2013 2014 2015 2016 2017 2018 2019 Growth rate

Total 14,226 25,880 27,078 28,076 27,950 28,428 30,932 33,968 35,803 38,237 11.6%

Seoul 3,472 5,390 5,537 5,584 5,666 5,914 6,612 7,152 7,632 8,109 9.9%

Gyeonggi 2,869 4,998 5,097 5,207 5,337 5,470 6,060 6,715 7,093 7,706 11.6%

Busan 802 1,644 1,808 1,920 1,824 1,827 2,082 2,269 2,419 2,646 14.2%

Gyeongnam 603 1,266 1,452 1,610 1,606 1,682 1,753 1,914 1,954 2,109 14.9%

Gyeongbuk 633 1,470 1,509 1,567 1,566 1,646 1,681 1,833 1,889 2,066 14.0%

Incheon 689 1,175 1,193 1,260 1,266 1,247 1,365 1,497 1,698 1,834 11.5%

Daegu 640 1,153 1,250 1,293 1,325 1,359 1,457 1,596 1,672 1,784 12.1%

Daejeon 919 1,482 1,448 1,509 1,440 1,376 1,481 1,575 1,628 1,718 7.2%

Gwangju 568 867 955 1,077 1,178 1,215 1,306 1,541 1,559 1,640 12.5%

Chungnam 505 1,330 1,357 1,421 1,377 1,332 1,352 1,444 1,530 1,574 13.5%

Jeonbuk 520 992 1,088 1,114 1,193 1,218 1,351 1,484 1,488 1,536 12.8%

Jeonnam 490 1,261 1,384 1,419 1,312 1,289 1,354 1,557 1,538 1,525 13.4%

Chungbuk 533 974 1,000 1,015 928 939 1,004 1,096 1,134 1,235 9.8%

Gangwon 439 915 984 1,024 960 948 1,008 1,082 1,138 1,172 11.5%

Ulsan 414 610 611 604 551 550 594 682 775 857 8.4%

Jeju 131 353 371 365 335 330 372 413 501 543 17.1%

Sejong - - 33 85 86 87 100 117 155 181 27.5%

(5)

(Table 3). Other groups of drugs with a rapid increase in pre- scription expenses were as follows: emetic drugs (235) were the highest, with a 40.4% increase annually; followed by metabolic drugs (399), which were not classified separately and increased by 29.5% annually; and lastly by other metabolic drugs (219), which increased by 23.2% annually and were higher than the herbal preparations overall growth rate of 12.5%.

2. Herbal preparations claims per case

Looking at the claims for single herbal preparations for 2010-2019, these preparations were found to have the highest levels of Paeonia lactiflora and Glycyrrhizae Radix, for which the annual usage increased rapidly (Table 4, Fig. 2A). In 2019,

the claims for Paeonia lactiflora were about ₩11.1 billion KRW, and those for Glycyrrhizae Radix were about ₩600 mil- lion KRW, with an annual average growth rate of 14.0% and 40.4%, respectively. Subsequently, there were many claims, such as Glycyrrhizae Radix, Panax ginseng, Angelica koreana, and Aralia cordata. In the case of single herbal preparations, the expenses of claims for many drugs decreased during the analysis period, while the concentration of claims on the top drugs intensified. On the other hand, examining the claims of mixed herbal preparations during the same period showed that Ojeok-san was used the most annually, with a claim amounting to ₩7.9 billion KRW in 2019. Furthermore, the fastest-growing herbal preparation was Gungha-tang, which increased by 80%

annually, followed by Gumi-Ganghwaltang, Banha-Sashimtang, Table 3. Utilization trends of Korean Medicines by treatment group (unit: 1,000,000 KRW)

Treatment groups

1)

2010 2011 2012 2013 2014 2015 2016 2017 Growth rate

Total 14,114 25,524 26,548 27,249 26,946 27,276 29,425 32,179 12.5%

(190) Other medicines for nervous system and sensory organs

4,006 8,577 8,262 8,166 7,503 7,426 7,880 8,445 11.2%

(239) Other digestive drugs 1,854 3,114 3,511 3,965 4,638 5,642 6,439 7,481 22.1%

(114) Antipyretic, analgesic, anti- inflammatory

3,923 5,932 6,196 6,029 5,517 5,238 5,453 5,614 5.3%

(233) Geonwi-sohwaje (digestive drugs) 1,012 1,865 1,965 2,043 1,992 2,036 2,176 2,419 13.3%

(222) Jinhae Geodamje (cough suppressant, sputum remover)

1,065 1,432 1,526 1,519 1,676 1,687 1,781 1,857 8.3%

(235) Antiemetics 154 728 954 1,215 1,369 1,184 1,300 1,654 40.4%

(329) Other nourishing agents 560 1,556 1,599 1,681 1,587 1,542 1,649 1,649 16.7%

(263) Purulent disease agents 515 719 815 846 866 782 830 880 8.0%

(253) Tong-gyeongje (emmenagogue) 461 701 680 666 592 537 587 629 4.5%

(132) Otorhinolaryngicide 281 351 400 423 506 536 570 619 11.9%

(119) Other drugs for central nervous system

93 145 159 174 207 205 261 392 22.8%

(399) Metabolic drugs, not elsewhere classified

29 156 168 191 170 166 169 177 29.5%

(229) Other respiratory drugs 71 90 108 115 109 96 108 112 6.7%

(219) Other circulatory drugs 22 52 73 70 70 72 83 95 23.2%

(238) Laxative 18 35 45 46 50 51 49 51 16.0%

(231) Dental oral medicine 18 29 35 40 33 29 33 37 10.8%

(259) Other drugs for genitourinary organs and anal use

15 19 21 24 23 22 26 32 11.4%

(290) Other medicines for individual organs

13 17 26 28 29 21 22 25 9.8%

(392) Antidote 4 6 6 8 9 7 8 10 14.0%

Note: Treatments groups are defined by Korean Ministry of Food and Drug Safety (MFDS). Statistics of classification by MFDS treatment group were

available until 2017.

(6)

Socheongryong-tang, and Bojungikgi-tang (Table 5, Fig. 2B).

The growth rates of Leejin-tang, Hwangryeon-Haedogtang, and Banha-Sashimtang were also noted to be high.

3. Concentration of claims for high-use herbal preparations The concentrations of claims for 2010-2019 are presented separately for single and mixed herbal preparations (Table 6).

Based on the insurance payment list of herbal preparations in December 2019, single-extract preparations had a total of 67 Figure 2. Utilization trends of Korean Medicines by formulation: simple formulation (A) and mixed formulation (B).

Table 4. Utilization trends of highly used Korean Medicines: simple formulation (unit: 1,000,000 KRW)

Treatments 2010 2011 2012 2013 2014 2015 2016 2017 2018 2019 CAGR

Total (simple formulation) 111 355 529 826 1,003 1,152 1,506 1,788 1,825 1,951 37.5%

Paeoniae Radix 9 67 141 276 375 496 711 928 1,008 1,113 95.1%

Glycyrrhizae Radix 7 43 90 187 252 327 450 556 605 657 14.0%

Ginseng Radix 3 6 3 4 43 112 121 90 67 61 40.4%

Angelicae Pubescentis Radix 1 7 13 17 22 20 26 27 19 20 24.8%

Osterici Radix 3 12 16 26 45 38 40 37 23 18 22.2%

Saposhnikoviae Radix 2 10 15 18 28 26 29 29 19 17 12.1%

Angelicae gigantis Radix 5 20 31 39 36 24 24 23 16 15 24.9%

Cinnamomi Ramulus 3 10 20 27 17 12 19 23 17 13 17.0%

Zingiberis Rhizoma Recens 2 3 7 6 5 8 15 18 15 12 7.4%

Atractylodis Rhizoma 3 9 14 17 21 16 19 18 12 11 25.7%

Zizyphi Fructus 2 4 8 10 7 4 6 7 7 7 2.4%

Rehmanniae Radix Preparat 2 8 9 10 7 3 3 4 3 1 13.2%

Schizonepetae Spica 1 1 1 1 1 0 0 1 0 1 12.5%

Liriopes Radix 2 7 4 7 13 11 17 14 8 1 36.0%

Poria 9 13 14 16 9 3 2 1 1 1 10.7%

Rehmanniae Radix 2 3 2 1 1 1 0 1 0 0 19.1%

Peucedani Radix 0 0 0 0 1 0 0 1 0 0 12.0%

Puerariae Radix 3 13 15 16 14 5 3 1 1 0 25.4%

Pinelliae Rhizoma 4 12 14 13 17 16 7 1 1 0 29.5%

Scutellariae Radix 2 3 3 3 1 0 0 0 0 0 1.8%

Note: Treatments are ordered by cost in 2019. CAGR (Compound Annual Growth Rate) is average growth rate of value (V) during time in years (t)

calculated by a formula; (V

final

/V

begin

)^(1/t) – 1.

(7)

Table 5. Utilization trends of highly used Korean Medicines: mixed formulation (unit: 1,000,000 KRW)

Treatments 2010 2011 2012 2013 2014 2015 2016 2017 2018 2019 CAGR

Total (mixed formulation) 14,114 25,523 26,548 27,249 26,946 27,275 29,425 32,179 33,977 36,285 11.1%

Ojeok-san 3,809 8,292 7,992 7,883 7,207 7,126 7,563 8,123 7,947 7,932 8.5%

Gungha-tang 22 522 865 1,302 1,754 2,365 2,776 3,456 3,676 4,435 80.3%

Gumiganghwal-tang 833 1,956 2,179 2,162 2,010 1,972 2,088 2,187 2,417 2,661 13.8%

Banhasasim-tang 312 534 595 627 809 996 1,234 1,575 1,981 2,388 25.4%

Socheongryong-tang 949 1,162 1,236 1,228 1,373 1,406 1,476 1,537 1,757 1,808 7.4%

Bojungikgi-tang 349 1,175 1,217 1,298 1,210 1,165 1,234 1,215 1,533 1,675 19.0%

Yijin-tang 154 728 954 1,215 1,369 1,184 1,301 1,654 1,590 1,588 29.6%

Samsoeum 1,086 1,256 1,304 1,246 1,346 1,352 1,355 1,310 1,296 1,320 2.2%

Pyungwi-san 380 855 892 921 865 861 920 1,170 1,212 1,277 14.4%

Hyangsapyeongwi-san 594 964 1,025 1,077 1,084 1,129 1,198 1,208 1,176 1,247 8.6%

Youngyopaedoc-san 515 719 815 846 866 782 830 880 956 1,043 8.2%

Banhabaekchulchoenma- tang

494 674 657 639 690 834 908 872 965 932 7.3%

Hyunggaeyungyo-tang 282 351 400 423 506 536 570 619 738 835 12.8%

Galgeun-tang 973 1,312 1,291 1,242 771 549 612 704 726 801 –2.1%

Kamisoyo-san 453 683 656 640 570 517 567 607 645 707 5.1%

Soshiho-tang 319 427 411 401 470 476 501 551 576 654 8.3%

Hwangryunhaedok-tang 72 112 127 152 188 193 251 382 513 594 26.4%

Insampaedok-san 651 730 730 693 712 688 656 628 617 584 –1.2%

Pamul-tang 194 324 319 308 294 306 348 376 401 471 10.4%

Bulhwangeumjeonggi-san 135 231 267 283 264 270 311 318 358 408 13.0%

Note: Treatments are ordered by cost in 2019. CAGR (Compound Annual Growth Rate) is average growth rate of value (V) during time in years (t) calculated by a formula; (V

final

/V

begin

)^(1/t) – 1.

Table 6. Concentration ratio (CR) trends of highly used Korean Medicines

Concentration ratio 2010 2011 2012 2013 2014 2015 2016 2017 2018 2019

Simple formulation Total cost of the market (1,000,000 KRW)

111 356 530 826 1,004 1,152 1,506 1,789 1,826 1,951

CR

3

22.1% 36.5% 49.4% 60.7% 66.9% 81.2% 85.1% 88.0% 92.1% 93.8%

CR

5

29.7% 44.0% 56.3% 67.1% 74.8% 86.8% 89.7% 91.7% 94.3% 95.8%

CR

10

44.4% 59.4% 69.6% 77.4% 85.2% 94.5% 96.7% 97.8% 98.6% 99.2%

Mixed formulation Total cost of the market (1,000,000 KRW)

14,114 25,524 26,548 27,249 26,946 27,276 29,425 32,179 33,977 36,285

CR

3

41.6% 45.3% 43.2% 41.6% 40.7% 42.0% 42.2% 42.8% 41.3% 41.4%

CR

5

54.2% 54.8% 52.7% 51.0% 50.9% 52.1% 51.9% 52.8% 52.3% 53.0%

CR

10

73.4% 72.2% 71.4% 71.8% 70.8% 71.7% 71.9% 72.8% 72.4% 72.6%

CR

20

92.1% 91.6% 91.3% 91.1% 91.1% 91.3% 91.1% 91.3% 91.5% 91.9%

Note: Concentration ratio (CR

k

) means the proportion of the cost from the highest k products out of the total market cost. As of December 2020,

67 treatments (680 products) are listed as simple formulation, and 56 treatments (626 products) are listed as mixed formulation on the National

Health Insurance.

(8)

prescriptions (680 items), and CR3, which represents the top three prescriptions, accounted for 93.8% of the total, showing a high concentration with a significant increase compared to the 22.1% it accounted for in 2010. During the same period, the concentration of the top five herbal preparations, CR5, in- creased from 29.7% to 95.8%, and the concentration of the top 10 herbal preparations, CR10, increased from 44.4% to 99.2%.

In December 2019, a total of 56 prescriptions (626 items) were listed in the herbal preparation payment list, of which CR3 was 41.4%, showing a lower concentration than that of single herbal preparations. In comparison to the 41.6% CR3 concen- tration in 2010, the concentration level was almost unchanged.

During the same period, CR5 decreased from 54.2% to 53.0%, CR10 from 73.6% to 73.4%, and CR20 from 92.1% to 91.9%.

Additionally, the overall increase in claims for single herbal and mixed herbal preparations was 37.5% and 11.1%, respectively, and the concentration of certain herbal preparations was also greater in single herbal preparations, which intensified during the analysis period.

DISCUSSION

This study used statistics for 2010-2019, during the time when the International Classification of Diseases (ICD) code for herbal preparations in the National Health Insurance (NHI) was refined to reconstruct the approximate claims of herbal preparations and suggest the implications of changes in the use of herbal preparations. By looking at these changes over the past decade, we have been able to observe changes in herbal treatment expense, claims of herbal preparations, and the char- acteristics of these prescriptions and the patients taking them.

More importantly, by looking at the change in expense by the prescription name of herbal preparations, frequently used herb- al preparations were identified annually, as were the intensified concentrations of use of certain single herbal preparations.

Among the results of the study, the results presented in the annual statistics on herbal preparations are as follows. First, the use of herbal preparations increased more rapidly than Korean medical expenses in NHI. In 2019, Korean medical expenses amounted to about ₩3 trillion KRW, or 3.8% of the total health insurance expenses, which have increased by 6.7% annually over the past decade. On the other hand, herbal preparation was reported to be worth ₩38.2 billion KRW in 2019, which accounts for only 1.3% of Korean medical expenses and 0.05%

of total health insurance costs. Despite this, its annual growth

rate was 11.6% during the same period, which was greater than that of Korean medical expenses. Although small, the dynamic changes in herbal preparation use in the public domain will be an important reference for improving the herbal preparation- related system and establishing policies.

Second, statistics by age group showed that the use of herbal preparations in women was higher than that in men and has increased rapidly. While herbal preparation use in patients aged 0-19 has decreased, its use in people ≥ 65 years has increased significantly, suggesting that its use by older patients has led to an increase in the claims of herbal preparations. However, the number of prescriptions for herbal preparations in the elderly has increased by approximately 50% each year, whereas the prescription expense has increased by 29%, which indicates that the bills per case in this population are gradually decreasing, thereby suggesting more low-unit-cost prescriptions.

Third, regional statistics showed that Seoul had the most herbal preparation use. However, considering that the use of herbal preparations was mainly by the elderly, it was expected that many herbal preparations would be used in areas where the population has aged due to its distribution. Given that the growth rate has increased more rapidly in provincial areas than in Seoul or metropolitan cities, one cannot doubt that there is a link between the aging level by region and herbal preparation prescription.

The analysis of each type of herbal preparation has also pro- duced meaningful results, with the expense of claims made by the top single herbal preparations, such as Paeonia lactiflora and Glycyrrhizae Radix, accounting for a large portion of the total herbal preparations. In 2019, CR3 was 93.8%, meaning that claims for three single herbal preparations—Paeonia lac- tiflora, Glycyrrhizae Radix, and Panax ginseng—accounted for 93.8% of the total 67 prescriptions. This concentration has intensified rapidly over the past decade, whereas other prescrip- tions have been decreasing, resulting in the total expense of claims for single herbal preparations increasing significantly.

Notably, this phenomenon has been observed more severely in single herbal than in mixed herbal preparations. In comparison, the concentration of mixed herbal preparations (CR3, CR5, CR10, and CR20) did not change significantly during the analy- sis period. However, there has been a rapid increase in some prescriptions, such as Gungghal-tang.

Patterns regarding the prescriptions by KM doctors for these

herbal preparations can be interpreted as the result of a system

designed to raise the total treatment cost for senior citizens

(9)

from ₩15,000 KRW to ₩20,000 KRW when administered by KM institutions. These institutions have a structure in which the total cost of medication is included in the total medical ex- penses when patients take insurance-covered KM. In this case, if the cost of medication increases, the total medical expenses may exceed the standard for the flat-rate system application in the elderly. In such cases, it will be converted to a fixed-rate sys- tem, possibly resulting in a sharp increase in personal burden compared to the flat-rate system. Considering this environ- ment, it can be explained why herbal medicine prescriptions have been increasing in the elderly while the administrative fee per prescription is decreasing. Additionally, considering that the main target of KM clinics is the elderly and women, it can be estimated that herbal preparation use is increasing due to these populations. Furthermore, the high concentration of Paeonia lactiflora and Glycyrrhizae Radix among sweetened herbal preparations can be explained by the omission of Jakyak- gamcho-Tang, which is often used for muscle and joint pain.

Based on the 2019 statistics, the expense of claims for single herbal preparations was only ₩1.9 billion KRW, but that for mixed herbal preparation was ₩36.3 billion KRW, which shows that 95% of the prescription expense for herbal preparations was in mixed herbal preparations. This can be seen as a big re- sult of the current medical charge of herbal preparations, which tend to prefer mixed herbal preparations due to the difficultly of preparing prescriptions with various kinds of single herbal preparations in the clinical setting. Therefore, it would be de- sirable to reasonably revise the medical charge of single herbal preparations or diversify the standard prescription of mixed herbal preparations so that appropriate herbal preparations can be prescribed to patients.

Given that herbal preparation is a prescription that is cov- ered by health insurance benefits and is managed according to the payment list, its prescription and usage are accumulated as big data. This means that more in-depth analyses on herbal preparation use, herbal prescription, and effectiveness are likely to be used through the aggregation of these data from patient groups in the future. This study is the first long-term aggre- gation of herbal preparation use covered by insurance and is meaningful in providing basic academic and policy data.

However, it should be noted that the situation of herbal preparations excluded from insurance cannot be determined, that various external variables can act on the prescription pat- terns of herbal preparations, and that sufficient time series data were not analyzed before and after 2011, when the flat-rate

scheme for the elderly was introduced.

CONCLUSION

In this study, the usage status of herbal preparations covered by health insurance was analyzed by reconstructing the drug statistics of the HIRA data for 2010-2019. As a result, it was found that even if the size of herbal preparations was small, the use of herbal preparations has increased more rapidly than the total cost of KM over the past decade, especially among the el- derly. However, many of the increased prescriptions were low- cost, which was closely related to the rapid increase in single herbal preparations. Furthermore, these single herbal prepara- tions were concentrated on a small number of herbs, including Paeonia lactiflora, Glycyrrhizae Radix, and Panax ginseng.

Health preparation covered by NHI is an area where claims data have been accumulated following the establishment of health care big data. Moreover, there are various possibilities for future research using this data, as the basic results of this study will be a reference for future research and policy arrangements.

ACKNOWLEDGMENTS

This research was conducted with the support of the Re- search Service Project of the Korea Institute of Korean Medi- cine.

CONFLICTS OF INTEREST

The authors declare no conflicts of interest.

FUNDING

The authors received no financial support for the research, authorship, and publication of this article.

ORCID

Hye-Jae Lee, https://orcid.org/0000-0002-1010-4925 Hye In Jeong, https://orcid.org/0000-0002-3651-9678 Kyeong Han Kim, https://orcid.org/0000-0003-4868-9145

REFERENCES

1. National Law Information Center. Pharmaceutical Affairs Act

(10)

[Internet]. Sejong: Ministry of Government Legislation; 2021 [cited 2021 Feb 19]. Available from: https://www.law.go.kr/.

2. Health Insurance Review & Assessment Service. Notice No.2020-338 List of Herbal Medicinal Preparations Covered with National Health Insurance and Upper Limit Amount Table [Internet]. Wonju: Health Insurance Review & Assessment Ser- vice; 2020 [cited 2021 Feb 19]. Available from: https://www.hira.

or.kr/rd/insuadtcrtr/bbsView.do?pgmid=HIRAA030069000400

&brdScnBltNo=4&brdBltNo=51741&isPopupYn=Y.

3. Wonkwang University Industry-Academic Cooperation Group.

A Report for the Rational Improvement of the Standard Pre- scription of Herbal Medicine [Internet]. Wonju: Health Insur- ance Review & Assessment Service; 2014 [cited 2021 Aug 6].

Available from: https://policy.kiom.re.kr/sub0401/articles/view/

tableid/sub0301-board/page/20/id/313.

4. Lee I, Park SM, Park SC, Kim DH, Cho MK, Han CW, et al.

Overview of the interaction between warfarin and Korean herb- al medicine. Korean J Orient Int Med. 2012;33(2):160-71.

5. Kim DH, Lee DE, Noh JW, Ahn YM, Ahn SY, Lee BC. A study of the co-administration of herbal and Western medicines to hospitalized patients with osteoarthritis. J Int Korean Med. 2018;

39(2):97-106.

6. Park HJ, Oh MS, Kim EJ, Lee SG, Park SK, Kim YK. The analy-

sis of main diseases and herbal preparations in herbal health insurance. Korea J Herbol. 2006;21(4):1-10.

7. Kang SH, Kim JH, Jang SB, Lee MY, Lee JA, Park SJ. Herbal medicine prescription analyses of bronchiectasis patients with claim data during 5 years (2013~2017). J Soc Prev Korean Med.

2019;23(3):1-12.

8. Kwon YC, Yoo WK, Seo BI. A study on the current status of prescribed drugs in oriental health insurance and their improve- ment. Korea J Herbol. 2012;27(2):1-16.

9. Kim KH, Lee EK, Go HY, Chang SW, Ju SW, Jang BH, et al. The awareness and satisfaction of herbal medicine preparations of Korean medicine doctor. J Soc Prev Korean Med. 2017;21(2):15- 22.

10. Health Insurance Review & Assessment Service. National Health Insurance Drug Statistics 2019 [Internet]. Wonju: Health Insur- ance Review & Assessment Service; 2020 [cited 2021 Feb 19].

Available from: http://www.hira.or.kr/bbsDummy.do?pgmid=H IRAA020045010000&brdScnBltNo=4&brdBltNo=2331&pageIn dex=1.

11. Heo J. Reimbursement price, market structure, and pharma-

ceutical firm behavior in Korea [dissertation]. [Seoul]: Seoul

National University; 2011. 187 p.

수치

Figure 1. Utilization trends of Korean Medicines by sex and age group: prescription cases (A) and cost (B).
Table 4. Utilization trends of highly used Korean Medicines: simple formulation (unit: 1,000,000 KRW)
Table 5. Utilization trends of highly used Korean Medicines: mixed formulation (unit: 1,000,000 KRW)

참조

관련 문서

1 John Owen, Justification by Faith Alone, in The Works of John Owen, ed. John Bolt, trans. Scott Clark, "Do This and Live: Christ's Active Obedience as the

3.. Monthly Energy Statistics contains basic data on the supply and demand statistics of major energy sources such as oil, gas, coal, and electricity as well

Study of diabetes and the nutrition education and awareness of nutrition labels in Korean adults: Using data from the fifth Korea National Health and Nutrition Examination

Objective: This study was conducted to identify the association between vitamin D and osteosarcopenia among all adults in Korea using data from the Korea National Health

Objective: The purpose of this study is to investigate the relationship between depression and evening meals for adult women by using the National Health and Nutrition Survey

If we think the principle of self-determination and responsibility as principal, we should be oriented to the solution system of making private insurance contract against the

Objective: This study was conducted to identify the association between vitamin D and Sarcopenia among all adults in Korea using data from the National Health and

The first public medical insurance act enacted in 1963 and according to the Amendment in 1976 became the health care insurance compulsorily.. The national