FT-IR 스펙트럼 데이터 기반
다변량통계분석기법을 이용한 아티초크의 대사체 수준 품종 분류
김천환 · 성기철 · 정영빈 · 임찬규 · 문두경 · 송승엽*
농촌진흥청 국립원예특작과학원 온난화대응농업연구소
Establishment of discrimination system using multivariate analysis of FT-IR spectroscopy data from different species of artichoke ( Cynara cardunculus var. scolymus L.)
Chun Hwan Kim, Ki-Cheol Seong, Young Bin Jung, Chan Kyu Lim, Doo Gyung Moon, and Seung Yeob Song*
Agricultural Research Institute for Climate Change, NIHHS, RDA, Jeju 690-150, Korea
*Corresponding author: [email protected]
Abstract
To determine whether FT-IR spectral analysis based on multivariate analysis for whole cell extracts can be used to discriminate between artichoke (Cynara cardunculus var. scolymus L.) plants at the metabolic level, leaves of ten artichoke plants were subjected to Fourier transform infrared(FT-IR) spectroscopy. FT-IR spectral data from leaves were analyzed by principal component analysis (PCA), partial least square discriminant analysis (PLS-DA) and hierarchical clustering analysis (HCA). FT-IR spectra confirmed typical spectral differences between the frequency regions of 1,700-1,500, 1,500-1,300 and 1,100-950 cm
-1, respectively. These spectral regions reflect the quantitative and qualitative variations of amide I, II from amino acids and proteins (1,700-1,500 cm
-1), phosphodiester groups from nucleic acid and phospholipid (1,500- 1,300 cm
-1) and carbohydrate compounds (1,100-950 cm
-1). PCA revealed separate clusters that corresponded to their species relationship. Thus, PCA could be used to distinguish between artichoke species with different metabolite contents. PLS-DA showed similar species classification of artichoke. Furthermore these metabolic discrimination systems could be used for the rapid selection and classification of useful artichoke cultivars.
Additional key words: artichoke, Fourier transformation – infrared (FT-IR) spectroscopy, metabolic discrimination, Partial least square discriminant analysis (PLS-DA), Principal component analysis (PCA).
Received: October 5, 2015 Revised: December 7, 2015 Accepted: March 23, 2016
Copyrightⓒ
2016 Korean Society for Horticultural Science.
본 논문은 농촌진흥청 연구과제(과제번호: PJ009393) 지원에 의해 이루어진 것임.
Korean J. Hortic. Sci. Technol. 34(2):324-330, 2016 http://dx.doi.org/10.12972/kjhst.20160033 pISSN : 1226-8763
eISSN : 2465-8588
서 언
국화과 다년생 아티초크(
Cynara cardunculus var
.scolymus L
.)는 미숙 꽃봉오리를 사용하는 채소류이며, 식이섬유와 항산 화성 페놀 물질을 함유하고 있는 식물이다. 또한, 아티초크에 함유되어 있는cynarin
성분은 콜레스테롤 저하, 신장과 간 대사 기능에 효과가 있는 것으로 알려져 있다(Francisco and Pedro
,2003
;Wang et al
.,2003
;Seong et al
.,2008
;Adzet and Puigmacia
,1985
).아티초크는 주로 ‘
Green Globe
’, ‘Tempo
’, ‘Cardoon
’ 그리고 ‘Imperial Star
’ 품종이 온화한 지중해 연안지역에서 재배된다. 이 러한 다양한 품종을 식별하는 방법은AFLP
(amplified fragment length polymorphism
),M
-AFLP
(microsatellite
-amplified fragment length polymorphism
),S
-SAP
(sequence
-specific amplification polymorphism
) 그리고QTL
(quantitative trait loci
) 등을 이용하여 유전적 다양성 분석과 품종 구분이 이뤄지고 있다(Acquadro et al
.,2005
;Lanteri et al
.,2006
;Portis et al
.,2012
). 이러한 방법들은 정확한 유전적 분석을 통해 품종에 대한 정밀한 분석이 가능하지만, 분석에 대한 복잡성 그리고 많은 시간과 비용이 소요되는 한계점을 가지고 있다.최근 오믹스 연구기법과 대사체학 연구가 활발히 진행되면서 대사체 수준에서 시료간의 양적, 질적 차이를 구명하고 있다.
Fourier transform infrared
(FT
-IR
)spectroscopy
,proton nuclear magnetic resonance
(HNMR
)spectroscopy
및mass spectrometry
(MS
) 등이 대사체 연구에 사용되고 있으며 분석 데이터를 이용하여 각종 시료의 식별 및 대사체 마커 개발에 활 용이 되고 있다(Krishnan et al
.,2005
). 특히,FT
-IR
스펙트럼은 스펙트럼상에 아미노산이나 단백질, 지방산, 그리고 탄수화물 계통의 화합물 등 다양한 정보를 포함하고 있고 다변량 통계분석을 이용하면 신속하고 정확하게 품종 구분할 수 있다 (Gallardo
-Velázquez et al
.,2009
).FT
-IR
분석 기술을 이용하여 미생물종의 유연관계를 식별하고(Goodacre et al
.,1998
;Timmins et al
.,1998
;Wenning et al
.,2002
), 돌연변이 선발(Chen et al
.,1998
;Stewart et al
.1997
), 고등식물의 종 구분(Kim et al
.,2004
), 두과작물 품종 식별(Song et al
.,2012
) 등에 활용이 가능하다고 보고된 바 있다.따라서 본 연구는
FT
-IR
스펙트럼의 데이터에 다변량통계분석 기법을 이용하여 제주특별자치도에서 재배될 수 있는 아티초크10
품종의 대사체 수준에서 신속한 품종 식별 체계를 확립하고, 우수한 계통 선발을 위한 품종 식별 기술을 구축 하고자 한다.재료 및 방법 식물재료
본 연구는 국립원예특작과학원 온난화대응농업연구소에서 포장 내 무가온하우스에서 재배되고 있는 아티초크(
Cynara cardunculus var
.scolymus L
.)10
종의 품종을 사용하였다. 연구에 사용된 아티초크는 고정종인 ‘Green Globe
’, ‘Violetto
Fig. 1. Artichoke (Cynara cardunculus var. scolymus L.) plants used in this study. (A) Green Globe, (B) Violetto di Chioggia, (C) Nun 4011 AR, (D) Madrigal, (E) Tempo, (F) Romagna, (G) Intentid, (H) Cardoon, (I) Imperial Star, (J) Opera.
A B C D E
F G H I J
di chioggia
’, ‘Nun 4011 AR
’, ‘Madrigal
’, ‘Tempo
’, ‘Romagna
’, ‘Intentid
’, ‘Cardoon
’, ‘Imperial Star
’ 그리고 ‘Opera
’으로8
말에 파종하여9
월말에 정식하였고,4
월말에 각 품종별5
개의 라인 잎을3
반복으로 시료를 준비하여 대사체 분석에 이용하였다( Fig . 1 ). 각각의 잎 시료는 동결건조하여 막자와 막자사발을 이용하여 분말 형태로 분쇄하였다. 분쇄된 잎 시료는 - 70
℃ 초저온냉동고에 보관하여 사용하였다.
아티초크 whole-cell 추출물 제조
1
.5mL Eppendorf tube
에10
종의 아티초크 잎 시료 분말20mg
을 넣고20
%(v
/v
)methanol 200µL
을 첨가하여 시료와 용액 이 잘 섞이도록vortexing
하였다. 준비된 시료는50
℃water bath
에서20
분간 추출하였고, 추출된 시료는13
,000rpm
에서15
분 간 원심분리하였다. 원심분리 후 상층액을 새로운tube
에 옮기고, 추출물 찌꺼기를 완전히 제거하기 위해 다시 한번13
,000rpm
에서5
분간 원심분리하여 상층액을 새로운tube
로 옮겼다.FT
-IR
스펙트럼 분석에 사용하기 위해 추출된 추출물은 −20
℃에 서 냉동 보관하여 사용하였다(Song et al
.,2014
).FT-IR 스펙트럼과 데이터 전처리 및 다변량 통계분석
FT
-IR
(Fourier transform infrared
) 스펙트럼 조사는Tensor 27
(Bruker Optics GmbH
,Ettlingen
,Germany
)과DTGS
(Deuterated triglycine sulfate
) 검출기를 사용하였다(Song et al
.,2014
). 추출된 각각의 시료는5µL
씩3
반복으로384
-well ZnSe plate
에 분주하여,37
℃hot plate
에서 약20
-30
분간 건조한 후HTS
-XT
(Bruker Optics GmbH
) 고효율 자동화 장 치를 이용하여 스펙트럼을 측정하였다. 스펙트럼은4000
-400cm
-1 범위에서4cm
-1 간격으로128
회 반복 측정되었고, 측정된 스펙트럼의 평균 스펙트럼을 분석에 사용하였다.Bruker
에서 제공하는OPUS Lab
(ver
.6
.5
,Bruker Optics Inc
.)를 사용하여FT
-IR
스펙트럼 조사 및 데이터 변환을 하였고,baseline
교정을 위해FT
-IR
스펙트럼 분석 영역의 양 끝점(800
-1800cm
-1) 의 흡광도를0
으로 조정하였다. 실험상의 오차를 최소화하기 위하여 각 스펙트럼을 동일 면적으로normalization
을 실시하였 으며,mean centering
과정을 거쳐2
차 미분하여 스펙트럼의 전처리 과정을 실시하였다.가공된
FT
-IR
스펙트럼 데이터는NIPALS
알고리즘(Wold
,1966
)을 이용하여R
프로그램(version 3
.1
.2
)을 사용하여PCA
(Principal component analysis
)와PLS
-DA
(Partial least squares discriminant
)분석을 수행하였다(Fiehn et al
.2000
;Trygg et al
.2007
).PCA
및PLS
-DA
분석을 통해 얻어진score
를 이용하여HCA
(hierarchical clustering analysis
) 분석하였으 며 유사도 지수로UPGMA
(unweighted pair group method with arithmetic mean analysis
)를 사용한Euclidean distance
를 측 정하여 각 시료의 유연관계를 덴드로그램으로 나타냈다.결과 및 고찰
주요 아티초크의 FT-IR 스펙트럼 비교 분석
아티초크로부터 전세포추출물의
FT
-IR
스펙트럼 데이터는 다변량통계분석을 통해 아티초크 작물의 대사체 수준에서 유 연관계를 규명하고 품종 식별을 분석하였다. ‘Green Globe
’, ‘Violetto di chioggia
’, ‘Nun 4011 AR
’, ‘Madrigal
’, ‘Tempo
’,‘
Romagna
’, ‘Intentid
’, ‘Cardoon
’, ‘Imperial Star
’ 그리고 ‘Opera
’ 등 아티초크 작물들은FT
-IR
스펙트럼상에서 대사체의 양적, 질적 패턴 변화가 나타났다(1700
-1500
,1500
-1300
,1100
-950cm
-1)(Fig . 2 ). FT
-IR
스펙트럼의1700
-1500
,1500
-1300
,1100
-950cm
-1 주요 부위는 각각 특정 화합물들을 나타내는데, 주로Amide I
과II
을 포함하는 아미노산 및 단백질계열의 화 합물들의 질적, 양적 정보를 나타내고(P
=O
,C
=O
,N
-H
,C
-C
그리고C
=C
),phosphodiester group
을 포함한 핵산 및 인지 질의 정보가 반영이 되고(CH
2와P
=O
), 단당류나 복합 다당류를 포함하는carbohydrates
계열의 화합물들이 질적, 양적정보가 반영(
C
-O
,C
-C
그리고C
-O
-C
)되어 나타낸다(Parker
,1983
;Dumas and Miller
,2003
;Wolkers et al
.,2004
;Yee et al
.,2004
;D
’Souza et al
.,2008
;Lopez
-Sanchez et al
.,2010
). 이처럼FT
-IR
스펙트럼 상의 질적, 양적 차이가 아티초크 품종 이 함유하고 있는 아미노산이나 단백질, 지방산, 그리고 탄수화물계통의 화합물들의 질적, 양적 차이가 현저하게 나타남을 의 미한다. 따라서,FT
-IR
스펙트럼 분석은 아티초크의 주요 대사체의 질적, 양적 변화를 분석하여 계통 선발 수단으로 신속한 활 용이 가능할 것이다.FT-IR 스펙트럼 다변량 통계분석 및 대사체 수준 유연관계 비교
10
품종 아티초크의FT
-IR
스펙트럼 데이터를PCA
분석한 결과PC 1
과2
의 설명력이14
.2
%와12
.7
%로 각각 나타났다( Fig . 3A ). 전체 아티초크 품종 중 ‘ Romagna
’와 ‘Cardoon
’ 품종이 대사체 수준에서 유사성이 높게 나타났고, 두개의 아티초크품종을 제외한 나머지 품종들은 각각의 그룹을 형성하였다. 하측으로 ‘
Romagna
’와 ‘Cardoon
’를 중심으로 ‘Nun 4011 AR
’,‘
Madrigal
’, ‘Violetto di chioggia
’,Intentid
’ 그리고 ‘Tempo
’ 품종이 분포하면서 각각의 그룹을 형성하고 있고, 외각으로 ‘Green Globe
’, ‘Opera
’ 그리고 ‘Imperial Star
’가 그룹을 형성하여 나타났다. 이처럼, ‘Romagna
’, ‘Cardoon
’, ‘Nun 4011 AR
’, ‘Madrigal
’,‘
Violetto di chioggia
’, ‘Intentid
’ 그리고 ‘Tempo
’가 대사체 정보가 비슷한 것으로 판단되고, ‘Green Globe
’, ‘Opera
’ 그리고‘
Imperial Star
’ 품종과는 차이를 나타냈다. 또한, 아티초크 품종 중에서 가장 많이 재배되고 있는 ‘Green Globe
’와 ‘Cardoon
’이 상, 하로 분포하는 것으로 보아 서로 다른 대사체 수준에서도 품종 분류가 가능할 것으로 판단된다. 두과작물에서도PCA
분석 을 통해 대사체 수준에서 계통 분류가 이뤄졌고(Song et al
.,2012
), 아프리칸 얌 또한 품종간 분류가 가능하다고 보고되었다 (Song et al
.,2014
). 이 결과들은 아티초크10
개의 품종 중에서 ‘Cardoon
’과 ‘Green Globe
’가 계통분류학적으로 유연관계가 낮 고, 서로간에 대사체 수준의 차이가 뚜렷하게 나타나는 것으로 보아 대사체 수준에서 마커 탐색에 가장 중요한 품종으로 작용 할 것으로 판단된다.10
품종 아티초크의 대사체 수준 식별에 중요하게 작용한FT
-IR
스펙트럼 부위를 확인하였다( Fig . 3B ). FT
-IR loading value
를 확인한 결과,PC 1
과2
를 분류하는 중요한 기준은1650
-1550
과1100
-950cm
-1 부위임을 알 수 있었다(Fig . 3B ).
1650
-1550
과1100
-950cm
-1 부위는FT
-IR
스펙트럼상에서 차이를 나타냈던 부위(Fig . 2 )와 일치하였고, 이 부위가 나타내
는amide I
,II
와carbohydrates
계열의 화합물들이 양적, 질적 차이를 보이면서 아티초크 대사체 수준 식별에 가장 중요한 역할 을 하는 것으로 알 수 있었다(Schulz and Baranska
,2007
)(Fig . 3B ).
Fig. 2. Representative FT-IR spectral from artichoke leaves of main cultivar. FT-IR spectral ranges showed quantitative information of protein/amide I, II (1500-1700 cm
-1), phosphodiester group (1300-1500 cm
-1), and sugar compound (950-1100 cm
-1). AG, Green Globe; AT, Tempo; AK, Cardoon; AP, Imperial Star.
*n = 3
Wavelength (cm
-1)
Absorbance
0.2
0.0
1800 1600 1400 1200 1000 800
0.4 0.6 0.8 1.0
AG AT AK AP
PLS
-DA
분석의 경우PCA
분석 보다 아티초크의 종간 식별이 뚜렷하게 나타났다( Fig . 4 ). PLS
-DA score plot
을 보면Violetto di chioggia
’, ‘Tempo
’, ‘Intentid
’ 그리고 ‘Madrigal
’4
품종이 중앙에 그룹을 형성하면서4
개의 품종이 비슷한 대사체 정 보를 나타내는 것으로 판단된다. 또한, ‘Cardoon
’과 ‘Green Globe
’가 뚜렷하게 나눠졌고, ‘Romagna
’와 ‘Nun 4011 AR
’ 품종이‘
Cardoon
’ 품종과 가까이에 위치하면서 ‘Romagna
’와 ‘Nun 4011 AR
’ 품종이 ‘Cardoon
’ 품종과 유사한 품종임을 알 수 있었다( Fig . 4 ). 10
품종의 아티초크 중에서 ‘Imperial Star
’ 품종이 가장 멀리 단독으로 그룹을 형성하는 것으로 보아 ‘Cardoon
’과‘
Green Globe
’ 품종과는 다른 대사체 정보를 나타냄을 알 수 있었다(Fig . 4 ). 이 결과, FT
-IR
스펙트럼 데이터를 이용한PLS
-DA
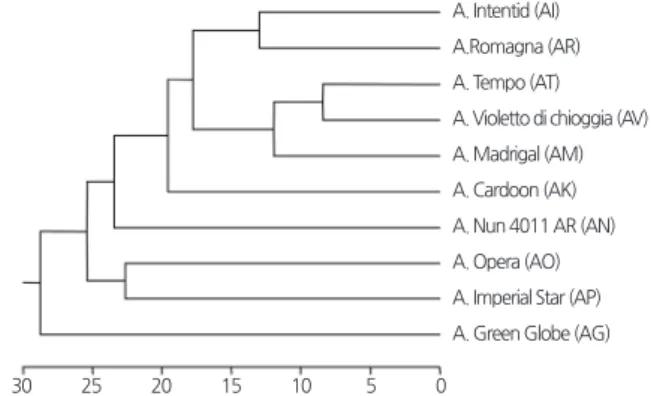
분석으로 아티초크 간의 종 구분이 가능함을 알 수 있었다.HCA dendrogram
분석 결과를 보면 ‘Cardoon
’ 품종이 중앙에 위치하고, ‘Green Globe
’ 품종이 가장 아래쪽으로 나타나는 것을 볼 수 있다( Fig . 5 ). 또한, ‘ Tempo
’, ‘Violetto di chioggia
’와 ‘Madrigal
’품종이 유연관계가 높고, ‘Opera
’와 ‘Imperial Star
’ 품 종, ‘Intentid
’와 ‘Romagna
’ 품종이 각각 높은 유연관계를 형성하는 것으로 나타났다. 하지만, 중앙에 ‘Cardoon
’과 ‘Nun 4011 AR
’ 품종이 위치하고 ‘Green Globe
’ 품종이 아래쪽으로 나타나면서 이3
개의 품종을 이용하면 대사체 분석을 통한 품종 분류 가 가능할 것으로 판단되다. 이상의 연구 결과로 판단할 때 아티초크의FT
-IR
스펙트럼 다변량통계분석을 이용한 대사체 Fig. 3. PCA score plot (A) and loading value plot (B) of PCA analysis from FT-IR data of artichoke leaf. Dotted shapes represent significant FT-IR spectral region for metabolic discrimination of each artichoke plant. AG, Green Globe; AI, Intentid; AK, Cardoon; AM, Madrigal; AN, Nun 4011 AR; AO, Opera; AP, Imperial Star; AR, Romagna; AT, Tempo; AV, Violetto di chioggia.PC 1 (14.2%)
PC 2 (12.7%)
-0.4 0.0 0.4 0.8 350 450 550 650 700 750
-0.4 0.0 0.4
0.8 PC 1
PC 2
Wavelength (cm
-1)
Loading value
-0.2 -0.1 0.0 0.1 A 0.2
AO
AP AI
AT AN
AR
A B
Fig. 4. PLS-DA score plot of FT-IR data from artichoke leaf. Dotted shapes represent significant FT-IR spectral region for metabolic discrimination of each artichoke plant. AG, Green Globe; AI, Intentid; AK, Cardoon; AM, Madrigal; AN, Nun 4011 AR; AO, Opera; AP, Imperial Star; AR, Romagna; AT, Tempo; AV, Violetto di chioggia.
Comp 1
Comp 2
0
-10
-10 0 10 20
10 20 30
AG
AO
AP
AI AT AV
AK
AN AM
AR
수준에서 아티초크의 품종 구분이 가능함을 알 수 있었다. 또한, 현재까지 대사체 분석을 통해 아티초크에서 품종 구분을 실시 한 경우가 없어 비교가 불가능하지만, 다른 작물에서는 대사체 분석을 통해 품종 식별을 한 사례가 보고되어 있다. 특히, 두과 작물에서 식물 종 구분이 가능하다고 보고되었다(
Song et al
.,2012
). 두과작물의 경우 품종간 대사체 수준에서FT
-IR
스펙트 럼의 질적, 양적 차이가 품종을 구분하는데 중요한 역할을 하고, 이FT
-IR
스펙트럼의 부위들이 아티초크에서 중요하게 작용 한FT
-IR
스펙트럼과 일치하는 것을 볼 수 있다. 또한, 바위솔에서FT
-IR
스펙트럼 데이터를 이용한PLS
분석이 종간 유연관 계가 개체간에 대사물질에 대한 차이를 알 수 있었고, 분류학적 유연관계가 거의 일치하고,92
.9
% 높은 예측의 정확도를 나타 났다고 보고된 바 있다(Kim et al
.,2011
). 그리고 아프리칸 얌에서도 대사물질과 기능성성분이 관계가 높다고 보고된 바 있다 (Song et al
.,2014
).따라서 본 연구에서 확립된 대사체 수준에서 아티초크의 품종 식별 기술은 품종, 계통의 신속한 선발 수단으로 활용이 가능 할 것으로 기대되며 육종을 통한 품종개발 가속화에 기여 할 수 있을 것으로 예상된다.
초 록
본 연구는
FT
-IR
스펙트럼 데이터를 기반한 다변량통계분석을 이용한 대사체 수준에서 아티초크(Cynara cardunculus var
.scolymus L
.) 품종 구분하였다.FT
-IR
스펙트럼 데이터로부터PCA
(principal component analysis
),PLS
-DA
(partial least square discriminant analysis
) 그리고HCA
(hierarchical clustering analysis
) 분석을 실시하였다. 아티초크 품종들은1700
-1500
,1500
-1300
,1100
-950cm
-1 부위에서 대사체의 양적, 질적 패턴 변화가FT
-IR
스펙트럼상에서 나타났다.FT
-IR
스펙 트럼의1700
-1500cm
-1 부위는 주로Amide I
과II
을 포함하는 아미노산 및 단백질계열의 화합물들의 질적, 양적 정보를 나타 내고,1700
-1300cm
-1 부위는phosphodiester group
을 포함한 핵산 및 인지질의 정보가 반영이 되고,1100
-950cm
-1 부위는 단당류나 복합 다당류를 포함하는carbohydrates
계열의 화합물들이 질적, 양적 정보가 반영되는 부위이다.PCA
상에 나타난10
품종의 아티초크들은 품종간에 중첩이 많이 이뤄지는 모습을 나타냈다. 아티초크10
개의 품종 중에서 ‘Cardoon
’과 ‘Green Globe
’가 계통분류학적으로 유연관계가 낮고, 서로간에 대사체 수준의 차이가 뚜렷하게 나타나는 것으로 보아 대사체 수준에 서 마커 탐색에 가장 중요한 품종으로 작용할 것으로 판단된다.PLS
-DA
분석의 경우PCA
분석 보다 아티초크의 종간 식별 이 뚜렷하게 나타났다. 따라서 본 연구에서 확립된 대사체 수준에서 아티초크의 품종 식별 기술은 품종, 계통의 신속한 선발 수 단으로 활용이 가능할 것으로 기대되며 육종을 통한 품종개발 가속화에 기여 할 수 있을 것으로 예상된다.추가 주요어 : 대사체 분석, 부분최소제곱회귀(
PLSR
), 아티초크, 주성분분석(PCA
), 적외선분광광도계Fig. 5. Hierarchical dendrogram of FT-IR data from artichoke leaf. AG, Green Globe; AI, Intentid; AK, Cardoon; AM, Madrigal;
AN, Nun 4011 AR; AO, Opera; AP, Imperial Star; AR Romagna; AT, Tempo; and AV, Violetto di chioggia.
30 25 20 15 10 5 0
A. Intentid (AI) A.Romagna (AR) A. Tempo (AT) A. Violetto di chioggia (AV) A. Madrigal (AM) A. Cardoon (AK) A. Nun 4011 AR (AN) A. Opera (AO) A. Imperial Star (AP) A. Green Globe (AG)
Literature Cited