INTRODUCTION
The US Census Bureau reported that the country’s Hispanic and Asian populations have significantly grown in recent decades, and their populations are expected to grow approximately three times as large over the next 40 years (US Census Bureau 2012). As one reflection of this population trend, a popularity of ethnic restaurants appeared to be much more in- creasing than any other restaurant categories in the US (Tian & Wang 2010). Especially, Asian cuisines have gained significant popularity among non-Asi- ans who prefer hot and spicy taste or nutritious and healthful foods as well as the growing number of
Asian population in the US (Jang, Ha & Park 2012;
Liu & Jang 2009b). As such, while other ethnic cui- sines revealed their growth rates are relatively flat, Asian cuisine has seen a 41 percent growth in new product introductions from 2011 to 2013 (Mintel 2013).
Generally, ethnic restaurant research indicated that customers’ perception toward authenticity (food/
atmospherics), food quality, service quality, service- scape, and food safety contributes to customers’ fa- vorable evaluation of the restaurant (Clemes, Gan &
Sriwongrat 2013; Liu & Jang 2009). Providing value with regards to above service qualities that exceeds the costs of the dining experience is a prerequisite Culinary Science and Hospitality Research (October 2015)
Vol. 21, No. 5, pp. 180-191
Understanding the Effects of Hedonic and Utilitarian Values on Consumption Emotions and Customer Satisfaction
Ja-Hyun Song1 and Hyun-Jung Kim2
1School of Hotel and Restaurant Administration, Oklahoma State University, USA
2¶Dept. of Hotel & Tourism, Daegu University, Republic of Korea
ABSTRACT: This study attempted to identify the relationships among perceived value (hedonic and utili- tarian values), consumption emotions, and satisfaction. In addition, this study also tested the relationships of measurement items of these variables. The data were collected from American restaurant diners who have experienced any Asian restaurants within the last 30 days. A total of 435 responses was used for data analysis. Descriptive statistics, principal component analysis, reliability test, and regression analysis were utilized to analyze the data. The results found that hedonic value influenced positive emotions and satisfaction. Utilitarian value increased positive emotions and satisfaction while decreases negative emotions. In addition, positive emotions increased customer satisfaction; negative emotions decreased customer satisfaction. In the measurement level, traditional music, traditional aspects of food, and restau- rant layout of hedonic value influenced positive emotions and interior design had an impact on customer satisfaction. On the other hand, food taste and healthy food option of utilitarian value influenced positive emotions and satisfaction; only food taste was negatively related to negative emotions. Managerial im- plications were provided.
Keywords: hedonic value, utilitarian value, positive emotions, negative emotions, satisfaction
¶ Corresponding Author: Hyun-Jung Kim, Dept. of Hotel & Tourism, Daegu University, Jillyang, Gyeongsan, Gyeongbuk 38453, Republic of Korea, Tel. +82-53-850-6144, Fax. +82-53-850-6149, E-mail: [email protected]
for inducing greater customer satisfaction. It can be seen that customers who chose Asian restaurants pursue, of course, utilitarian value such as food tasti- ness or a variety of healthy food options, but they may consider more on hedonic value such as au- thentic dining experiences associated with corre- sponding Asian cultures (Ha & Jang 2012). It should be noted, however, that providing these values would not be sufficient to bring a competitive ad- vantage to a restaurant because customers today have become more demanding and are no longer willing to sacrifice any of these factors in their din- ing experience at the ethnic restaurant (Liu & Jang 2009; Ryu, Lee & Kim 2012). If so, what factors could create a point of difference associated with custom- er satisfaction, especially in the Asian restaurant con- text?
In response to this question, this study paid spe- cial attention to affective responses since customers evaluate their dining experiences and service en- counters based on not only cognitive assessment but also emotional responses (Bonnefoy-Claudet &
Ghantous 2013). Emotional reactions may be parti- cularly important in determining customer satisfac- tion especially in the ethnic restaurant context whe- re customers consume the services for more hedonic purposes compared to familiar western style restau- rants (Wakefield & Blodgett 1999).
By understanding values perceived by diners and their emotional responses, it would become easier to understand how ethnic restaurant practitioners will enhance customers’ satisfaction to retain their customers. Despite emotional reactions are inex- tricably linked to hedonic or utilitarian values per- ceived by customers, little research examined the re- lationships among perceived values, emotional re- sponses, and customer satisfaction in the ethnic res- taurant literature. This study tries to fill in the gap.
Therefore, the purposes of the study are: 1) to inves- tigate the effects of perceived value (i.e., hedonic value and utilitarian value) on consumption emo- tions (i.e., positive and negative emotional respon- ses) and customer satisfaction; 2) to examine the im- pacts of consumption emotions on customer sa- tisfaction; and 3) to identify the effects of measure- ment items for values on consumption emotions and satisfaction; 4) to investigate the effects of mea-
surement items for consumption emotions on satis- faction.
LITERATURE REVIEW
Perceived Value
Perceived value can be defined as “the consum- er’s overall assessment of the utility of a product based on perceptions of what is received and what is given (Zeithaml 1988, p. 14).” Batra and Ahtola (1990) proposed that consumers perceive value on their consumptions through both hedonic and utili- tarian aspects of consumption experiences. In speci- fic, the authors insisted consumers perceive value through both affective (hedonic) gratification from sensory attributes and utilitarian reasons related with expectations of consequences from functional and non-sensory attributes. While utilitarian value means a usefulness of consumption in instrumental, ration- al, and a means to an end, hedonic value represents an overall feeling in relation to non-instrumental, ex- periential, and affective behavior (Babin, Darden &
and Griffin 1994).
Consumption Emotions
Emotions refer to mental states of readiness that come from cognitive appraisals of events or thou- ghts (Bagozzi, Gopinath & Nyer 1999). While emo- tions are more intense and general, consumption emotions are more specific, unique, and less intense (Richins 1997). Consumption emotions refer to the
“set of emotional responses elicited specifically dur- ing product usage or consumption experiences”
(Westbrook & Oliver 1991, p. 85). Previous studies identified positive (ex. joy, relaxation) and negative (ex. upset, disappointment) dimensions of consump- tion related emotions (Westbrook 1987; Oliver 1993).
Customer Satisfaction
Expectancy-Disconfirmation theory suggested that the perceived discrepancy between the expectations the consumers have before the consumption and the perceived performance after consumption de- termine customer satisfaction (Oliver 1980). Positive disconfirmation occurs when perceived performance exceeds expectations, which results in consumer
satisfaction.
Several researchers have asserted that consumer satisfaction evaluations should incorporate emotio- nal reactions as well as cognitive evaluations (Kotler 2000; Oliver 2010). Kotler (2000) argued that sa- tisfaction is the affective states that individuals feel (i.e., pleasure or disappointment) resulting from the trade-off between perceived performance and their prior expectations.
Hypotheses Development
According to cognitive appraisal theory, indivi- duals experience discrete emotions based on their cognitive evaluation of specific situations, that is, their appraisals (Lazarus 1991). In other words, the cognitive assessment firstly occurs then emotions are elicited. Supporting this notion, Dalakas (2006) demonstrated that consumer appraisals of different events during a service encounter affect the type of emotional states. Sun (2011) also insisted that ap- praisals of utilitarian and hedonic dining experiences induced positive emotions. Based on these argu- ment, it is deduced that;
H1: Hedonic value is positively related to posi- tive emotions.
H2: Hedonic value is negatively related to ne- gative emotions.
H3: Utilitarian value is positively related to po- sitive emotions.
H4: Utilitarian value is negatively related to ne- gative emotions.
If consumers perceive value from consumption experiences, that is, if they consider a trade-off be- tween benefits and costs is positive, they will be sa- tisfied with the products or services they purchased.
The more a consumer perceives value of service, the more the consumer gets satisfied (Tam 2004). Ryu, Han, and Jang (2010) also identified the positive re- lationships between satisfaction and hedonic/utili- tarian values. Thus, it is deduced that;
H5: Hedonic value is positively related to con- sumer satisfaction.
H6: Utilitarian value is positively related to con- sumer satisfaction.
When satisfaction is understood as the affective states resulted from the discrepancy between per- formance and expectations, it is reasonable to infer that consumptions emotions such as joy or dis- appointment driven from shopping experiences can directly influence customer satisfaction. Westbrook (1987) found that affective (positive and negative) responses to product consumption experiences in- fluenced customer satisfaction. Oliver (1993) also su- ggested the similar results. Therefore, it is deduced that;
H7: Positive emotions are positively related to consumer satisfaction.
H8: Negative emotions are negatively related to consumer satisfaction.
METHOD
The measurement for perceived value (ten items) comprised items from Ha and Jang (2010)’s study, including five items for each hedonic value and utili- tarian value. For the measure of consumption emo- tions, a measurement based on the works of Jang and Namkung (2009) and Yi and Baumgartner (2004) was developed by considering positive and negative emotions that can be induced in the restaurant con- text. As a result, a total of eight items were catego- rized as either positive or negative emotions. More- over, customer satisfaction was measured by four items borrowed from Oliver (1980). All items were measured for the degree of agreement or disagree- ment on a seven-point Likert-type scale (1=strongly disagree, 7=strongly agree). Socio-demograhic cha- racteristics such as gender, age, educational level, annual household income, and ethnicity were asked as well as frequency of visit of the most recently vis- ited Asian restaurant and type of the restaurant.
The target population of the study was American diners whose email addresses are included in an email database of American travelers purchased fr- om internet. In a large pool of American traveler’s database, only those who have experienced any Asian restaurants within the last 30 days were con- sidered as the study samples. Random number was given to these e-mail addresses and a total of 650,950 e-mails were randomly selected for this
study. The designated website for the online survey, Qualtrics.com, was used to distribute the self-ad- ministered questionnaire, including an invitation let- ter that contained a hyperlink to access the survey.
The survey was conducted for three weeks from April 7th to April 28th, 2014. Out of 320,341 e-mails successfully delivered, 449 responses were received.
After data screening, 435 responses were used for data analysis. Descriptive statistics, principal compo- nent analysis, reliability test, and regression analysis were utilized to analyze the data using SPSS 21.0.
RESULTS
Sample
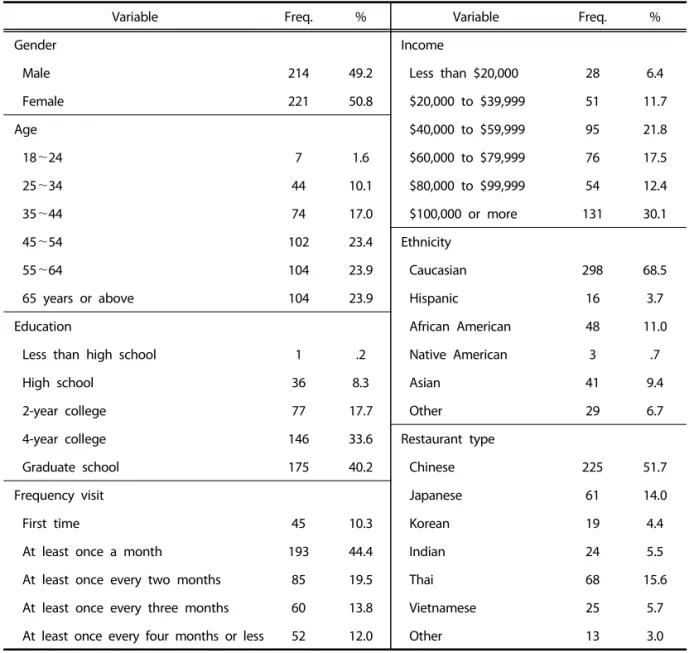
Table 1 presents the socio-demographic charac- teristics of the sample, showing that 49.2% (n=214) were male and 50.8% (n=221) were female (Table 1).
Approximately 70% of the respondents were 45 years or older (71.3%). Most respondents had recei- ved two-year college education or higher (91.5%). A little less than one third of the respondents reported an annual household income of $100,000 or more (30.1%). The majority of the respondents were Caucasian (68.5%), followed by African American (11.0%). More than half of the respondents reported that they recently visited a Chinese restaurant (51.7
Variable Freq. % Variable Freq. %
Gender Income
Male 214 49.2 Less than $20,000 28 6.4
Female 221 50.8 $20,000 to $39,999 51 11.7
Age $40,000 to $59,999 95 21.8
18~24 7 1.6 $60,000 to $79,999 76 17.5
25~34 44 10.1 $80,000 to $99,999 54 12.4
35~44 74 17.0 $100,000 or more 131 30.1
45~54 102 23.4 Ethnicity
55~64 104 23.9 Caucasian 298 68.5
65 years or above 104 23.9 Hispanic 16 3.7
Education African American 48 11.0
Less than high school 1 .2 Native American 3 .7
High school 36 8.3 Asian 41 9.4
2-year college 77 17.7 Other 29 6.7
4-year college 146 33.6 Restaurant type
Graduate school 175 40.2 Chinese 225 51.7
Frequency visit Japanese 61 14.0
First time 45 10.3 Korean 19 4.4
At least once a month 193 44.4 Indian 24 5.5
At least once every two months 85 19.5 Thai 68 15.6
At least once every three months 60 13.8 Vietnamese 25 5.7
At least once every four months or less 52 12.0 Other 13 3.0
Table 1. Socio-demographic characteristics (N=435)
Items Factor loading
Cronbach's alpha
Variance explained
(%) Perceived value
- Hedonic value (4.187a) .881 34.327
The interior design of this restaurant made me feel that culture. .797 The music that they played in this restaurant entertained me. .767 The traditional aspects of the foods made me feel like I was escaping from
ordinary life. .747
The mood of this restaurant made me feel like I was in an exotic place. .884 The layout, facilities, and aesthetics of this restaurant were fun and unique
to me. .856
- Utilitarian value (2.043) .774 27.970
The cost of food was reasonable in this restaurant. .629
The foods I had were tasty, so I enjoyed them. .804
The food portion in this restaurant was enough, satisfying my hunger. .846 I liked a variety of menu choices in this restaurant. .747 I liked the healthy food options in this restaurant. .607 Consumption emotions
- Positive emotions (4.424) .912 43.282
When I think of eating out at this restaurant, I feel joy. .877 When I think of eating out at this restaurant, I feel excited. .873 When I think of eating out at this restaurant, I feel relaxed. .871 When I think of eating out at this restaurant, I feel refreshed. .890
- Negative emotions (2.235) .948 .947 39.953
When I think of eating out at this restaurant, I feel upset. .928 When I think of eating out at this restaurant, I feel disappointed. .945 When I think of eating out at this restaurant, I feel regret. .848 When I think of eating out at this restaurant, I feel bored.
Customer satisfaction (3.564) .959 89.112
My choice to dine at this restaurant was a wise one. .922 I was happy with the dining experience in this restaurant. .959 Overall, I was satisfied with the dining experience in this restaurant. .952 I think I did the right thing when I decided to dine at this restaurant. .941
a eigenvalue.
Table 2. The results of principal component analyses
%), followed by a Thai restaurant (15.6%). In addi- tion, 44.4% of the respondents were visiting a partic- ular Asian restaurant at least once a month.
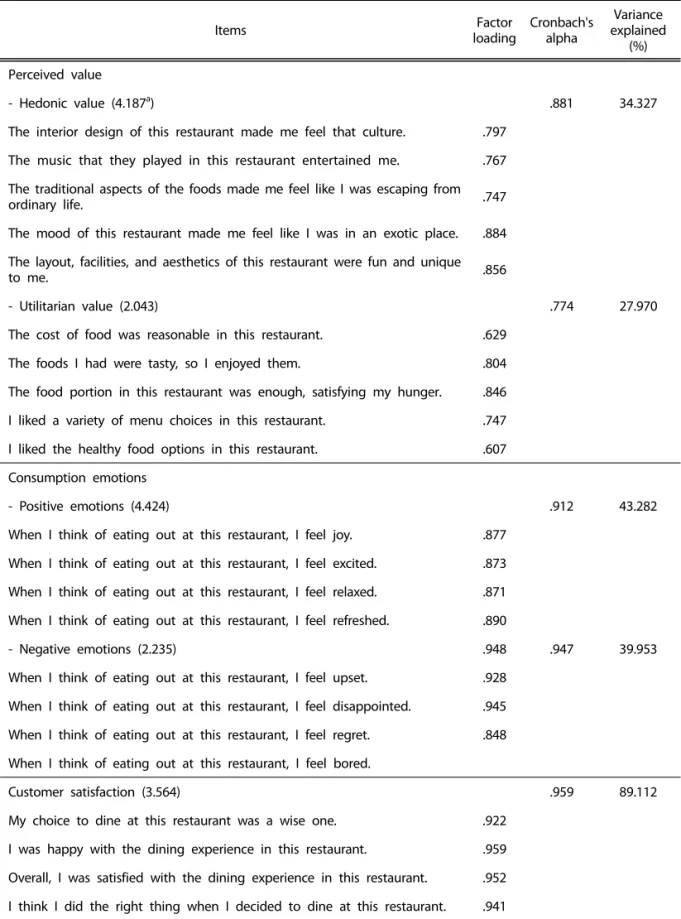
The Results of Principal Component Analyses The principal component analyses with varimax rotation were conducted to test applicability of the perceived value dimensions, consumption emotions dimensions, and satisfaction (Table 2). The results of the perceived value dimensions revealed a two-fac- tor solution with the clear loadings higher than .4.
The factors accounted for 62.3% of total variance ex- plained with Cronbach's alpha of .881 and .774, respectively. Factor 1 was named as hedonic value;
factor 2 utilitarian value. The results of the con- sumption emotions dimensions identified a two-fac- tor solution as well. The factors accounted for 83.2%
of total variance explained with Cronbach's alpha of .912 and .947, respectively. Factor 1 was named as positive emotions; factor 2 negative emotions. La- stly, the principal component analysis generated one factor solution for satisfaction with 89.1% of total variance explained and with Cronbach's alpha of .959. The factor was named as satisfaction.
The Relationships among Perceived Value, Con- sumption Emotions, and Satisfaction
Dependent V. Independent V. B β t Sig. Statistics
Positive emotions
Constant —.221 —.723 .470
R2=.483, Adj. R2=.480 F=202.545, Sig.=.000
Hedonic value .423 .464 12.582 .000
Utilitarian value .562 .380 10.300 .000
Negative emotions
Constant 4.574 13.508 .000
R2=.152, Adj. R2=.148 F=38.758, Sig.=.000
Hedonic value —.031 —.039 —.829 .407
Utilitarian value —.477 —.374 —7.918 .000
Satisfaction
Constant 1.049 3.709 .000
R2=.416, Adj. R2=.413 F=154.302, Sig.=.000
Hedonic value .157 .198 5.042 .000
Utilitarian value .705 .548 13.991 .000
Satisfaction
Constant 4.428 23.980 .000
R2=.503, Adj. R2=.500 F=219.199, Sig.=.000
Positive emotions .423 .486 13.556 .000
Negative emotions —.382 —.379 —10.563 .000 Table 3. The results of regression analyses
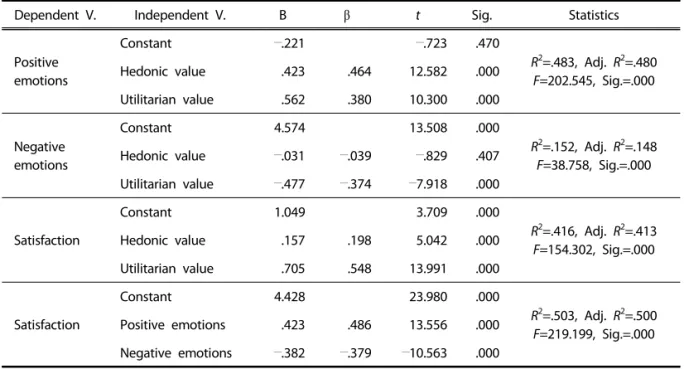
A series of multiple regression analysis were con- ducted to analyze the data (Table 3). The results re- vealed that both hedonic and utilitarian values po- sitively influenced positive emotions, supporting hy- potheses 1 and 3. Hedonic value (β=.464) had a st- ronger impact on positive emotion than utilitarian value. On the other hand, the results showed that only utilitarian value significantly influenced nega- tive emotions with a negative direction, supporting hypothesis 4 but rejecting hypothesis 2. Supporting hypotheses 5 and 6, hedonic and utilitarian values significantly influenced satisfaction, with a stronger impact of utilitarian value (β=.548) than hedonic val- ue (β=.198). In addition, satisfaction was influenced positively by positive emotions and negatively by negative emotions, supporting hypotheses 7 and 8.
Positive emotions (β=.486) had a stronger impact on satisfaction than negative emotions (β=—.379).
The Effects of Perceived Value on Consumption Emotions and Satisfaction
Items of each perceived value (i.e., hedonic and utilitarian values) were used as an independent vari- ables and the mean value of each emotion and sa- tisfaction were used as dependent variables.
Table 4 and Table 5 demonstrate the result of the effects of perceived value on emotions and satis-
Dependent V. Independent V. B β t Sig. Statistics
Positive emotions
Constant .277 .757 .450
R2=.340, Adj. R2=.333
F=44.452, Sig.=.000
Food cost .082 .080 1.771 .077
Food taste .472 .365 6.810 .000
Food portion —.102 —.079 —1.446 .149
Menu variety .114 .101 1.925 .055
Healthy food option .223 .265 5.746 .000
Negative emotions
Constant 4.954 14.378 .000
R2=.213, Adj. R2=.204
F=23.355, Sig.=.000
Food cost .008 .009 .187 .852
Food taste —.455 —.408 —6.977 .000
Food portion —.010 —.009 —.146 .884
Menu variety —.066 —.068 —1.186 .236
Healthy food option —.020 —.027 —.543 .587
Satisfaction
Constant .812 2.864 .004
R2=.474, Adj. R2=.468
F=77.656, Sig.=.000
Food cost .025 .028 .693 .489
Food taste .605 .538 11.254 .000
Food portion .087 .077 1.593 .112
Menu variety —.005 —.005 —.105 .916
Healthy food option .128 .174 4.231 .000
Table 5. The effects of utilitarian value on consumption emotions and satisfaction
Dependent V. Independent V. B β t Sig. Statistics
Positive emotions
Constant 2.528 15.287 .000
R2=.377, Adj. R2=.370
F=52.156, Sig.=.000
Interior design .042 .052 .956 .340
Traditional music .100 .136 2.678 .008
Traditional aspects of food .245 .328 6.344 .000
Mood .042 .056 .831 .406
Layout .121 .164 2.623 .009
Satisfaction
Constant 4.481 26.705 .000
R2=.161, Adj. R2=.152
F=16.592, Sig.=.000
Interior design .108 .155 2.473 .014
Traditional music —.007 —.011 —.188 .851
Traditional aspects of food .110 .170 2.829 .005
Mood .031 .048 .608 .543
Layout .073 .114 1.569 .117
Table 4. The effects of hedonic value on consumption emotions and satisfaction
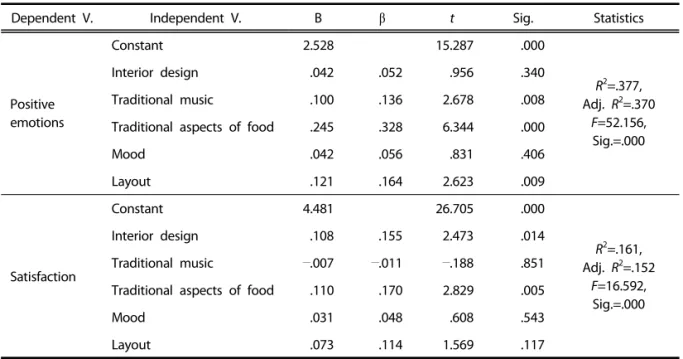
faction. Among five items of hedonic value, tradi- tional music, traditional aspects of food, and restau- rant layout were significant factors to induce posi- tive emotions. The effects of measurement items of hedonic value on negative emotions were not inves- tigated because of the non-significant relationship between hedonic value and negative emotions sh- own in Table 3. In addition, customer satisfaction was influenced by interior design and traditional as- pects of food in Asian restaurant setting.
In terms of utilitarian value, positive emotion was induced through food taste and healthy food op- tion. Food taste was the only items that affected negative emotions. Satisfaction was significantly in- fluenced by food taste and healthy food option.
The Effects of Consumption Emotions on Satis- faction
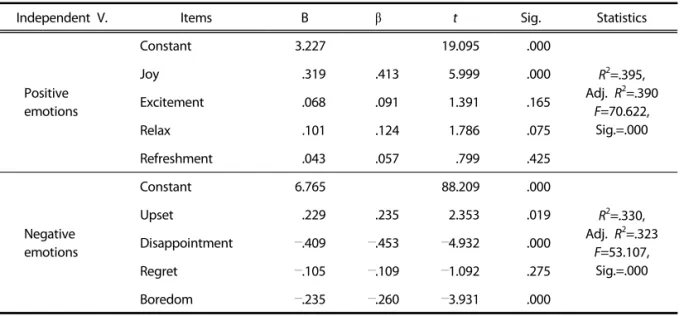
Table 6 shows the effect of each emotion (i.e., positive and negative emotions) on satisfaction. Ame- rican consumers who chose Asian restaurants were satisfied when they felt joy (p<.001)and relax (p<.10) from their dining experiences. In terms of negative emotion, all items except for regret (upset, dis- appointment, and boredom) significantly influenced consumer satisfaction. Among these factors, dis- appointment and boredom had negative effects on consumer satisfaction, whereas upset had a positive effect on consumer satisfaction. The positive effect means that consumers are more satisfied if they feel
more upset, which does not make any sense.
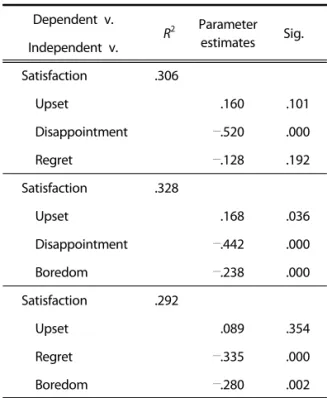
Suppressor effect could explain this unexpected result (Cohen & Cohen 1983). Ha and Jang (2010, p.
8) explained that “ A suppressor effect often hap- pens when one independent variable is correlated much lower with a dependent variable than the oth- er independent variables in the regression model.”
The correlation between upset and satisfaction was
—.453. Other correlations of the negative emotion items were —.549 (disappointment), —.485 (regret), and —.518 (boredom), which were all higher than upset. As stated, correlation between upset and sa- tisfaction appeared negative value. However, when other three items were included together in the model, upset changed significantly positive at an al- pha level of .05. This indicates that the negative emotion of upset itself had a negative influence on consumer satisfaction, however, when other nega- tive emotion items were considered together, it had a positive effect on consumer satisfaction. Specifi- cally, disappointment and boredom acted as sup- pressors in the model (Table 7).
DISCUSSION AND CONCLUSION
This study attempted to identify the relationships among perceived value (hedonic and utilitarian val- ues), consumption emotions (positive and negative emotions), and satisfaction. Along with the relation- ships among these concepts, this study also tested
Independent V. Items B β t Sig. Statistics
Positive emotions
Constant 3.227 19.095 .000
R2=.395, Adj. R2=.390
F=70.622, Sig.=.000
Joy .319 .413 5.999 .000
Excitement .068 .091 1.391 .165
Relax .101 .124 1.786 .075
Refreshment .043 .057 .799 .425
Negative emotions
Constant 6.765 88.209 .000
R2=.330, Adj. R2=.323
F=53.107, Sig.=.000
Upset .229 .235 2.353 .019
Disappointment —.409 —.453 —4.932 .000
Regret —.105 —.109 —1.092 .275
Boredom —.235 —.260 —3.931 .000
Table 6. The effects of consumption emotions on satisfaction
the relationships of measurement items of perceived value, consumption emotions, and satisfaction. The results found that hedonic value influenced positive emotions and satisfaction. Utilitarian value increased positive emotions and satisfaction while decreases negative emotions. These results supported the pre- vious studies of Dalakas (2006), Sun (2011), Tam (2004), Ryu, Han, and Jang (2010). In addition, posi- tive emotions increased customer satisfaction; nega- tive emotions decreased customer satisfaction, sup- porting the previous studies of Westbrook (1987) and Oliver (1993).
This study investigated further to identify the spe- cific influences of measurement items on various de- pendent variables. The results showed that tradi- tional music, traditional aspects of food, and restau- rant layout of hedonic value influenced positive emotions and interior design had a positive impact on customer satisfaction. On the other hand, food taste and healthy food option of utilitarian value in- fluenced positive emotions and satisfaction; only food taste was negatively related to negative emo- tions.
The results of the study suggested that hedonic and utilitarian values have unique contributions on positive and negative emotions and satisfaction. Es-
pecially, utilitarian value had more power to predict consumption emotions and satisfaction than he- donic value which did not influence negative emo- tion at all and had a weaker impact on satisfaction.
This may be caused because hedonic value is often created from pleasure-oriented dining attributes while utilitarian value is created from functional at- tributes of consumption experiences (Chernev 2004).
Generally, pleasure-oriented dining attributes are closely related to 'hope-to-meet' value whereas func- tional attributes represent 'must-meet' value. That is, unfulfilled 'must-meet' value generates negative emotions while 'hope-to-meet' value is more im- portant to increase positive emotions. This implies that Asian restaurateurs should provide more utili- tarian value such as tasty food and various options for nutritious meals to customers in order to elicit desired customer's emotions and satisfaction. For advertising new menu items as an example, should an Asian restaurateur put out an advertisement that focuses on functional benefits (i.e., tasty foods or fresh and healthy ingredients) to allure more cus- tomers to visit their restaurant. Furthermore, they might appeal to customers by using the healthy ima- ges of Asian foods than by using an authentic fa- cility layout or interior.
This study also supported that positive and nega- tive emotions are the prerequisite to achieve cus- tomer satisfaction in Asian restaurants in the US. To increase positive emotions, restaurateurs should con- sider unique decorations of foods reflecting the cor- responding culture. For example, decorating foods using particular ingredients or serving foods on the authentically designed dishes or tableware could be regarded as some ways to provide hedonic value in order to strengthen customers’ positive emotions.
Moreover, serving foods in an authentic manner (e.g., cooking in front of the customers as soon as they order or allowing the customers to grill BBQ by themselves at the table) also could enhance custom- ers’ perceptions of hedonic value and maximize po- sitive emotions (Ha & Jang 2010), which eventually increases customer satisfaction.
Furthermore, restaurateurs should recognize that minimizing negative emotions is as important as ma- ximizing positive emotions. Negative emotions are evoked from insufficient utilitarian aspects of cus- Dependent v.
R2 Parameter estimates Sig.
Independent v.
Satisfaction .306
Upset .160 .101
Disappointment —.520 .000
Regret —.128 .192
Satisfaction .328
Upset .168 .036
Disappointment —.442 .000
Boredom —.238 .000
Satisfaction .292
Upset .089 .354
Regret —.335 .000
Boredom —.280 .002
Table 7. Identifying a suppressor effect
tomer value. This finding suggests that customers’
negative emotional reactions can be managed th- rough serving quality foods at a reasonable price. All restaurants must offer food that clients perceive to be delicious in order to be successful, and Asian res- taurants are no exception. In doing so, they not only heighten positive emotions but also prevent ne- gative emotions.
There are a few limitations in this study. First is a low response rate, related to the online survey method. Low response rate could result in a non-re- sponse bias. Therefore, the results should be in- terpreted with caution. Second, this study requested respondents’ perceptions and emotions toward their dining experiences regardless of the dining segment of Asian restaurants. Thus, the findings of each Asian restaurant should be interpreted and generalized cautiously depending on the segment (i.e., fast ser- vice, fast casual dining, casual dining, or fine dining restaurants). Lastly, this study did not investigate the roles of socio-demographic characteristics on the re- lationships among perceived values, emotions, and satisfaction. Further studies should examine if these characteristics can be conditional variables to under- stand these relationships.
REFERENCES
Babin BJ, Darden WR, Griffin M (1994). Work and/or fun: measuring hedonic and utilitarian shopping value. Journal of Consumer Research 20(4): 644- 656.
Bagozzi RP, Gopinath M, Nyer PU (1999). The role of emotions in marketing. Journal of the Acade- my of Marketing Science 27(2):184-206.
Batra R, Ahtola OT (1990). Measuring the hedonic and utilitarian sources of consumer attitudes. Mar- keting Letters 2(2):159-170.
Bonnefoy-Claudet L, Ghantous N (2013). Emotions' impact on tourists' satisfaction with ski resorts:
The mediating role of perceived value. Journal of Travel & Tourism Marketing 30(6):624-637.
Chernev A (2004). Goal-attribute compatibility in con- sumer choice. Journal of Consumer Psychology 14(1):141-150.
Clemes MD, Gan C, Sriwongrat C (2013). Consumers' choice factors of an upscale ethnic restaurant.
Journal of Food Products Marketing 19(5):413- 438.
Cohen J, Cohen P (1983). Applied Multiple Regre- ssion/Correlation for the Behavioral Sciences. Hi- llsdale, NJ: Erlbaum.
Dalakas V (2006). The effect of cognitive appraisals on emotional responses during service encoun- ters. Services Marketing Quarterly 27(1):23-41.
Ha J, Jang S (2010). Perceived values, satisfaction, and behavioral intentions: The role of familiarity in Korean restaurants. International Journal of Hos- pitality Management 29(1):2-13.
Ha J, Jang S (2012). The effects of dining atmos- pherics on behavioral intentions through quality perception. Journal of Services Marketing 26(3):
204-215.
Jang S, Ha J, Park K (2012). Effects of ethnic au- thenticity: Investigating Korean restaurant cus- tomers in the US. International Journal of Hospit- ality Management 31(3):990-1003.
Jang S, Namkung Y (2009). Perceived quality, emo- tions, and behavioral intentions: Application of an extended Mehrabian-Russell model to res- taurants. Journal of Business Research 62(4):451- 460.
Kotler P (2000). Marketing Management: The Millen- nium Edition. Upper Saddle River, NJ: Prentice- Hall.
Lazarus RS (1991). Cognition and motivation in emo- tion. American Psychologist 46(4):352.
Liu Y, Jang S (2009). Perceptions of Chinese restau- rants in the US: What affects customer satisfac- tion and behavioral intentions? International Journal of Hospitality Management 28(3):338- 348.
Mintel (2013). Ethnic restaurants - US - January 2013.
London: Mintel Group.
Oliver RL (1980). A cognitive model of the ante- cedents and consequences of satisfaction deci- sions. Journal of Marketing Research 17(4):460- 469.
Oliver RL (1993). Cognitive, affective, and attribute bases of the satisfaction response. Journal of Consumer Research 20(3):418-430.
Oliver RL (2010). Satisfaction: A Behavioral Perspec- tive on the Consumer (2nd ed.). NY: M. E. Shar- pe.
Richins ML (1997). Measuring emotions in the con- sumption experience. Journal of Consumer Re- search 24(2):127-146.
Ryu K, Han H, Jang S (2010). Relationships among hedonic and utilitarian values, satisfaction and behavioral intentions in the fast-casual restau- rant industry. International Journal of Contempo- rary Hospitality Management 22(3):416-432.
Ryu K, Lee HR, Kim WG (2012). The influence of the quality of the physical environment, food, and service on restaurant image, customer perceived value, customer satisfaction, and behavioral in- tentions. International Journal of Contemporary Hospitality Management 24(2):200-223.
Sun B (2011). An integrative value-based consumer behavior model in the restaurant industry: As- pects of regulatory focus theory and cognitive appraisal theory. (3459958 Ph.D.):Oklahoma Sta- te University, Ann Arbor. ABI/INFORM Global database.
Tam JL (2004). Customer satisfaction, service quality and perceived value: An integrative model. Jour- nal of Marketing Management 20(7-8):897-917.
Tian RG, Wang CH (2010). Cross-cultural satisfaction at a Chinese restaurant: The implications to Chi- na foodservice marketing. International Journal of China Marketing 1(1):60-72.
US Census Bureau (2012). U.S. Census Bureau projec- tions show a slower growing, older, more di- verse nation a half century from now. Retrieved December 20, 2014, from https://www.census.
gov/newsroom/releases/archives/population/
cb12-243.html
Wakefield KL, Blodgett JG (1999). Customer response to intangible and tangible service factors. Psy- chology & Marketing 16(1):51-68.
Westbrook RA (1987). Product/consumption-based affective responses and postpurchase processes.
Journal of Marketing Research 24(3):258-270.
Westbrook RA, Oliver RL (1991). The dimensionality of consumption emotion patterns and consumer satisfaction. Journal of Consumer Research 18(1):
84-91.
Yi S, Baumgartner H (2004). Coping with negative emotions in purchase-related situations. Journal of Consumer Psychology 14(3):303-317.
Zeithaml VA (1988). Consumer perceptions of price, quality, and value: a means-end model and syn- thesis of evidence. The Journal of Marketing 52 (3):2-22.
Received: 11 September, 2015 Revised: 5 October, 2015 Accepted: 20 October, 2015
쾌락적 가치와 실용적 가치가 소비감정과 고객만족에 미치는 영향에 관한 연구
송자현1) 김현정2)
1)오클라호마 주립대학교 호텔외식학과, 2)¶대구대학교 호텔관광학과
국문초록
본 연구의 목적은 지각된 가치(쾌락적 가치, 실용적 가치)가 소비감정과 고객만족에 미치는 영향을 살펴보고 나아 가 각 개념들의 측정변수 사이에 내재한 관계를 파악하는데 있다. 연구 자료는 최근 한 달간 아시아 레스토랑을 방문
한 경험이 있는 미국인들을 대상으로 수집하였으며, 총 435개의 자료를 가지고 기술통계분석, 요인분석, 신뢰도분석,
회귀분석을 실시하였다. 분석결과 쾌락적 가치와 실용적 가치 모두 긍정적 감정과 고객만족에 영향을 미치는 것으로
나타났으나, 실용적 가치만이 부정적 감정에 영향을 미치는 것으로 나타났다. 측정변수 간의 관계를 분석한 결과 쾌락적 가치인 전통음악, 전통음식, 레스토랑 배치가 긍정적 감정에 영향을 미쳤으며, 인테리어 디자인은 고객만족에
영향을 미치는 것으로 나타났다. 반면 실용적 가치인 음식의 맛과 건강한 음식종류는 긍정적 감정과 고객만족에 영향
을 미쳤으며, 음식의 맛만이 부정적 감정에 영향을 미치는 것으로 밝혀졌다. 이에 대한 실무적 시시점을 결론에 제시 하였다.
주제어: 쾌락적 가치, 실용적 가치, 긍정적 감정, 부정적 감정, 고객만족