Quantitative Assessment of Left Atrial Functional Changes in Patients with Atrial Fibrillation by Tissue Doppler Strain and 2-Dimensional Strain Imaging
8
0
0
전체 글
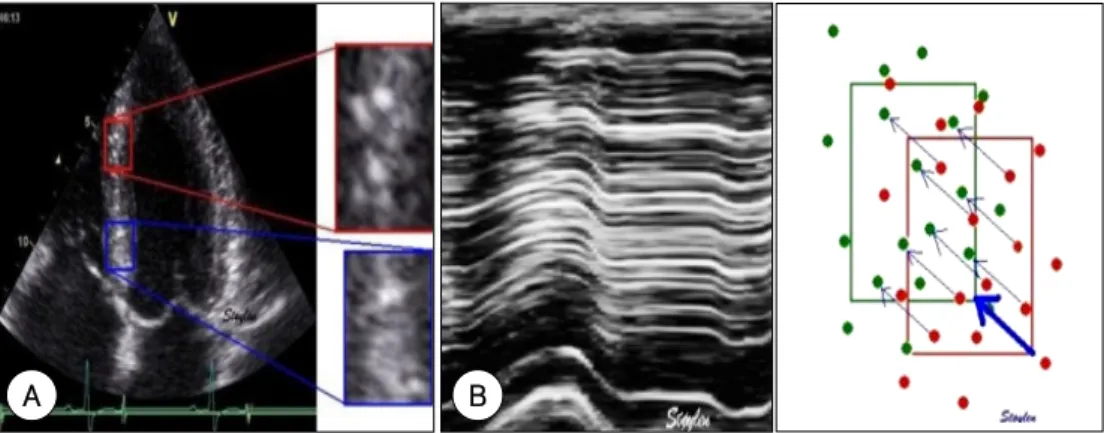
(2) Kyoung Im Cho, et al:Left Atrial Functional Changes in Atrial Fibrillation·787. amber size, as estimated by echocardiography, and lone paroxysmal AF.3) The blood flow velocity during atrial contraction, the peak mitral inflow A wave velocity, its velocity time integral and the atrial emptying fraction have all been used as traditional surrogate markers of atrial function. 4) Doppler echocardiography is one of the most commonly used modalities to assess atrial function and to estimate the hemodynamic difference between the atrium and the ventricle, which indirectly reflects atrial function. However, the atrial mechanical function can not be directly assessed by this method. Tissue Doppler imaging (TDI) has recently been employed as a sensitive and reproducible tool for assessing cardiac function.5) The TDI-derived indices have proven to be valuable in experimental, animal and clinical settings for assessing both the regional and global functions of the heart.5-7) Therefore, TDI may be a useful non-invasive tool for assessing atrial function, and also to investigate the relation between the right(RA) and left(LA) atrial mechanical function. We present here a novel method for the real-time quantitative assessment of myocardial function, and this is based on new software for conducting quantitative echocardiography. This method allows rapid, accurate and simple determination of the global and regional myocardial parameters, i.e., the strain and strain rate. Therefore, we assessed the relevance of the TDI parameters and the 2 dimensional strain for quantitatively assessing the LA in both the control subjects and the AF patients.. Subjects and Methods Study population We studied 15 patients who suffered from chronic AF and 15 patients who suffered from paroxysmal AF. All the paroxysmal AF patients had a short time interval(<2 days) from the last episode of AF and all the patients had normal conventional scores for their wallmotion; this was based on the standards of the American Society of Echocardiography. The exclusion criteria were atrial flutter, significant valvular disease, atrial and/or ventricular thrombosis, significant spontaneous echo contrast, atrial septal defect and a history of ischemic heart disease or decreased left ventricular (LV) function (an ejection fraction <50%). Because antiarrhythmic therapy may have a negative inotropic effect on the atrium, we also excluded those patients who were receiving antiarrhythmic treatment. As a referent group, we studied 15 age-matched healthy individuals who had no history of cardiovascular disease, diabetes and dyslipidemia, and they had a normal resting ECG and blood pressure. An informed consent for the physiologic assessment was obtained from all the patients. The demographic data were recorded, including age, gender. and the cardiovascular risk factors.. Echocardiographic evaluation A standard 2D and strain echocardiographic examination was performed on all subjects, with the subjects lying in the left lateral decubitus position, and we used a 3.5-MHz transducer on Vivid 7 Dimension ultrasound equipment(General Electric, Horten, Norway). A complete 2-dimensional and Doppler echocardiographic examination was performed for determining the sinus rhythm. The LA diameter was measured during systole along the parasternal long-axis view from the 2D guided M-mode tracing. The LA volume was calculated from the apical 4- and apical 2-chamber zoomed views of the LA with using the biplane method of disks, and the LA volume was divided by the body mass index to obtain the LA volume index. The LV global systolic function was evaluated, via the M-mode method, by the LV ejection fraction. The mitral inflow velocity was obtained by performing pulsed wave Doppler sampling at the tips of the mitral leaflets from the apical four-chamber at a sweep speed of 100 mm/s. Color doppler imaging and offline analysis. Images from the apical 4-chamber were obtained at end-expiratory apnea and they were stored in a cineloop format for the subsequent offline analysis. Three heartbeats were collected from each view and then these were analyzed off-line with using an EchoPAC Dimension system(General Electric, Horten, Norway). The longitudinal directional changes(measured from the apical views) for the atria are best described by the term “rate of lengthening” in systole(the positive strain rate value) and the term “rate of shortening” in diastole(the negative strain rate value). The longitudinal peak strain and the strain rate were obtained, by the tissue Doppler strain, from 2 different areas of the basal segments of the LA free wall and also the interatrial septum in the apical 4 chamber view(Fig. 1A). For the longitudinal measurements, a computation area of 9× 2 mm with an elliptical shape was chosen.6) For the patients with PAF, the atrial motions were recorded simultaneously via the electrocardiography(ECG) in lead II during sinus rhythm. The mean peak systolic stain rate(Sm-SR), the peak early diastolic strain rate (Em-SR) and the peak late diastolic(Am-SR) strain rate were measured at the inter-atrial septum in the apical 4 chamber view by using the 2-dimensional strain imaging(Fig. 1B). The strain rate and strain curves were calculated for all the patients over 3 cardiac cycles and then they were averaged to obtain the mean strain rate and mean strain curves over 1 mean RR interval. End diastole was defined as the ECG R peak, and end systole was defined as the end of the ECG T wave. The peak positive systolic and early diastolic values were calculated.
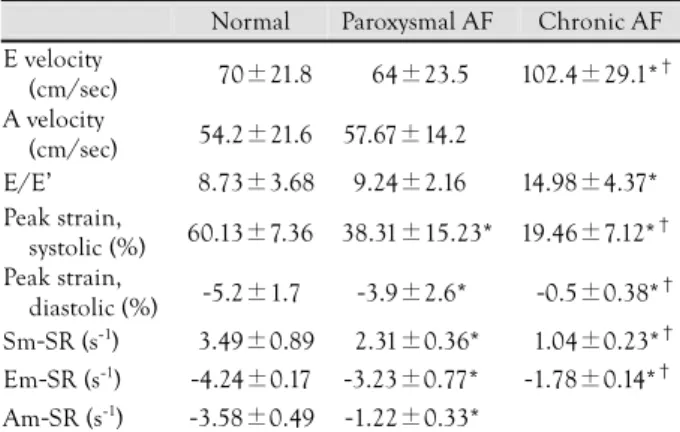
(3) 788·Korean Circulation J 2006;36:786-793. truction of the temporal movements and deformations. We have observed that the ultrasound tissue images contain many small elements that are natural acoustic markers, and these move together with the tissue and do not significantly change their pattern between adjacent frames. These natural acoustic markers are stable acoustic speckles that are statistically equally distributed within the myocardium(Fig. 2A). Each marker can be identified and accurately followed during several consecutive frames(Fig. 2B). The geometric shift of each element represents the local tissue movement. The relative changes of the mutual distance between neighboring elements reflect the tissue’s contraction/relaxation, that is, the 2-dimensional strain rate and strain. The software was dependant on the quality of the high-resolution images and it was applied with harmonic imaging.. from the extracted curve. The frame rate for the TDI based-strain and the 2-dimensional strain was 84 to 106 frames/s and 60 frames/s, respectively. The interobserver variability and intraobserver variability were tested via an independent analysis that was done by two independent observers and also by repeated measurement of these segments at another occasion by the same observer. The main reason for determining the interobserver variability was the different locations of the sample volumes. Once a sample volume was placed on a mutually agreed location within the myocardium, then the measurements became virtually identical. Selection of the representative tissue patterns. The 2-dimensional strain is not based on TDI; so to estimate the tissue movement, we used frame-by-frame image tracking. This is a proven approach for recons-. Sm-SR. Sm-SR Peak systolic strain. Am-SR Em-SR. Am-SR Em-SR. A. B. C. Fig. 1. The longitudinal peak strain and strain rate were obtained from 2 different areas of the basal segments of the LA free wall and the inter-atrial. septum in the apical 4 chamber view by using the tissue Doppler strain (A, B), the mean peak systolic strain rate (Sm-SR), the peak early diastolic strain rate (Em-SR) and the peak late diastolic strain rate (Am-SR); these were also measured at the inter-atrial septum in the apical 4 chamber view by using the 2-dimensional strain (C).. A. B. Fig. 2. Typical speckle patterns in the myocardium. The two enlarged areas show completely different speckle patterns, which creates a unique pattern for any selected region that can identify the region and hence, the displacement of the region in the next frame (A). When the speckle pattern is followed via the M-mode in the wall, then the alternating bright and dark points are seen as alternating bright and dark lines, which show the true myocardial motion (B). Adapted from the strain rate imaging by Asbjørn Støylen, MD., with the permission of the publisher..
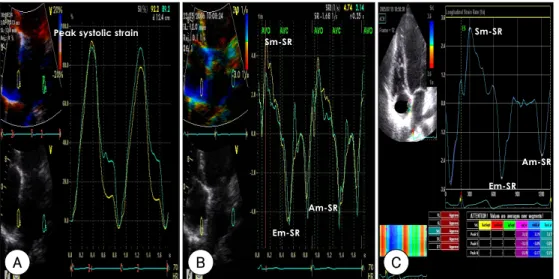
(4) Kyoung Im Cho, et al:Left Atrial Functional Changes in Atrial Fibrillation·789. Table 1. Demographic characteristics. Normal Age LVDd IVSd EF RWT. 050.7±8.5 046.8±4.5 009.4±0.7 065.4±4.7 00.40±0.03. Paroxysmal AF 0052.3±4.8 0047.9±3.4 0010.5±0.3 0064.5±3.2 000.42±0.05. Chronic AF 055.4±9.5 049.8±3.3 0009.1±0.8 62.4±2.7 000.41±0.04. LVMI 99.87±15.48 100.89±13.94 105.86±12.0 LA diameter 37.85±3.24 038.98±3.61 047.41±4.18*† LA volume 24.42±8.25 025.48±7.68 38.54±12.56*† index Values are means±SDs. *: p<0.05 vs. control, †: p<0.05 vs. paroxysmal AF. AF: atrial fibrillation, LVDd: left ventricular diastolic dimension, IVSd: interventricular septal thickness, EF: ejection fraction, RWT: relative wall thickness, LVMI: left ventricular mass index, LA: left atrial. Statistical analysis All the data was expressed as means±standard deviations(SDs). The data were analyzed using the standard statistical software(SPSS package version 11.0); comparisons of all the measurements were made with using paired Student’s t-test for continuous variables and chi-square tests for categorical variables. A p of <0.05 was considered to indicate significance.. Results General characteristics of the patients The major demographic and clinical characteristics are given in Table 1. The mean age of the chronic AF patients was 52.3±4.8 years(range: 43-74 years) and the mean age of the paroxysmal AF patients was 55.4 ±9.5 years(45-78 years). The global left ventricular (LV) systolic function, LV chamber dimension and wall thickness were normal for all the AF patients. The LA diameter and LA volume index were significantly increased in the chronic AF patients, but there were no differences between the paroxysmal AF patients and the controls. Strain echocardiographic findings There were no significant differences in the left atrial dimensions and the Doppler flow characteristics between the paroxysmal AF group and the normal group (Table 2). However, significant decreases of the values of the LA strains were noted in the paroxysmal AF group as compared to the controls. Specifically, there was lower peak systolic strain(38.31±15.23% by the TDI-based strain and 19.78±8.88% by the 2-dimensional strain vs. 60.13±7.36% by the TDI-based strain and 48.15±17.85% by the 2-dimensional strain, respectively, p<0.001), a lower peak mean systolic strain rate(Sm-SR: 2.31±0.36 by the TDI-based strain and 1.38±0.58 by the 2-dimensional strain vs. 3.49±0.89. Table 2. The mitral inflow parameters and the values of TDI-based strain between the groups. Normal E velocity (cm/sec) A velocity (cm/sec) E/E’ Peak strain, systolic (%) Peak strain, diastolic (%) Sm-SR (s-1) Em-SR (s-1). Paroxysmal AF. Chronic AF. 70±21.8. 64±23.5. 102.4±29.1*†. 54.2±21.6. 57.67±14.2. 8.73±3.68. 9.24±2.16. 14.98±4.37*. 60.13±7.36. 38.31±15.23*. 19.46±7.12*†. -5.2±1.7. -3.9±2.6*. -0.5±0.38*†. 3.49±0.89 -4.24±0.17. 2.31±0.36* -3.23±0.77*. 1.04±0.23*† -1.78±0.14*†. Am-SR (s-1) -3.58±0.49 -1.22±0.33* Values are means±SDs. *: p<0.05 vs. control, †: p<0.05 vs. paroxysmal AF. E: early rapid filling wave, A: filling wave due to atrial contraction, E’: early diastolic annulus velocity, AF: atrial fibrillation, Sm-SR: mean peak systolic strain rate, Em-SR: peak early diastolic strain rate, Am-SR: peak late diastolic strain rate Table 3. Parameters of 2-dimensional strain between the groups. Normal Paroxysmal AF Peak strain, 48.15±17.85 19.78±8.88* systolic (%) Peak strain, -4.3±1.38 -2.7±1.45* diastolic (%) 1 Sm-SR (s- ) 3.03±0.60 1.38±0.58*. Chronic AF 8.25±4.66*† -0.3±0.19*† 0.57±0.39*†. Em-SR (s-1) -2.61±0.46 -1.11±0.53* -0.82±0.52*† -1 Am-SR (s ) -2.44±0.31 -1.46±0.71* Values are means±SDs. *: p<0.05 vs. control, †: p<0.05 vs. paroxysmal AF. AF: atrial fibrillation, Sm-SR: mean peak systolic strain rate, Em-SR: peak early diastolic strain rate, Am-SR: peak late diastolic strain rate. by the TDI-based strain and 3.03±0.60 by the 2dimensional strain, respectively, p<0.007), a lower peak mean early diastolic strain rate(Em-SR: -3.23±0.77 by the TDI-based strain and -1.11±0.53 by the 2-dimensional strain vs. -4.24±0.17 by the TDI-based strain and -2.61±0.46 by the 2-dimensional strain, respectively, p<0.001), and a lower peak mean late diastolic rate(Am-SR: -1.22±0.33 by the TDI-based strain and -1.46±0.71 by the 2-dimensional strain vs. -3.58±0.49 by the TDI-based strain and -2.44±0.31 by the 2-dimensional strain, respectively, p<0.001) in the paroxysmal AF group than in the controls(Table 3) (Fig. 3, 4). The peak systolic strain, Sm-SR and Em-SR were significantly reduced in the AF group compared with the normal group, and this was especially true in the chronic AF group(Table 3)(Fig. 5).. Discussion Atrial fibrillation(AF) is the most frequently seen arrhythmia in clinical practice. The incidence of atrial fibrillation increases with age, and this approximately.
(5) 790·Korean Circulation J 2006;36:786-793. Peak systolic strain. Sm-SR. Sm-SR. Am-SR Em-SR Am-SR Em-SR. A. B. C. Fig. 3. Strain analysis of the normal controls. The peak systolic strain (A) and strain rate (B) by the tissue Doppler-based strain and by the 2-dimensional strain (C), respectively, in the control subjects.. Sm-SR Peak systolic strain. Sm-SR. Am-SR. Em-SR. Am-SR. Em-SR. A. B. C. Fig. 4. Strain analysis of PAF. The peak systolic strain (A) and strain rate (B) by the tissue-Doppler based strain and the 2-dimensional strain (C), respectively, in the PAF patients.. Sm-SR Peak systolic strain. Sm-SR. Em-SR. Em-SR. A. B. C. Fig. 5. Strain analysis of chronic AF. Peak systolic strain (A) and the strain rate (B) by the tissue-Doppler based strain and the 2-dimensional strain. (C), respectively, in the chronic AF patients..
(6) Kyoung Im Cho, et al:Left Atrial Functional Changes in Atrial Fibrillation·791. doubles with each decade of life.8) The AF substratum is characterized by structural and functional changes in the atrial myocardium, including hypertrophied and dedifferentiated myocytes that show extensive myolysis, marked fibrosis and myofiber disarray.9-11) Determining the segmental atrial function may be appropriate for those patients with diseased hearts, and particularly for the patients suffering with atrial fibrillation, and for physicians to apply the current treatment modalities.. Atrial function during AF LA function is not currently assessed in routine clinical practice. Studies of the regional atrial function may be useful for assessing the impact of the new surgical and catheter ablation methods that are being used to cure atrial fibrillation.12) The left atrial(LA) size, volume or both have been described as strong prognostic parameters for heart failure and also for postinfarction or atrial fibrillation. Transthoracic echocardiography (TTE) is an excellent technique to assess the LA size. The M mode-derived LA size has been shown to be well correlated with the angiographically-derived LA areas and volumes, and it has been used to monitor the changes of the LA size in AF patients. We also measured the atrial volume via TTE in our paroxysmal AF patients, but there was no difference between the paroxysmal AF patients and the normal controls. Studies on the mitral inflow wave(the late diastolic A wave) and pulmonary vein flow(a reversal wave) have been used to assess LA function. LA appendage emptying is more commonly assessed by performing transesophageal echocardiography(TEE),13) but this only provides for indirect evaluation of LA function. An earlier study examined the differences between the contraction velocity of the left atrial appendage and the body of the atrium,14) and the differences in blood flow velocities within the atrium.15) LA dysfunction will be present even in a stage with slightly elevated LA pressure; in this stage, the parameters of LA contractility are augmented, which are assessed by conventional Doppler echocardiography. Thus, it is difficult to detect LA dysfunction by employing this method. In our study, the late diastolic A velocity and E/E' ratio were slightly increased in the patients with paroxysmal AF as compared to the controls, but these differences were not significant. Tissue Doppler imaging(TDI) can now be used to quantify regional myocardial function, as this technique measures myocardial velocities, displacement and deformation.16) Not much data is currently available on atrial myocardial velocities,17) and the preliminary reports have validated using strain and the strain rate as measures of atrial function.18-20) TDI is angle dependent; therefore, the obtained peak velocity would depend on the angle between the probing Doppler beam and the axis of movement of the atrial wall. A gradient from the an-. nular segment to the superior segment was noted; thus, the atrium adjacent to the annulus has the fastest movement. The superior segment of the atrium is relatively fixed and it has an insignificant contribution to longitudinal contraction. Additive translation from the cardiac motion may contribute to the increased velocities in the atrial segments that are adjacent to the annulus. A’ velocity is a measure of the intrinsic atrial contraction and it significantly correlates with the atrial emptying fraction and the atrial ejection force, and it shows the same changes with ageing.17) While TDI estimates the regional myocardial contractility, the point velocity of the specific left atrial region does not differentiate between the active contraction and the passive motion that’s related to cardiac translation. The recent developments for estimating the myocardial strain and strain rate,21)22) which calculates the spatial differences in tissue velocities between neighboring myocardial regions, may obviate some of these problems. The 2-dimensional strain method is a tool for quantitating the regional myocardial deformation within a scan plane. Contrary to the strain obtained by TDI, the new method is inherently 2D and it is independent of the Doppler beam angle as it tracks the speckle patterns, i.e., the acoustic markers.23). Atrial deformation properties during AF In early diastole, the atria act as conduits that passively empty during ventricular relaxation when the blood is transferred from the systemic and pulmonary veins to the ventricles.24) So, atrial function during early diastole is strongly influenced by the LV compliance. During ventricular systole, the atria function as reservoirs to store blood when the atrioventricular valves are closed, and the reservoir function is influenced by atrial relaxation, the ventricle contraction through the descent of the base and the stiffness of the atrial chamber.24) The myocardial atrial deformation properties during AF are significantly impaired. The atrial lengthening that occurs during ventricular ejection is significantly reduced, and the atrial shortening that occurs during early ventricular filling is also reduced. We couldn’t detect any atrial deformation during late diastole; these findings are in agreement with several previous studies,9-12) demonstrating that both the reservoir and conduit functions are impaired during AF and the booster pump function is absent, and we confirmed there was increased atrial stiffness during AF. Other studies have shown that a few weeks of rapid atrial pacing in the presence of a normal ventricular rate response produced an isolated atrial cardiomyopathy that was characterized by impaired booster pump and reservoir functions and increased chamber stiffness.14) Recent studies have demonstrated that atrial compliance is altered by AF before structural remodeling occurs.25) In our study, the peak systolic strain/strain rate and the peak late.
(7) 792·Korean Circulation J 2006;36:786-793. diastolic strain rate of the paroxysmal AF patients tended to be lower in those patients suffering with paroxysmal AF and LA dilatation than in those patients suffering with paroxysmal AF and without LA dilatation, and both the parameters were significantly reduced more than the normal controls. This implies an impaired reservoir function and booster pump function even before LA enlargement occurs, and this is possibly because of reduced atrial compliance. The lower values of LA strain in the AF patients suggest decreased passive lengthening (stretching) and shortening of the atrial walls, and this is possibly due to the atrial remodeling with fibrosis and the reduced compliance. We chose to measure the TDI-based LA strain from the basal segments of the inter-atrial septum and the LA lateral wall, and by performing 2-dimensional strain imaging from the inter-atrial septum because it moves in a direction more parallel to the ultrasound beam and so it is less affected by LV motion and translation. Analysis of the TDI-based LA strain demonstrated no significant difference in both the septal wall and lateral wall. To the best of our knowledge, this is the first study that has shown the feasibility of determining the LA strain in patients suffering with AF by using both the TDI-derived method and 2-dimensional strain imaging. In conclusion, our results indicated that strain echocardiography enabled us to precisely, quantitatively assess the LA contractile function, This method can provide clinically useful information concerning the early reversible atrial functional changes in the patients suffering with AF before structural remodeling occurs, and especially in the paroxysmal AF patients.. Study limitations This study carries several limitations. Tracking the region of interest was still suboptimal for some patients with hyperdynamic LV function and poor echocardiographic imaging. It still took from 5 to 10 minutes to achieve satisfactory tracking, and this was not done in real-time analysis. The atrial radial strain/rate was not calculated from the parasternal short-axis views because the atrial wall is too thin to be properly analyzed in these views, as was demonstrated by our previous pilot study. We did not consider the AF duration, so there would be differences for a shorter and longer duration of AF, and the comparisons between the AF patients and the controls may have also been influenced by the patients’ medical treatment. REFERENCES 1) Vaziri SM, Larson MG, Benjamin EJ, Levy D. Echocardiogra-. phic predictors of nonrheumatic atrial fibrillation. Circulation 1994;89:724-30. 2) Rostangno C, Olivo G, Comglio M, Bertini G, Gensini GF,. Galanti G. Left atrial size changes in patients with paroxysmal lone atrial fibrillation. Angiology 1996;47:797-801. 3) Lee SM, Choue CW, Hong SJ, et al. The joint multicenter study on the atrial fibrillation in Korea. Korean Circ J 2000;30:646-52. 4) Manning WJ, Silverman DI, Katz SE, Douglas PS. Atrial ejection force: a noninvasive assessment of atrial systolic function. J Am Coll Cardiol 1993;22:221-5. 5) Trambaiolo P, Tonti G, Salustri A, Fedele F, Sutherland G. New insights into regional systolic and diastolic left ventricular function with tissue Doppler echocardiography: from qualitative analysis to a quantitative approach. J Am Soc Echocardiogr 2001;14:85-96. 6) Yu CM, Wang Q, Lau CP, et al. Reversible impairment of left and right ventricular systolic and diastolic function during short-lasting atrial fibrillation in patients with an implantable atrial defibrillator: a tissue Doppler imaging study. Pacing Clin Electrophysiol 2001;24:979-88. 7) Sutherland GR, Hatle L, Rademakers FE, et al. Doppler Myocardial Imaging: A Textbook. Leuven, Belgium: Leuven University Press;2003. p.99-107. 8) Jahangir A, Munger TM, Packer DL, et al. Cardiac Arrhythmias: Mechanisim, Diagnosis, and Management. Philadelphia: Lippincott Williams & Wilkins; 2001. p.457-99. 9) Boutjdir M, Le Heuzey JY, Lavergne T, et al. Inhomogeneity of cellular refractoriness in human atrium: factor or arrhythmia? Pacing Clin Electrophysiol 1986;9:1095-100. 10) Ausma J, Wijffels M, Thone F, Wouters L, Allessie M, Borgers M. Structural changes of atrial myocardium due to sustained atrial fibrillation in the goat. Circulation 1997;96:3157-63. 11) Aime’-Sempe’ C, Folliguet T, Rucker-Martin C, et al. Myocardial cell death in fibrillating and dilated human right atria. J Am Coll Cardiol 1999;34:1577-86. 12) Park MY, Shim WJ, Shin SH, et al. Structural and functional changes of heart after cardioversion of atrial fibrillation. Korean Circ J 2003;33:918-27. 13) Jeon SH, Park SH. Multiplane transesophageal echocardiograhic assessment of left atrial appendage. Korean Circ J 2002; 32:137-45. 14) Hoit BD, Shao Y, Gabel M. Left atrial systolic and diastolic function accompanying chronic rapid pacing-induced atrial failure. Am J Physiol 1998;275:H183-9. 15) Shively BK, Gelgand EA, Crawford MH. Regional left atrial stasis during atrial fibrillation and flutter: determinants and relation to stroke. J Am Coll Cardiol 1996;27:1722-9. 16) Hatle L, Sutherland GR. Regional myocardial function: a new approach. Eur Heart J 2000;21:1337-57. 17) Thomas L, Levett K, Boyd A, Leung DY, Schiller NB, Ross DL. Changes regional in left atrial function with aging: evaluation by Doppler tissue imaging. Eur J Echocardiogr 2003;4:92-100. 18) Tabata T, Tanaka H, Harada K, Kimura E, Nomura M, Ito S. Direct assessment of the left atrial reservoir function using tissue strain imaging. Eur Heart J 2004;24:138. Abstract. 19) Sirbu C, Martyniak A, D’hooge J, et al. A comparative assessment of right and left atrial function in healthy subjects using strain/strain rate imaging. Eur Heart J 2004;25:P2873. Abstract. 20) Sirbu C, Martyniak A, D’hooge J, et al. Left atrial function assessment: what might tissue Doppler add? Eur Heart J 2004; 25:P2874. Abstract. 21) Reisner SA, Lysyansky P, Agmon Y, Mutlak D, Lessick J, Friedman Z. Global longitudinal strain: a novel index of left ventricular systolic function. J Am Soc Echocardogr 2004;17:630-3. 22) Kukulski T, Jamal F, D’Hooge J, Bijnens B, De Scheerder I, Sutherland G. Acute changes in systolic and diastolic events dur-.
(8) Kyoung Im Cho, et al:Left Atrial Functional Changes in Atrial Fibrillation·793 ing clinical coronary angioplasty: a comparison of regional velocity, strain rate and strain measurement. J Am Soc Echocardiogr 2002;15:1-12. 23) Korinek J, Wang J, Sengupta PP, et al. Two-dimensional strain: a Doppler-independent ultrasound method for quantitation of regional deformation: validation in vitro and in vivo. J Am Soc Echocardiogr 2005;18:1247-53.. 24) Barbier P, Alioto G, Guazzi MD. Left atrial function and ven-. tricular filling in hypertensive patients with paroxysmal atrial fibrillation. J Am Coll Cardiol 1994;24:165-70. 25) Schotten U, de Haan S, Neuberger HR, et al. Loss of atrial contractility is the primary cause of atrial dilatation during the first days of atrial fibrillation. Am J Physiol Heart Circ Physiol 2004;287:H2324-31..
(9)
수치
관련 문서
