280 ORIGINAL ARTICLE
DOI 10.4070 / kcj.2009.39.7.280
Print ISSN 1738-5520 / On-line ISSN 1738-5555 Copyright ⓒ 2009 The Korean Society of Cardiology
Echocardiographic Assessments of Left Atrial Strain and Volume in Healthy Patients and Patients With Mitral Valvular Heart Disease by Tissue Doppler Imaging and 3-Dimensional Echocardiography
Mi-Seung Shin, MD1, Bong Roung Kim, MD2, Kyu Jin Oh, MD1, Jeong Min Bong, MD1, Wook-Jin Chung, MD1, Woong Chol Kang, MD1, Seung Hwan Han, MD1, Chan Il Moon, MD1, Tae Hoon Ahn, MD1, In Suck Choi, MD1 and Eak Kyun Shin, MD1
1Division of Cardiology, Department of Internal Medicine, Gachon University of Medicine and Science, Gil Medical Center, Incheon,
2Department of Internal Medicine, Seoul Medical Center, Seoul, Korea
ABSTRACT
Background and Objectives: The purpose of the current study was to assess left atrial (LA) physiology in relation to associations between LA volume change and regional tissue velocities and strains, and to extend this information to patients with mitral stenosis (MS) or mitral regurgitation (MR). Subjects and Methods: Twenty-two healthy persons, 22 patients with moderate-to-severe MS, and 22 patients with moderate-to-severe MR were studied.
Tissue velocities, strains, and time-volume curves of the LA were acquired using tissue Doppler imaging and 3- dimensional echocardiography. Results: In healthy controls, the maximal LA volume was negatively correlated with the posterior wall longitudinal systolic strain (r=-0.45, p=0.03). The time-to-maximal LA volume was positively correlated with the time-to-posterior wall longitudinal peak strain (r=0.46, p=0.03) and the time-to- circumferential peak strain (r=0.59, p=0.004). The LA active emptying fraction (LAactEF) was positively correlated with the posterior wall longitudinal peak systolic and late diastolic tissue velocities. In patients with MS, the maximal LA volume was negatively correlated with the posterior wall radial peak systolic velocity and the longitudinal late diastolic velocity. In patients with MS, the LAactEF had an additional positive correlation with the anterior wall longitudinal and circumferential systolic velocities, whereas the patients with MR had an additional positive correlation between the LAactEF and the lateral wall longitudinal peak strain as compared with the healthy cantrols.
Conclusion: LA longitudinal and circumferential deformations are more related than radial deformation to de- termining LA volume and function. The LA of patients with MS revealed a greater pathologic physiology than those of patients with MR. (Korean Circ J 2009;39:280-287)
KEY WORDS: Left atrium; Doppler; Strains.
Introduction
The left atrium (LA) plays an essential role in the car- diovascular system, as it functions as a blood reservoir, conduit, and booster pump. The importance of the re- servoir function is emphasized by the fact that 42% of the left ventricular (LV) stroke volume is stored in the LA during LV systole.1) Furthermore, LA size is known to be an important risk factor for the development of atrial
fibrillation2) and a major predictor of cardiac death and clinical outcome in patients with dilated cardiomypathy.3) In addition, LA size has a crucial role in mitral valve com- petency,4) and also reflects the chronicity and duration of LA hypertension and LV diastolic dysfunction.5)
The atrial walls consist of intricately intermingled muscular bundles oriented circumferentially and longi- tudinally6) with individual contractilities. Tissue velocity, strain, and strain rate have been shown to be less load- dependent regional quantitative parameters that reflect regional contraction and relaxation.7)8) Although numer- ous tissue Doppler imaging studies have been undertaken to assess LV contraction and relaxation, LA tissue veloc- ities and strain have been relatively neglected. Some re- searchers have used sonomicrometry to measure strain, but these investigations have been performed using open
Received: December 30, 2008 Revision Received: February 24, 2009 Accepted: March 10, 2009
Correspondence: Mi-Seung Shin, MD,Division of Cardiology, Department of Internal Medicine, Gachon University of Medicine and Science, Gil Me- dical Center, 1198 Guwol-dong, Namdong-gu, Incheon 405-760, Korea Tel: 82-32-460-3862, Fax: 82-32-469-1906
E-mail: [email protected]
Mi-Seung Shin, et al.·281 chest animal models.9) Real time 3-dimensional echo-
cardiography provides more spatial information on the cardiac chambers and more accurate measures of true LA volume.10)11) However, few reports have been issued concerning the association between LA regional tissue velocity and strain, and LA volume change in humans.
In the current study, we have comprehensively deter- mined non-invasive variables, such as LA regional tissue velocity, strain, strain rate, and volume in real clinical situations in the hope of adding to our understanding of normal LA contractile physiology and extending this information to patients with mitral stenosis (MS) or mitral regurgitation (MR). Specifically, we have evaluat- ed the longitudinal, radial, and circumferential myo- cardial contractility of the LA wall using tissue Doppler imaging to measure regional tissue velocity, strain, and strain rate. LA time-volume curves were obtained by real time 3-dimensional echocardiography. We assessed the relationship between peak systolic tissue velocity and maximal LA volume and between time-to-peak strain and time-to-maximal LA volume. Furthermore, these parameters were compared between echocardiographi- cally-normal hearts and hearts of patients with MS (pressure overload state) or MR (volume overload state).
In this study, we sought to investigate the hypotheses that longitudinal and circumferential contractilities are more important than radial factors in determining LA volume change due to anatomic fiber orientation, and that volume and pressure overloads have different effects on LA contractility.
Subjects and Methods
Study subjects
Twenty-two persons with echocardiographically-nor- mal hearts were recruited from among those who un- derwent pre-operative evaluations for non-cardiac sur- geries and volunteers. Twenty-two patients with moder- ate-to-severe MS and 22 patients with moderate-to-severe MR (central jet, 16; eccentric jet, 6) were recruited from among patients scheduled for an echocardiographic fol- low-up or cardiac murmur study. All study subjects had a normal sinus rhythm, a preserved LV systolic function (ejection fraction >50%), and had satisfactory image qualities.
By assuming that the data of 20% of the segments assessed would not be suitable for analysis, that the clinical variance in strain between patients and segments would be 5±5.5%, and that we wished to estimate ab- solute differences with an error of 5%, a beta power of 80%, and an alpha power of 0.05, it was determined that 21 patients were required per group.
Methods
All study subjects underwent 2-dimensional, conven-
tional Doppler, tissue Doppler imaging, and 3-dimen- sional echocardiography. The study protocol was approv- ed by our Institutional Review Board. Transthoracic echocardiography was performed sequentially using a Vivid 7 echocardiographic unit (General Electric, Horten, Norway) for tissue Doppler imaging and a 2-4-MHz ×4 matrix-array transducer connected to a Sonos 7500 echo- cardiographic unit (Philips, Andover, MA, USA) for real time 3-dimensional echocardiographic imaging. Tissue Doppler images of parasternal long and short axes and apical 2- and 4-chamber views of the LAs were acquired at a frame rate of 92-120 frames per second with an image sector angle of 90 degrees. Full volume 3-dimen- sional images of the LAs were acquired in an apical 4- chamber view by wide-angle acquisition during end- expiration. Images were stored digitally and analyzed offline using custom-modified software (EchoPac PC, General Electric and TomTec Imaging Systems, Munich, Germany). Tissue velocity, strain, strain rate, and tissue tracking were measured using a 1 mm square region of interest placed at the middle portion of each LA wall.
Longitudinal parameters were measured in apical 4- and 2-chamber views. Circumferential parameters were meas- ured at LA bases in the parasternal long axis view, and radial parameters were measured at the LA posterior walls in the parasternal short axis view.
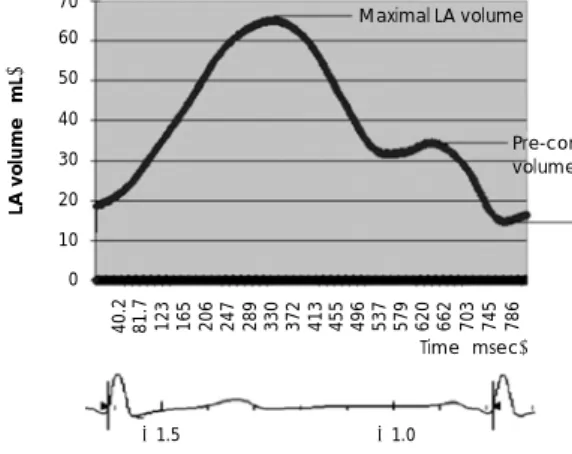
Offline software 4D LV Cardio-view (TomTec) was used to display and quantify 3-dimensional images. We used a modified automatic contour detection method in 6 cutting planes in each frame during one cardiac cycle to evaluate the 3-dimensional volume data and LA time-volume curves (Fig. 1). The LA active emptying fraction was defined as the percent change between the precontraction LA volume during the ventricular diastole and minimal LA volume after LA contraction derived from a time-volume curve by 3-dimensional echocar- diography, as described in our previous report.12) The LA active emptying velocity was defined as (precontrac- tion LA volume-minimal LA volume)/(time between precontraction LA volume and minimal LA volume),
LA volume (mL)
70 60 50 40 30 20 10 0
-1.5
Minimal LA volume Pre-contraction LA volumez Maximal LA volume
-1.0
40.2 81.7 123 165 206 247 289 330 372 413 455 496 537 579 620 662 703 745 786
Time (msec)
Fig. 1. Left atrial (LA) time-volume curve obtained by real time 3-dimensional echocardiography.
282·LA Strain and Volume in Healthy, MS, MR
and the LA filling velocity was defined as (maximal LA volume-minimal LA volume)/(time to maximal LA vol- ume from minimal LA volume).
Hypothesis testing
1) Longitudinal and circumferential reservoir function and contractility (regional tissue velocity, strain, and strain rate) are more important than radial factors in terms of determining LA volume changes because of anatomic fiber orientations.
To test this hypothesis, each contractile parameter, maximal LA volume, and LA active emptying fraction were analyzed using Pearson’s correlation test. Data sig- nificantly (p<0.05) correlated with maximal LA volume was identified by multiple regression analysis. All para- meters were compared using analysis of variance (AN- OVA) with post-hoc analysis. The hypothesis was consi- dered proven if longitudinal and circumferential param-
eters were found to be significantly (p<0.05) more cor- related with LA volume changes than radial parameters.
2) Pressure and volume overloads differentially affect LA contractility.
To test this hypothesis, we used regression analysis to examine the relation between each contractile parameter and the maximal LA volume in patients with MS or MR.
Results
Clinical characteristics and echocardiographic vol- ume data
The clinical characteristics of the three groups are shown in Table 1. The mean age of the MR patients was greater than that of the healthy controls and MS pa- tients (65±14 vs. 52±18 and 49±13 years, p<0.05, respectively). The maximal LA volume index was greater in the MS and MR patients than in the controls (57.6±
18.5 and 56.8±17.1 vs. 27.1±8.8 mL/m2, p<0.05, re- spectively), and the LA active emptying fraction was lower in the MS and MR patients than in the controls (19.2±10.2 and 23.2±9.8 vs. 38.0±9.7%, p<0.05, respectively; Table 2). The mean LA filling velocity was greater in the MR patients than in the MS patients or controls, despite no significant difference between the MR and MS patients in terms of maximal LA volume index and active emptying velocity (Table 2).
Normal controls
The regional systolic and late diastolic tissue velocities were different at each LA wall and the posterior walls
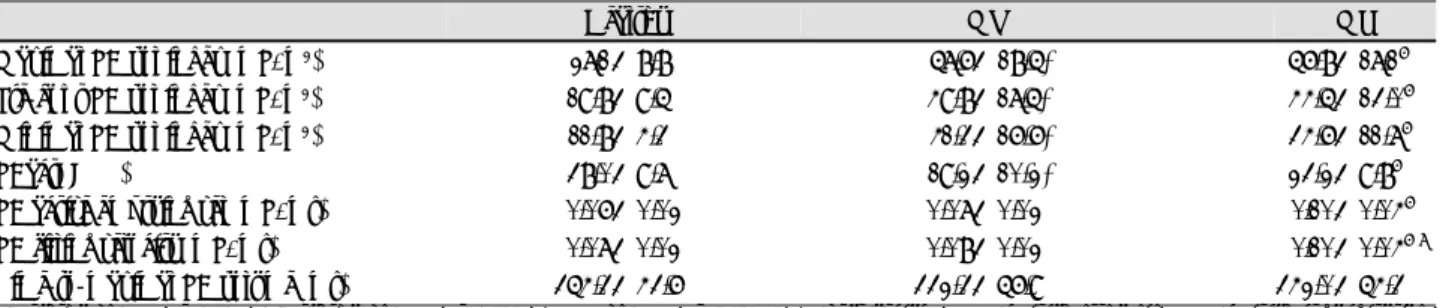
Table 3. Tissue velocities and strains of the left atrium in the healthy group
Peak systolic velocity (cm/sec) Late diastolic velocity (cm/sec) Strain (%)
Longitudinal
Anterior wall 4.94±1.340 -4.88±1.74 40.6±15.1
Posterior wall 3.96±0.94* -4.09±1.44* 42.9±19.9
Septum 4.77±1.010 -4.59±1.18 30.4±20.7§
Lateral wall 4.91±1.270 -4.26±1.74 33.1±17.6
Circumferential 03.63±1.21† -3.38±1.50† 40.8±16.9
Radial -1.58±0.69‡ 001.05±0.69‡ 56.9±27.6‡
*Anterior wall vs. posterior wall, p<0.05, †Anterior wall longitudinal tissue velocity vs. circumferential tissue velocity, p<0.05, ‡Posterior wall longitudinal vs. radial parameter, p<0.05, §Anterior wall vs. septum, p<0.05
Table 2. Left atrial volumes and active emptying fractions of the study groups
Healthy MS MR
Maximal LA vol index (mL/m2) 27.1±8.80 057.6±18.5* 056.8±17.1† Pre-cont LA vol index (mL/m2) 19.8±9.50 049.8±17.5* 044.5±13.0† Minimal LA vol index (mL/m2) 11.8±4.30 041.3±16.6* 034.6±11.7†
LAactEF (%) 38.0±9.70 019.2±10.2* 023.2±9.8†
LA active emptying vel (mL/ms) 0.06±0.02 0.07±0.02 00.10±0.04†
LA filling velocity (mL/ms) 0.07±0.02 0.08±0.02 00.10±0.04†‡
Time-to-maximal LA volume (ms) 354.3±43.60 332.3±56.90 342.0±54.3
*Healthy vs. MR, p<0.05, †Healthy vs. MR, p<0.05, ‡MS vs. MR, p<0.05. LA: left atrium, MS: mitral stenosis, MR: mitral regurgitation, Pre-cont LA vol index: pre-contraction left atrial volume index, LAactEF: left atrial active emptying fraction, LA active emptying vel: left atrial active emptying velocity
Table 1. Clinical characteristics of the study groups
Healthy MS MR
Number 22 22 22
Age (years) 52.2±17.9 49.4±12.9 64.6±13.6*† BMI (kg/m2) 22.4±3.30 22.1±3.40 24.0±3.6 BSA (m2) 1.61±0.15 1.52±0.13 1.60±0.14 Male/Female 11/13 1/21 4/18 Heart rate (bpm) 67.1±10.3 66.3±12.0 68.8±15.2 LV EF (%) 65.6±5.30 62.2±11.4 62.4±9.1
*Healthy vs. MR, p<0.05, †MS vs. MR, p<0.05. MS: mitral stenosis, MR: mitral regurgitation, BMI: body mass index, BSA: body surface area, bpm: beats per minute, LV EF: left ventricular ejection fraction
Mi-Seung Shin, et al.·283 had significantly lower tissue velocities than the anterior
walls (Table 3). The circumferential and radial tissue velocities were significantly lower than the longitudinal tissue velocities. Furthermore, the septal longitudinal strain was lower than the anterior wall longitudinal strain, and the posterior wall radial strain was larger than the longitudinal strain (Table 3). The maximal and minimal LA volumes had positive correlations with the LA active emptying velocity (r=0.64 and r=0.49, respectively; p<
0.05) and the filling velocity (r=0.85 and r=0.59, re- spectively; p<0.05), but there was no significant correla-
tion with the LA active emptying fraction (Table 4). The maximal LA volume was not significantly related with the longitudinal, circumferential, or radial peak systolic tissue velocities (Table 5), or with late diastolic tissue velocities (Table 6). The maximal LA volume had nega- tive correlations with the posterior wall longitudinal peak systolic strain (r=-0.45, p=0.03) (Fig. 2) and the longi- tudinal systolic strain rate (r=-0.55, p=0.01). The time- to-maximal LA volume was positively correlated with the time-to-septal longitudinal peak systolic velocity (r=
0.52, p=0.01), the time-to-posterior wall longitudinal
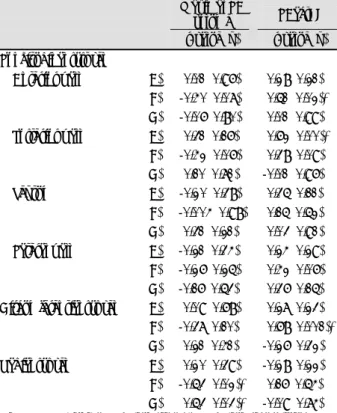
Table 6. Correlation among left atrial late diastolic tissue veloci- ties, volumes, and active emptying fractions
Maximal LA
volume LAactEF r-value (p) r-value (p) Longitudinal late dia vel
Anterior wall A) -0.24 (0.28) -0.39 (0.07) B) -0.13 (0.57) -0.36 (0.11) C) -0.46 (0.06) -0.16 (0.53) Posterior wall A) -0.08 (0.71) -0.48 (0.02)*
B) -0.72 (0.00)* -0.54 (0.01)*
C) -0.21 (0.39) -0.22 (0.38) Septum A) -0.01 (0.95) -0.27 (0.22)
B) -0.18 (0.44) -0.17 (0.45)
C) -0.28 (0.26) -0.08 (0.75)
Lateral wall A) -0.05 (0.83) -0.13 (0.55) B) -0.22 (0.33) -0.39 (0.08) C) -0.22 (0.37) -0.64 (0.00)*
Circumferential late dia vel A) -0.20 (0.38) -0.31 (0.16) B) -0.23 (0.33) -0.37 (0.11)
C) -0.02 (0.93) -0.13 (0.61)
Radial late dia vel A) -0.01 (0.98) -0.00 (0.99) B) -0.12 (0.63) -0.04 (0.89)
C) -0.48 (0.05) -0.18 (0.48)
*p<0.05. A: healthy, B: mitral stenosis, C: mitral regurgitation, LA:
left atrium, LAactEF: LA active emptying fraction, dia vel: diastolic velocity
Table 5. Correlation among left atrial peak systolic tissue velo- cities, volumes, and active emptying fractions
Maximal LA
volume LAactEF r-value (p) r-value (p) Longitudinal syst vel
Anterior wall A) -0.01 (0.96) -0.28 (0.21) B) -0.40 (0.07) -0.51 (0.02)*
C) -0.06 (0.80) -0.01 (0.99) Posterior wall A) -0.31 (0.16) -0.62 (0.00)*
B) -0.42 (0.06) -0.38 (0.09)
C) -0.10 (0.71) -0.01 (0.96)
Septum A) -0.20 (0.38) -0.35 (0.11) B) -0.004 (0.98) -0.15 (0.52)
C) -0.31 (0.21) -0.03 (0.91)
Lateral wall A) -0.21 (0.34) -0.24 (0.29) B) -0.26 (0.25) -0.42 (0.06) C) -0.16 (0.53) -0.36 (0.15) Circumferential sys vel A) -0.09 (0.68) -0.27 (0.23) B) -0.37 (0.10) -0.68 (0.001)*
C) -0.21 (0.41) -0.26 (0.32)
Radial sys vel A) -0.20 (0.39) -0.28 (0.22) B) -0.53 (0.02)* -0.16 (0.54)
C) -0.53 (0.03)* -0.09 (0.74)
*p<0.05. A: healthy, B: mitral stenosis, C: mitral regurgitation, LA:
left atrium, LAactEF: LA active emptying fraction, sys vel: systolic velocity
Table 4. Correlation between left atrial active emptying fractions and volumes
Maximal LA volume
Minimal LA volume r-value (p) r-value (p) LAactEF A) -0.24 (0.28) -0.12 (0.59) B) -0.45 (0.04)* -0.68 (0.00)*
C) -0.33 (0.19) -0.64 (0.00)*
LA active A) -0.64 (0.00)* -0.49 (0.02)*
emptying velocity B) -0.50 (0.02)* -0.34 (0.14)
C) -0.15 (0.55) -0.10 (0.69)
LA filling velocity A) -0.85 (0.00)* -0.59 (0.00)*
B) -0.63 (0.00)* -0.41 (0.07)
C) -0.70 (0.00)* -0.31 (0.22)
*p<0.05. A: healthy, B: mitral stenosis, C: mitral regurgitation, LA:
left atrium, LAactEF: LA active emptying fraction
Peak longitudinal strain of post. Wall (%)
Maximal LA volume(mL) 100
80
60
40
20
0
0 20 40 60 80 100 120
Fig. 2. The maximal left atrial (LA) volume had a negative corre- lation with peak longitudinal strain of the LA posterior wall in the healthy group.
r=-0.45 p=0.03 n=22
284·LA Strain and Volume in Healthy, MS, MR
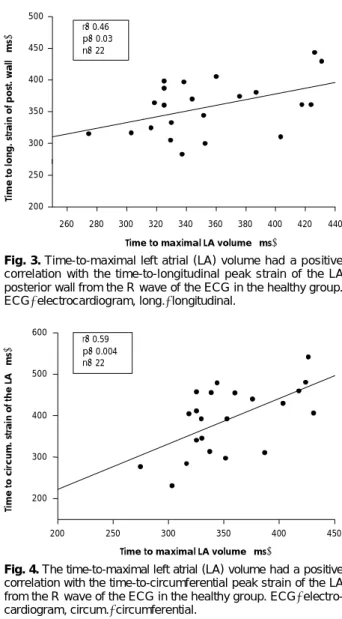
peak strain (r=0.46, p=0.03) (Fig. 3), the time-to-cir- cumferential peak strain (r=0.59, p=0.004) (Fig. 4), and the time-to-posterior wall longitudinal peak tissue track- ing (r=0.49, p=0.02). The LA active emptying fraction was positively correlated with the posterior wall longitu- dinal peak systolic tissue velocity (r=0.62, p<0.05) and the longitudinal peak late diastolic tissue velocity (r=0.48, p=0.02) (Table 5 and 6).
The inter- and intra-observer variabilities were tested by performing an independent analysis by two indepen- dent observers and by repeated measurement of these segments at another occasion by the same observer. The interobserver variability was 17% for strain and 19% for strain rate and the intraobserver variability was 16% for strain and strain rate.
Mitral stenosis
The regional peak systolic and late diastolic tissue ve- locities of the patients with MS were smaller than the controls, except at the septum (Table 7). The circum- ferential and radial tissue velocities were significantly
lower than the longitudinal tissue velocities. The maximal and minimal LA volumes were negatively correlated with the LA active emptying fraction (r=-0.45 and r=-0.68, respectively; p<0.05) and positively correlated with the LA filling velocity (r=0.63 and r=0.41, respectively; p<
0.05) (Table 4). The maximal LA volume was positively correlated with the active emptying velocity (r=0.50, p=
0.02) (Table 4) and negatively correlated with the radial peak systolic tissue velocity (r=-0.53, p=0.02) (Table 5), but was not significantly related to the longitudinal and circumferential peak systolic tissue velocities. The max- imal LA volume was negatively correlated with the post- erior wall peak longitudinal late diastolic tissue velocity (r=-0.72, p<0.05) (Table 6), but showed no significant correlation with the segmental strain and strain rate (data not shown).
The time-to-maximal LA volume was positively cor- related with the time-to-anterior and -posterior wall longitudinal peak strains (r=0.45, p=0.04 and r=0.52, p=0.02, respectively). The time-to-maximal LA volume was positively correlated with the time-to-longitudinal peak tissue tracking of the anterior wall (r=0.59, p<
0.01), posterior wall (r=0.48, p=0.03), septum (r=0.63, p<0.01), and lateral wall (r=0.58, p=0.01), and with the time-to-circumferential peak tissue tracking (r=0.49, p=
0.04).
The LA active emptying fraction was positively cor- related with the anterior wall longitudinal peak systolic tissue velocity (r=0.51, p=0.02) and the posterior wall circumferential peak systolic tissue velocity (r=0.68, p<
0.01) (Table 5) and the longitudinal peak late diastolic tissue velocity (r=0.54, p=0.01) (Table 6). The LA active
Table 7. Tissue velocities of the left atrium of each group
Healthy MS MR
Peak sys vel (cm/s)
Longitudinal Anterior wall -4.94±1.34 -3.58±0.98* -3.25±1.34† Posterior wall -3.96±0.94 -3.23±1.01* -2.83±0.95† Septum -4.77±1.01 -5.17±1.39 -4.74±1.59 Lateral wall -4.91±1.27 -3.18±1.43* -3.06±1.44† Circumferential -3.63±1.21 -2.51±1.26* -2.92±1.27 Radial -1.58±.069 -0.93±0.62* -1.04±0.63† Peak late dia vel (cm/s)
Longitudinal Anterior wall -4.88±1.74 -1.91±1.30* -2.33±1.53† Posterior wall -4.09±1.44 -2.30±1.19* -2.65±1.11† Septum -4.59±1.18 -4.30±1.76 -4.31±1.37 Lateral wall -4.26±1.74 -2.21±1.45* -2.97±1.24† Circumferential -3.38±1.50 -1.63±1.35* -2.33±1.33 Radial -1.05±.069 -0.56±0.28* -0.56±0.48†
*Healthy vs. MS, p<0.05, †Healthy vs. MR, p<0.05. MS: mitral stenosis, MR: mitral regurgitation, sys vel: systolic velocity, dia vel:
diastolic velocity
Time to long. strain of post. wall (ms) r=0.46 p=0.03 n=22
Time to maximal LA volume (ms)
260 280 300 320 340 360 380 400 420 440 200
250 300 350 400 450 500
Fig. 3. Time-to-maximal left atrial (LA) volume had a positive correlation with the time-to-longitudinal peak strain of the LA posterior wall from the R wave of the ECG in the healthy group.
ECG: electrocardiogram, long.: longitudinal.
Time to circum. strain of the LA (ms)
r=0.59 p=0.004 n=22
Time to maximal LA volume (ms)
200 250 300 350 400 450 200
300 400 500 600
Fig. 4. The time-to-maximal left atrial (LA) volume had a positive correlation with the time-to-circumferential peak strain of the LA from the R wave of the ECG in the healthy group. ECG: electro- cardiogram, circum.: circumferential.
Mi-Seung Shin, et al.·285 emptying fraction was positively correlated with the lon-
gitudinal peak late diastolic strain rates of the anterior (r=0.49, p=0.02) and lateral walls (r=0.49, p=0.02).
Mitral regurgitation
The regional peak systolic and late diastolic tissue ve- locities were smaller in the patients with MR than in healthy controls, except for the septum and circumfe- rential tissue velocities (Table 7). The circumferential and radial tissue velocities were significantly lower than the longitudinal tissue velocities. The maximal LA vol- umes were positively correlated with the LA filling ve- locities (r=0.70, p<0.01) (Table 4) and with the radial peak systolic velocity (r=0.53, p=0.03) (Table 5), but were not significantly correlated with the segmental late di- astolic tissue velocity, strain, and strain rate (data not shown). The minimal LA volume had a negative cor- relation with the LA active emptying fraction (r=-0.64, r<0.01) (Table 4).
The time-to-maximal LA volume was positively cor- related with the time-to-posterior and lateral wall longi- tudinal peak strain (r=0.58, p=0.01 and r=0.51, p=0.04, respectively) and with the time-to-circumferential peak strain (r=0.52, p=0.04) and with the time-to-circumfe- rential peak systolic velocity (r=0.52, p=0.04). The time- to-maximal LA volume was positively correlated with the time-to-longitudinal peak tissue tracking of the posterior wall (r=0.66, p<0.01) and septum (r=0.71, p<0.01), and with the time-to-circumferential peak tissue tracking (r=
0.66, p<0.01).
The LA active emptying fraction was negatively cor- related with the lateral wall longitudinal peak late di- astolic tissue velocity (r=-0.64, p<0.01) (Table 6) and positively correlated with the lateral wall longitudinal peak strain (r=0.50, p=0.03). The LA active emptying fraction was positively correlated with the posterior wall and lateral wall longitudinal peak late diastolic strain rate (r=0.56, p=0.01 and r=0.67, p<0.01, respectively) and with the radial peak late diastolic strain rate (r=0.71, p<0.01).
Discussion
In the present study, we investigated the hypotheses that longitudinal and circumferential contractile param- eters are more important than radial factors when de- termining LA volume change, and that pressure and volume overloads have different effects on LA contrac- tility. The study showed that LA longitudinal and cir- cumferential deformations were more related than ra- dial deformation in determining LA volume and func- tion in healthy controls, and that the LA volume change of patients with MS was related with more extensive segmental contractile parameters than in patients with MR. The posterior wall was unexpectedly shown to have
an important role in determining LA volume change in this study.
Many studies have examined LA systolic function us- ing a variety of parameters, such as LA emptying volume and LA emptying volume fraction,13)14) LA fractional shortening or fractional area change,15) Doppler trans- mitral flow parameters (peak A wave velocity and its time-velocity integral, or E/A ratio,16) LA work load,17) LA appendage flow velocities,18) atrial ejection fraction,19) and LA kinetic energy20)) and by tissue Doppler imag- ing of the mitral annulus during atrial systole.21) However, some of these measurements require invasive proce- dures,17)20) whereas other measurements are highly sensi- tive to changes in cardiac loading conditions, LV systolic function, and autonomic state.19)22) The assessment of LA function is thus complex and the accuracies of these parameters in terms of measuring atrial contractility is limited. However, tissue Doppler imaging and 3-dimen- sional echocardiography are relevant to the non-invasive evaluations of regional tissue contractility and volume data. Furthermore, tissue Doppler imaging is relatively independent of preload and afterload changes,7)8) and enable quantitative assessment of LA contractile func- tion.23) This is the first report to address LA physiology in relation to associations between LA volume change and regional tissue velocities and strains in humans.
In the healthy control group, the LA posterior walls had significantly lower tissue velocities than the anterior walls. This may have been due to a limited motion and contractility of the posterior wall due to the insertions of four pulmonary veins and their associated muscular structures.6) Circumferential and radial tissue velocities were found to be significantly lower than longitudinal tissue velocities, which demonstrates the important role played by longitudinal muscular motion in LA volume changes. However, myocardial deformations did not fol- low the same patterns as motion changes. The LA septal longitudinal strain was lower than that of the anterior wall due to differences in muscular components. In heal- thy controls, maximal and minimal LA volumes were positively correlated with LA active emptying and filling velocities, but no significant correlation was found for LA active emptying fraction. LA contractility did not change in line with volume changes within the range of normal values. The maximal LA volumes were negatively correlated with the posterior wall longitudinal peak sys- tolic strains and strain rate due to an expanding defor- mational reserve of the posterior wall in the case of a small LA volume. The time-to-maximal LA volume was positively correlated with the time-to-posterior wall lon- gitudinal peak strain and longitudinal peak tissue track- ing, and with the time-to-circumferential peak strain.
These findings suggest that longitudinal deformation of the posterior wall and circumferential deformation, ra- ther than radial deformation, are important determi-
286·LA Strain and Volume in Healthy, MS, MR
nants of LA volume despite low tissue velocities at these walls. The LA active emptying fraction was positively correlated with the posterior wall longitudinal peak sys- tolic and late diastolic tissue velocities. The above find- ings show that posterior wall tissue velocity is an im- portant factor of LA contractility.
LA volumes were larger in both the MS and MR pa- tient groups than in the healthy controls, but no signifi- cant difference was found between the two patient groups.
The LA active emptying fraction values of the patient groups were lower than the normal controls due to an exhausted atrial wall after LA enlargement, or due to LA booster pump failure as a result of LA afterload mismatch in MS patients as in patients with hypertrophic cardio- myopathy.24) These findings are consistent with previous reports.25)26) The mean LA filling velocity of the patients with MR was greater than that of patients with MS, despite similar maximal LA volumes and active emptying velocities. This finding is a natural result of systolic mitral regurgitant volume. Almost all regional tissue velocities were lower in the patients with MS and MR than in con- trols, despite regional differences. The septal longitudinal peak systolic and late diastolic tissue velocities were not significantly different in the patient groups and con- trols, which was probably due to a membranous thin septal wall as compared with other LA walls, and sen- sitivity to the left and right atrial volume and pressure changes.
Patients with MS had a negative correlation between LA volume and LA active emptying fraction, which was not observed in healthy controls. Furthermore, patients with MR had a negative correlation between the minimal LA volume and the LA active emptying fraction. The- refore, an increased volume due to compensatory adap- tation to an increased afterload and preload resulted in decreased LA contractility in these patients. In patients with MS, the maximal LA volume was negatively cor- related with the radial peak systolic tissue velocity and the longitudinal late diastolic tissue velocity of the pos- terior wall. However, the maximal LA volume was posi- tively correlated with the radial peak systolic tissue ve- locity in patients with MR. The cause of this difference cannot be explained although it is possible that pressure and volume overload may induce different effects on the regional Frank-Starling mechanism of the LA in the radial direction.
In patients with MS, the time-to-maximal LA volume was positively correlated with the time-to-longitudinal peak strain of the anterior and posterior wall, whereas the MR patients had a positive correlation between the time-to-maximal LA volume and the times-to-longitu- dinal peak strain of the lateral and posterior walls, and the time-to-circumferential peak strain. The importance of the longitudinal deformation in terms of determining the time-to-maximal LA volume was preserved in both
patient groups despite regional differences, but the im- portance of circumferential deformation for determining the time-to-maximal LA volume was preserved in the patients with MR only. Furthermore, the patients with MR showed a positive correlation between the time-to- maximal LA volume and the time-to-longitudinal peak tissue tracking of the posterior wall and septum, and the time-to-circumferential peak tissue tracking, rather than the time-to-radial peak tissue tracking of the LA, whereas patients with MS had additional positive correlations between the time-to-maximal LA volume and the time- to-longitudinal peak tissue tracking of the anterior and lateral walls. In the patients with MS, the LA active emp- tying fraction showed a positive correlation with the longitudinal late diastolic strain rates of the anterior and lateral walls, whereas in the patients with MR, the LA active emptying fraction had positive correlations with the longitudinal late diastolic strain rates of the posterior and lateral walls and with the radial late diastolic strain rates. The LA of the patients with MS revealed a greater pathologic physiology than those of MR patients.
This study had several limitations. First, tissue Doppler imaging is angle-dependent, whereas the recently de- veloped 2-D speckle tracking imaging is independent of angle. However, the thickness of a region of interest cannot be reduced to include exclusively thin atrial walls in 2-D speckle tracking imaging. Accordingly, we select- ed tissue Doppler imaging to measure tissue velocities and strains of thin LA walls. Second, the mean age of the patients with MR was greater than the healthy controls and the patients with MS, and thus the results may have been influenced by patient age. However, aging increases LA tissue velocities and active emptying fractions due to augmented atrial contractility.27) In the present study, the patients with MR had lower LA regional tissue ve- locities and active emptying fractions than healthy con- trols. Therefore, age may have attenuated the results in MR patients. Third, this study did not present a com- parison with a gold standard, such as cardiac MRI, due to cost.
In conclusion, this is the first report to address LA physiology in relation to associations between LA vo- lume change and regional tissue velocities and strains in humans. LA longitudinal and circumferential deforma- tions are more related than radial deformation in de- termining LA volume and function in healthy controls.
The LA posterior wall was unexpectedly shown to have an important role in determining LA volume change in this study. The LA of patients with MS revealed a greater pathologic physiology than of the patients with MR. The results of this study have a clinical impact on under- standing the regional influence in LA volume change and function and understanding the different time se- quences of the development of atrial fibrillation in pa- tients with MS and MR.
Mi-Seung Shin, et al.·287
Acknowledgments
This study was supported by a grant of the Korean Society of Car- diology (Industrial-Educational Cooperation, 2005).
REFERENCES
1) Grant C, Bunnell IL, Greene DG. The reservoir function of the left atrium during ventricular systole: an angiocardiographic study of atrial stroke volume and work. Am J Med 1964;37:36-43.
2) Vaziri SM, Larson MG, Benjamin EJ, Levy D. Echocardiogra- phic predictors of nonrheumatic atrial fibrillation. Circulation 1994;89:724-30.
3) Modena MG, Muia N, Sgura FA, Molinari R, Castella A, Rossi R. Left atrial size is the major predictor of cardiac death and overall clinical outcome in patients with dilated cardiomyopathy:
a long term follow-up study. Clin Cardiol 1997;20:553-60.
4) Pizzarello RA, Turnier J, Padmanabhan VT, Goldman MA, Tor- tolani AJ. Left atrial size, pressure, and V wave height in patients with isolated, severe, pure mitral regurgitation. Cathet Cardio- vasc Diagn 1984;10:445-54.
5) Simek CL, Feldman MD, Haber HL, Wu CC, Jayaweera AR, Kaul S. Relationship between left ventricular wall thickness and left atrial size: comparison with other measures of diastolic function. J Am Soc Echocardiogr 1995;8:37-47.
6) Wang K, Ho SY, Gibson DG, Anderson RH. Architecture of atrial musculature in humans. Br Heart J 1995;73:559-65.
7) Marwick TH. Measurement of strain and strain rate by echocar- diography. J Am Coll Cardiol 2006;47:1313-27.
8) Sohn DW, Chai IH, Lee DJ, et al. Assessment of mitral annulus velocity by Doppler tissue imaging in the evaluation of lef ven- tricular diastolic function. J Am Coll Cardiol 1997;30:474-80.
9) Hoit BD, Walsh RA. Regional atrial distensibility. Am J Physiol 1992;262:H1356-60.
10) Kawai J, Tanabe K, Wang CL, et al. Comparison of left atrial size by freehand scanning three-dimensional echocardiography and two-dimensional echocardiography. Eur J Echocardiogr 2004;5:18-24.
11) Khankirawatana B, Khankirawatana S, Lof J, Porter TR. Left atrial volume determination by three-dimensional echocardio- graphy reconstruction: validation and application of a simplified technique. J Am Soc Echocardiogr 2002;15:1051-6.
12) Shin MS, Fukuda S, Song JM, et al. Relationship between left atrial and left ventricular function in hypertrophic cardiomyo- pathy: a real-time 3-dimensional echocardiographic study. J Am Soc Echocardiogr 2006;19:796-801.
13) Triposkiadis F, Tentolouris K, Androulakis A, et al. Left atrial mechanical function in the healthy elderly: new insights from a combined assessment of changes in atrial volume and transmi- tral flow velocity. J Am Soc Echocardiogr 1995;8:801-9.
14) Kim YH, Lee SC, Oh HL, et al. Predictors of sinus rhythm res- toration after Maze operation and relationship between pre- and post-operative left atrial volume. Korean Circ J 2004;34:574-81.
15) Hoit BD, Shao Y, Gabel M, Pawloski-Dahm C, Walsh RA. Left atrial systolic and diastolic function after cessation of pacing in tachycardia-induced heart failure. Am J Physiol 1997;273:H921-7.
16) Kim YJ, Sohn DW, Choe SJ, et al. Restoration of atrial mechan- ical function after Maze operation. Korean Circ J 1996;26:1137- 43.
17) Stefanadis C, Dernellis J, Stratos C, et al. Effects of balloon mitral valvuloplasty on left atrial function in mitral stenosis as assessed by pressure-area relation. J Am Coll Cardiol 1998;32:159-68.
18) Tabata T, Oki T, Yamada H, et al. Role of left atrial appendage in left atrial reservoir function as evaluated by left atrial append- age clamping during cardiac surgery. Am J Cardiol 1998;81:
327-32.
19) Manning WJ, Silverman DI, Katz SE, et al. Impaired left atrial mechanical function after cardioversion: relation to the duration of atrial fibrillation. J Am Coll Cardiol 1994;23:1535-40.
20) Stefanadis C, Dernellis J, Lambrou S, Toutouzas P. Left atrial energy in normal subjects, in patients with symptomatic mitral stenosis, and in patients with advanced heart failure. Am J Cardiol 1998;82:1220-3.
21) Hesse B, Schuele SU, Thamilasaran M, Thomas J, Rodriguez L.
A rapid method to quantify left atrial contractile function: Dop- pler tissue imaging of the mitral annulus during atrial systole.
Eur J Echocardiogr 2004;5:86-92.
22) Nishimura RA, Abel MD, Housmans PR, Warnes CA, Tajik AJ.
Mitral flow velocity curves as a function of different loading con- ditions: evaluation by intraoperative Doppler echocardiography.
J Am Soc Echocardiogr 1989;2:79-87.
23) Cho KI, Lee HG, Kim TI, et al. Quantitative assessment of left atrial function changes in patients with atrial fibrillation by tissue Doppler strain and 2-dimensional strain imaging. Korean Circ J 2006;36:786-93.
24) Sanada H, Shimizu M, Shimizu K, Kita Y, Sugihara N, Takeda R.
Left atrial afterload mismatch in hypertrophic cardiomyopathy.
Am J Cardiol 1991;68:1049-54.
25) Murata M, Iwanaga S, Tamura Y, et al. A real-time three-di- mensional echocardiographic quantitative analysis of left atrial function in left ventricular diastolic dysfunction. Am J Cardiol 2008;102:1097-102.
26) Pagel PS, Kehl F, Gare M, Hettrick DA, Kersten JR, Warltier DC.
Mechanical function of the left atrium: new insights based on analysis of pressure-volume relations and Doppler echocardio- graphy. Anesthesiology 2003;98:975-94.
27) Thomas L, Levett K, Boyd A, Leung DY, Schiller NB, Ross DL.
Changes in regional left atrial function with aging: evaluation by Doppler tissue imaging. Eur J Echocardiogr 2003;4:92-100.