Original Article
초기 고용량 아미노산 공급이 미숙아의 영양상태에 미치는 효과 평가
안혜림†, 김미진, 권은영 가톨릭대학교 서울성모병원 약제부
Effects of Early High-dose Amino Acid Supplementation on the Nutritional Status of Preterm Infants
Hye Lim Ahn†, Mi Jin Kim, Eyn Young Kwon
Department of Pharmacy, Seoul St. Mary’s Hospital, The Catholic University of Korea 222 Banpo-daero, Seocho-gu, Seoul, 06591, Republic of Korea
Background : A previous study reported that supplying an initial high-dose amino acid supple- ment to premature infants was effective in improving the growth rate. However, other studies reported the occurrence of adverse effects associated with parenteral nutrients, raising con- cerns about aggressive nutritional support. We aimed to evaluate the effects of an initial high- dose amino acid supply on nutritional improvement and safety in premature infants in clinical practice.
Methods : This study was designed for premature infants who were administered parenteral nutrition (PN) for at least two weeks in neonatal intensive care units (NICUs) from January 2016 through December 2018. The biochemical and nutritional data were compared between premature infants who received low-dose (LD, 1 to <2 g/kg/day), medium-dose (MD, 2 to <3 g/
kg/day), and high-dose amino acids (HD, ≥3 g/kg/day) within 48 hours after birth.
Results : The changes in weight, total protein levels, and albumin levels were not significant- ly different between the three groups. Also, the duration of the NICU stay, duration of PN, maximal weight loss rate, and recovery time to birth weight showed no significant differences.
투고일자 2020.9.22; 심사완료일자 2020.11.20; 게재확정일자 2020.12.16
†교신저자 안혜림 Tel:02-2258-2522 E-mail:[email protected]
There were no significant differences in blood urea nitrogen (BUN), serum creatinine (Scr), capillary pH, capillary pCO2, blood glucose, aspartate transaminase (AST), alanine transami- nase (ALT), direct bilirubin (DB), serum calcium, or serum phosphorus. However, the median BUN tended to increase in the high-dose group at both weeks 1 and 2 comparted to the LD and MD groups (week 1: LD 28.4 mg/dL, MD 29.2 mg/dL, HD 37.7 mg/dL, p = 0.455; week 2: LD 14.2 mg/dL, MD 17.7 mg/dL, HD 19.4 mg/dL, p = 0.139).
Conclusion : There was no difference in improvements in nutritional status or adverse effects in premature infants given more than 3 g/kg/day or 2 to <3 g/kg/day of amino acids compared to 1 to <2 g/kg/day. Monitoring renal function is required when administering high-dose amino acids, considering the tendency of the BUN to rise.
[Key words] Parenteral nutrition, High-dose amino acid, Preterm infants, Nutritional support
태아는 임신 3기(27주~40주)에 체내에 영양분을 저장하기 때문에 재태기간 37주 이전에 출생한 미숙 아는 체내 영양분을 저장하는 기간이 부족하게 된다.
또한, 출생 초기에 미성숙한 위장관 기능으로 인해 경 구 섭취를 통한 영양 공급량이 요구량에 미치지 못하 기 때문에 적극적인 영양 지원이 절실하다.1) 따라서, 미숙아의 체중 감소 최소화, 자궁 내 성장 제한의 교 정 및 정상적인 성장을 위하여 출생 후 24시간 이내에 정맥영양(parenteral nutrition, PN)을 공급할 것을 추천하고 있다.2),3) 특히 출생 체중 1.5 kg 미만 인 극소 저체중 출생아(very low birth weight, VLBW)와 출생 체중 1 kg 미만인 초극소 저체중 출 생아(extreme low birth weight, ELBW)의 경 우 PN에 대한 의존도가 높아 영양 지원의 주된 대상 이 된다.4),5)
불충분한 아미노산 공급은 미숙아에게 내인성 단백 질을 0.5~1 g/kg/day 만큼 소실하게 하며,6) 이는 미숙아의 이환율을 높일 뿐만 아니라 성장 지연의 원 인으로도 작용한다.7)-10) ELBW의 경우 태내에서 모 체로부터 공급받는 아미노산 양인 3.1~4.5 g/kg/
day 정도를 공급받을 경우 질소균형과 체중 증가, 출 생체중 회복 속도 등에서 긍정적인 예후를 보인 연구 들이 있으며,11)-13) ELBW에게 3 g/kg/day의 용량 으로 아미노산 공급을 시작해도 대사적 부작용이 증 가하지 않는다는 보고도 있다.14)-16)
반면, 출생 초기의 적극적인 영양공급으로 인해 정 맥영양제(total parenteral nutrition, TPN) 관 련 부작용이 증가한다는 연구도 발표되고 있으며17)-
20) ASPEN (American Society for Parenteral and Enteral Nutrition) pediatric nutrition support guideline에서도 적극적인 영양지원에 대 한 우려로 인해 정맥영양을 통한 미숙아의 초기 아미 노산 권장 요구량을 3~4 g/kg/day에서4) 1~3 g/
kg/day(최대 3~4 g/kg/day)로 변경한 바 있다.21) 실제 본원에서도 처방 시기와 처방 의사에 따라 초 기 아미노산 공급량이 1~4 g/kg/day 범위에서 다 양하게 적용되어 왔다. 이에 본 연구에서는 초기 아미 노산 공급량에 따른 영양상태 개선 효과와 부작용을 평가하여 미숙아 영양자문의 근거자료로 활용하고자 하였다.
연구방법
1. 연구 대상
가톨릭대학교 서울성모병원의 신생아중환자실(neo- natal intensive care unit, NICU)에서 2016 년 1월부터 2018년 12월까지 TPN을 2주 이상 투여 한 미숙아를 대상으로 하였다. 영양 지표인 total protein, albumin이 주 1회 이상 측정되지 않은
미숙아, 출생 초기 키/체중 측정 후 체중 측정이 주 1 회 이상 이루어지지 않은 미숙아, 선천적 기형 및 대 사이상을 보이는 미숙아, 관찰 기간 중 전원하거나 사 망한 경우, 외국인은 분석 대상에서 제외하였다. 추 가적으로 대상자 내 ELBW에 해당하는 신생아만을 대상으로도 동일한 방법으로 분석하였다.
2. 연구 방법
출생 초기 48시간 이내 아미노산(프라이멘 10%주 사®, Baxter, Seoul, Korea)을 1 g/kg/day 이상 2 g/kg/day 미만으로 투여한 경우를 저용량 아미노 산 투여군(low dose, LD), 2 g/kg/day 이상 3 g/kg/day 미만으로 투여한 경우를 중간용량 아미노 산 투여군(medium dose, MD), 3 g/kg/day 이 상으로 투여한 경우를 고용량 아미노산 투여군(high dose, HD)으로 분류하여 영양상태 개선효과 지표 와 부작용 지표를 비교하였다. 정맥영양제가 처방된 환자의 전자의무기록을 후향적으로 검토하여, 각 항 목별로 세 군 간 유의한 차이가 있는지 분석하였다.
1) 환자의 기본정보
환자의 성별, 재태연령, 출생 시 키/체중, 1분 후 및 5분 후 아프가 점수(Apgar score), 신생아 관련 질환, 경장영양 시작 시기, 생후 2일차를 기준으로 처방된 정맥영양제의 포도당, 지방, 아미노산의 용량 을 조사하였다. 또한, 생후 초기, 1주일차, 2주일차 의 목표열량, 공급열량, 목표열량 대비 공급열량 비 율을 조사하였다.
2) 영양상태 개선효과 평가
영양상태 평가지표인 total protein, albumin, 체중에 대해 출생 초기를 기준으로 1주일차 수치와 2 주일차 수치의 변화를 비교하였다. 또한 NICU 재원 기간, TPN 투여기간, 최대 체중 감소율, 출생체중 회복 속도(소요일수)를 비교하였다.
3) 부작용 평가
아미노산 공급량에 따른 부작용 지표로 blood urea nitrogen (BUN), serum creatinine (Scr), 대사성 산증의 지표인 capillary-pH와 capil- lary-CO2를 조사하였고, 정맥영양제 관련 부작용 지표로 aspartate transaminase (AST), ala- nine transaminase (ALT), direct bilirubin (DB), 혈당, 혈중 칼슘 농도, 혈중 인산 농도를 비교 하였다.
3. 통계 분석
명목형 변수는 chi-square test를 사용하여 분석 하였고, 연속형 변수는 Kruskal-Wallis test with Dwass, Steel, Critchlow-Fligner mul- tiple comparison test가 사용되었다. 통계 분석 은 SAS 9.4 version (SAS Institute Inc. Cary, NC)을 이용하였으며, p-value가 0.05 미만일 때 통계적으로 유의한 차이가 있는 것으로 간주하였다.
4. 연구 대상자 보호
본 연구는 가톨릭대학교 서울성모병원에서 수행된 단일기관 후향적 연구로, 본 기관의 기관윤리심의위 원회의 승인을 받아 진행하였다(과제번호: KC19R- ESI0491).
연구결과
1. 환자 특성
연구 대상자 선정기간인 2016년 1월부터 2018년 12월까지 NICU에서 TPN을 2주 이상 투여한 미숙 아 135명 중 total protein, albumin이 주 1회 이 상 측정되지 않은 미숙아 13명, 출생 초기 키/체중 측정 후 체중 측정이 주 1회 이상 이루어지지 않은 미 숙아 25명, 선천적 기형 및 대사이상을 보이는 미숙 아 7명을 제외한 대상 환자는 총 90명으로, LD군 19 명, MD군 46명, HD군이 25명이었다.
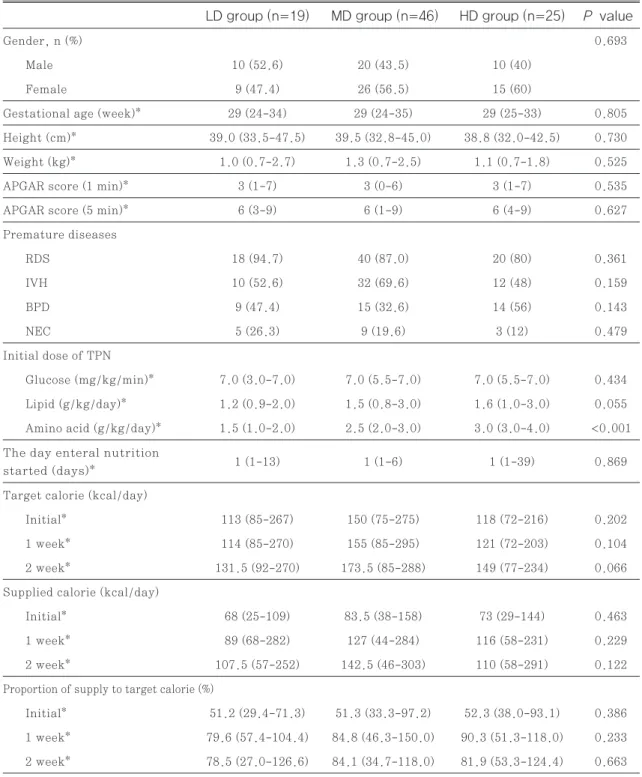
환자의 기본 특성은 성별, 재태연령, 키, 체중, 1분 후 아프가 점수, 5분 후 아프가 점수, 미숙아 관련 질 환, 탄수화물 공급량(glucose infusion rate,
GIR), 지질 공급량, 경장영양 시작 시기, 목표열량 대비 공급열량 비율 등 모든 항목에서 세 군간 유의한 차이가 없었으며, 특히, 대부분의 미숙아에서 초기부 터 극미량이라도 경장영양을 시작하기 때문에 경장영 양 시작 시기의 중앙값은 군에 관계없이 모두 1일이 었다. 아미노산 공급량의 중앙값은 LD군 1.5 g/
kg/day, MD군 2.5 g/kg/day, HD군 3.0 g/
kg/day이었다(Table 1).
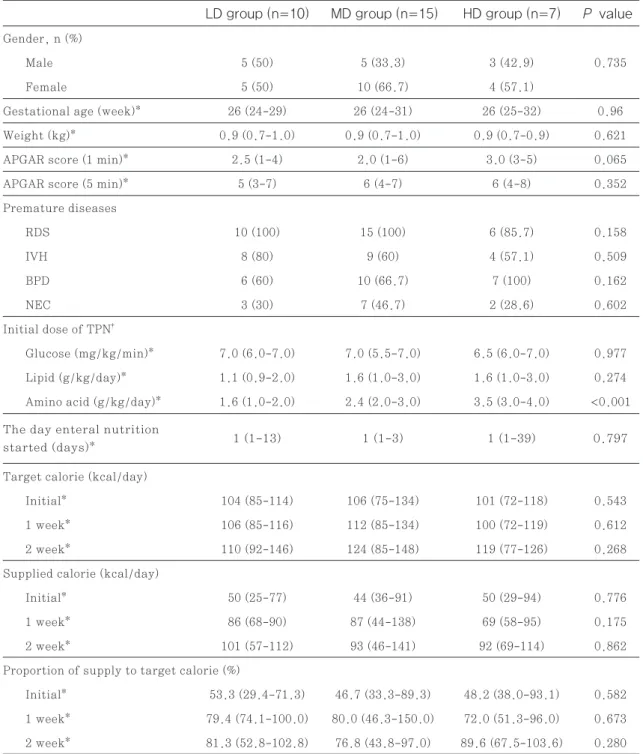
환자 중 ELBW에 해당하는 신생아는 총 32명으로 LD군 10명(31.3%), MD군 15명(46.9%), HD 군 7명(21.9%)이었다. 이들의 기본 특성을 추가 분 석한 결과 세 군간 유의한 차이는 없었다(Table 2).
ELBW 신생아의 경우 출생 시 컨디션 저하로 키 측 정을 하지 못한 경우가 많아 기본 특성 중 키에 대한 분석은 하지 못하였다.
2. 영양상태 개선효과 평가
세 군 모두 출생 후 1주차, 2주차에 total protein, albumin, 체중이 증가한 결과를 보였으며, total protein의 변화량(1주차-출생시 p=0.598, 2주 차-출생시 p=0.906), albumin의 변화량(1주차- 출생시 p=0.476, 2주차-출생시 p=0.931), 체중 의 변화량(1주차-출생시 p=0.747, 2주차-출생시 p=0.46) 모두 세 군간에 유의한 차이는 없었다.
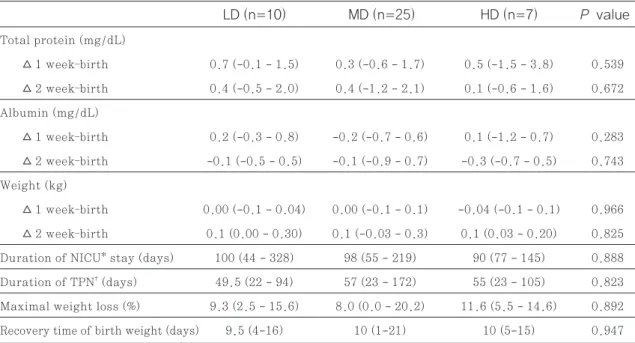
NICU 재원기간, TPN 투여기간, 최대 체중 감소 율, 출생체중 회복 속도(소요일수)도 세 군 간 유의한 차이가 없었다(Table 3).
ELBW에 해당하는 신생아의 경우도 영양상태 개 선의 지표 모두 세 군간 유의한 차이가 없었다(Ta- ble 4).
3. 부작용 평가
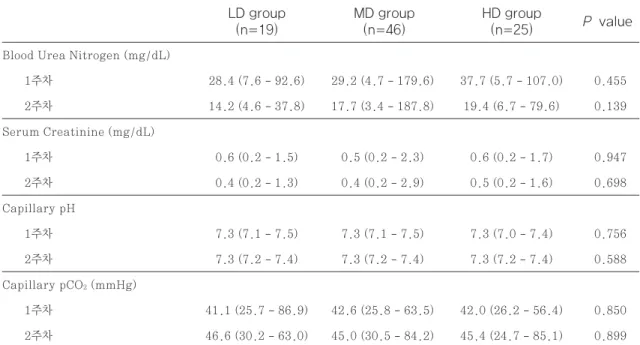
아미노산 공급량에 따른 부작용을 평가하기 위해 TPN 투여 1주차, 2주차에 BUN, Scr, capillary pH, capillary pCO2 측정치를 조사한 결과 모든 항목에서 유의한 차이가 없었으나, BUN은 아미노 산 공급량이 증가할수록 증가하는 경향을 나타내었 다 (투여 1주차 LD군<MD군<HD군, p=0.455, 투여 2주차 LD군<MD군<HD군, p=0.139) (Ta-
ble 5).
ELBW에서도 다른 지표는 유의한 차이나 경향성이 없었으나 BUN은 아미노산 공급량이 증가할수록 증 가하는 경향을 나타내었다(투여 1주차 LD군<MD군
<HD군, p=0.084, 투여 2주차 LD군<MD군
<HD군, p=0.198)(Table 6).
또한, 정맥영양제 투여로 인한 부작용 지표인 혈당 과 AST, ALT, DB, 혈중 칼슘, 혈중 인산 농도에 서도 세 군간 유의한 차이는 나타나지 않았고(Table 7), ELBW에서는 2주차 ALT 수치에서 p-value 가 0.05 미만이었으나 두 군 씩 짝지어 추가로 분석 한 결과에서 유의한 차이를 보이는 군은 없었다(Ta- ble 8).
고찰
ELBW를 포함한 미숙아는 단기적인 유병 뿐 아니 라 장기적인 신체 성장과 신경 발달을 위해 동일 주수 의 자궁 내 태아와 유사한 성장을 목표로 출생 초기부 터 적극적인 영양 공급을 받게 된다.22)-25) 성인과 달 리 미숙아는 포도당만 공급하여서는 단백 분해가 억 제되지 않으며26) 재태 기간이 짧을수록 단백 합성 속 도 뿐 아니라 분해 속도도 빨라서 불충분한 아미노산 이 공급될 경우 음의 질소 평형을 보이게 된다.6),27) 이러한 이유로 과거에는 대사 속도가 빠른 미숙아에 서 성장이 충분히 이루어질 수 있도록 출생 초기에 고 용량의 아미노산을 공급함으로써 단백 합성을 촉진하 고 단백 분해를 저해하여 효과적인 질소평형 상태를 이룰 수 있다고 인식되었으나14)-16) Osborn DA 등 의 최근 cochrane review에서는 출생 초기 고용량 의 아미노산 공급이 사망률 감소, 성장, 신경 발달에 대해 이점을 가진다는 증거가 없다고 보고하고 있 다.28) 이와 같이 미숙아에게 적절한 아미노산과 에너 지의 조기 공급이 성장 지연을 예방한다고는 알려져 있지만29) 적절한 아미노산 공급량에 대한 연구 결과 가 일관되지 않아 미숙아의 영양자문에 어려움이 있 는 실정이다. 이에 본 연구에서는 국내 한 상급종합병 원의 미숙아를 대상으로 아미노산 공급량에 따른 영 양상태 개선 효과와 안전성을 평가해 보고자 하였다.
본 연구결과 영양상태 개선 지표인 total protein, albumin, 체중 변화량에 유의한 차이가 없어, 출생
Table 1 Baseline characteristics of patients
P value HD group (n=25)
MD group (n=46) LD group (n=19)
Gender, n (%) 0.693
Male 10 (52.6) 20 (43.5) 10 (40)
Female 9 (47.4) 26 (56.5) 15 (60)
Gestational age (week)* 29 (24-34) 29 (24-35) 29 (25-33) 0.805
Height (cm)* 39.0 (33.5-47.5) 39.5 (32.8-45.0) 38.8 (32.0-42.5) 0.730
Weight (kg)* 1.0 (0.7-2.7) 1.3 (0.7-2.5) 1.1 (0.7-1.8) 0.525
APGAR score (1 min)* 3 (1-7) 3 (0-6) 3 (1-7) 0.535
APGAR score (5 min)* 6 (3-9) 6 (1-9) 6 (4-9) 0.627
Premature diseases
RDS 18 (94.7) 40 (87.0) 20 (80) 0.361
IVH 10 (52.6) 32 (69.6) 12 (48) 0.159
BPD 9 (47.4) 15 (32.6) 14 (56) 0.143
NEC 5 (26.3) 9 (19.6) 3 (12) 0.479
Initial dose of TPN
Glucose (mg/kg/min)* 7.0 (3.0-7.0) 7.0 (5.5-7.0) 7.0 (5.5-7.0) 0.434 Lipid (g/kg/day)* 1.2 (0.9-2.0) 1.5 (0.8-3.0) 1.6 (1.0-3.0) 0.055 Amino acid (g/kg/day)* 1.5 (1.0-2.0) 2.5 (2.0-3.0) 3.0 (3.0-4.0) <0.001
Target calorie (kcal/day)
Initial* 113 (85-267) 150 (75-275) 118 (72-216) 0.202
1 week* 114 (85-270) 155 (85-295) 121 (72-203) 0.104
2 week* 131.5 (92-270) 173.5 (85-288) 149 (77-234) 0.066
Supplied calorie (kcal/day)
Initial* 68 (25-109) 83.5 (38-158) 73 (29-144) 0.463
1 week* 89 (68-282) 127 (44-284) 116 (58-231) 0.229
2 week* 107.5 (57-252) 142.5 (46-303) 110 (58-291) 0.122
Proportion of supply to target calorie (%)
Initial* 51.2 (29.4-71.3) 51.3 (33.3-97.2) 52.3 (38.0-93.1) 0.386 1 week* 79.6 (57.4-104.4) 84.8 (46.3-150.0) 90.3 (51.3-118.0) 0.233 2 week* 78.5 (27.0-126.6) 84.1 (34.7-118.0) 81.9 (53.3-124.4) 0.663 The day enteral nutrition
started (days)* 1 (1-13) 1 (1-6) 1 (1-39) 0.869
Values are presented as n (%) or median (range)*
RDS; respiratory distress syndrome, IVH; intraventricular hemorrhage, BPD; broncho-pulmonary dysplasia, NEC; necrotizing enterocolitis, TPN; total parenteral nutrition
Table 2 Baseline characteristics of extreme low birth weight
P value HD group (n=7)
MD group (n=15) LD group (n=10)
Gender, n (%)
Male 5 (50) 5 (33.3) 3 (42.9) 0.735
Female 5 (50) 10 (66.7) 4 (57.1)
Gestational age (week)* 26 (24-29) 26 (24-31) 26 (25-32) 0.96
Weight (kg)* 0.9 (0.7-1.0) 0.9 (0.7-1.0) 0.9 (0.7-0.9) 0.621
APGAR score (1 min)* 2.5 (1-4) 2.0 (1-6) 3.0 (3-5) 0.065
APGAR score (5 min)* 5 (3-7) 6 (4-7) 6 (4-8) 0.352
Premature diseases
RDS 10 (100) 15 (100) 6 (85.7) 0.158
IVH 8 (80) 9 (60) 4 (57.1) 0.509
BPD 6 (60) 10 (66.7) 7 (100) 0.162
NEC 3 (30) 7 (46.7) 2 (28.6) 0.602
Initial dose of TPN†
Glucose (mg/kg/min)* 7.0 (6.0-7.0) 7.0 (5.5-7.0) 6.5 (6.0-7.0) 0.977 Lipid (g/kg/day)* 1.1 (0.9-2.0) 1.6 (1.0-3.0) 1.6 (1.0-3.0) 0.274 Amino acid (g/kg/day)* 1.6 (1.0-2.0) 2.4 (2.0-3.0) 3.5 (3.0-4.0) <0.001
Target calorie (kcal/day)
Initial* 104 (85-114) 106 (75-134) 101 (72-118) 0.543
1 week* 106 (85-116) 112 (85-134) 100 (72-119) 0.612
2 week* 110 (92-146) 124 (85-148) 119 (77-126) 0.268
Supplied calorie (kcal/day)
Initial* 50 (25-77) 44 (36-91) 50 (29-94) 0.776
1 week* 86 (68-90) 87 (44-138) 69 (58-95) 0.175
2 week* 101 (57-112) 93 (46-141) 92 (69-114) 0.862
Proportion of supply to target calorie (%)
Initial* 53.3 (29.4-71.3) 46.7 (33.3-89.3) 48.2 (38.0-93.1) 0.582 1 week* 79.4 (74.1-100.0) 80.0 (46.3-150.0) 72.0 (51.3-96.0) 0.673 2 week* 81.3 (52.8-102.8) 76.8 (43.8-97.0) 89.6 (67.5-103.6) 0.280 The day enteral nutrition
started (days)* 1 (1-13) 1 (1-3) 1 (1-39) 0.797
Values are presented as n (%) or median (range)*
RDS; respiratory distress syndrome, IVH; intraventricular hemorrhage, BPD; broncho-pulmonary dysplasia, NEC; necrotizing enterocolitis, TPN; total parenteral nutrition, TPN; total parenteral nutrition
Table 3 Comparison of indicators for nutrition improvement
Table 4 Comparison of indicators for nutrition improvement in extreme low birth weight
P value
P value HD (n=25)
HD (n=7) MD (n=46)
MD (n=25) LD (n=19)
LD (n=10) Total protein (mg/dL)
△ 1 week–birth 0.6 (-0.7 - 2.7) 0.6 (-0.6 - 1.7) 1.0 (-1.5 - 3.8) 0.598
△ 2 week–birth 0.3 (-0.5 - 2.0) 0.4 (-1.2 - 2.1) 0.4 (-1.3 - 1.6) 0.906 Albumin (mg/dL)
△ 1 week–birth 0.2 (-0.5 - 0.8) 0.1 (-2.9 - 0.7) 0.3 (-1.2 - 0.7) 0.476
△ 2 week–birth 0.0 (-0.5 - 0.7) 0.1 (-2.3 - 0.8) 0.2 (-0.7 - 0.7) 0.931 Weight (kg)
△ 1 week–birth 0.00 (-0.13 - 0.11) 0.01 (-0.14 - 0.19) 0.001 (-0.13 - 0.12) 0.747
△ 2 week–birth 0.14 (0.00 - 0.50) 0.18 (-0.09 - 0.75) 0.19 (-0.02 - 0.37) 0.460 Duration of NICU* stay (days) 68 (20 - 328) 60 (1 - 219) 68 (28 - 145) 0.820 Duration of TPN† (days) 35 (15 - 94) 25 (14 - 172) 34 (14 - 105) 0.757 Maximal weight loss (%) 6.9 (0.0 - 15.6) 6.6 (0.0 - 20.2) 10.0 (2.0 - 18.4) 0.206 Recovery time of birth weight (days) 8 (1 - 16) 9 (1 - 21) 9.0 (3 - 16) 0.919
Total protein (mg/dL)
△ 1 week–birth 0.7 (-0.1 - 1.5) 0.3 (-0.6 - 1.7) 0.5 (-1.5 - 3.8) 0.539
△ 2 week–birth 0.4 (-0.5 - 2.0) 0.4 (-1.2 - 2.1) 0.1 (-0.6 - 1.6) 0.672 Albumin (mg/dL)
△ 1 week–birth 0.2 (-0.3 - 0.8) -0.2 (-0.7 - 0.6) 0.1 (-1.2 - 0.7) 0.283
△ 2 week–birth -0.1 (-0.5 - 0.5) -0.1 (-0.9 - 0.7) -0.3 (-0.7 - 0.5) 0.743 Weight (kg)
△ 1 week–birth 0.00 (-0.1 - 0.04) 0.00 (-0.1 - 0.1) -0.04 (-0.1 - 0.1) 0.966
△ 2 week–birth 0.1 (0.00 - 0.30) 0.1 (-0.03 - 0.3) 0.1 (0.03 - 0.20) 0.825 Duration of NICU* stay (days) 100 (44 - 328) 98 (55 - 219) 90 (77 - 145) 0.888 Duration of TPN† (days) 49.5 (22 - 94) 57 (23 - 172) 55 (23 - 105) 0.823 Maximal weight loss (%) 9.3 (2.5 - 15.6) 8.0 (0.0 - 20.2) 11.6 (5.5 - 14.6) 0.892 Recovery time of birth weight (days) 9.5 (4-16) 10 (1-21) 10 (5-15) 0.947
Values are presented as median (range)
NICU*; neonatal intensive care unit, TPN†; total parenteral nutrition
Values are presented as median (range)
NICU*; neonatal intensive care unit, TPN†; total parenteral nutrition
Table 5 Comparison of adverse effects associated high-dose amino acid supplementation
Table 6 Comparison of adverse effects associated high-dose amino acid supplementation in extreme low birth weight
P value
P value HD group
(n=25)
HD group (n=7) MD group
(n=46)
MD group (n=15) LD group
(n=19)
LD group (n=10) Blood Urea Nitrogen (mg/dL)
1주차 28.4 (7.6 - 92.6) 29.2 (4.7 - 179.6) 37.7 (5.7 - 107.0) 0.455 2주차 14.2 (4.6 - 37.8) 17.7 (3.4 - 187.8) 19.4 (6.7 - 79.6) 0.139 Serum Creatinine (mg/dL)
1주차 0.6 (0.2 - 1.5) 0.5 (0.2 - 2.3) 0.6 (0.2 - 1.7) 0.947
2주차 0.4 (0.2 - 1.3) 0.4 (0.2 - 2.9) 0.5 (0.2 - 1.6) 0.698
Capillary pH
1주차 7.3 (7.1 - 7.5) 7.3 (7.1 - 7.5) 7.3 (7.0 - 7.4) 0.756
2주차 7.3 (7.2 - 7.4) 7.3 (7.2 - 7.4) 7.3 (7.2 - 7.4) 0.588
Capillary pCO2 (mmHg)
1주차 41.1 (25.7 - 86.9) 42.6 (25.8 - 63.5) 42.0 (26.2 - 56.4) 0.850 2주차 46.6 (30.2 - 63.0) 45.0 (30.5 - 84.2) 45.4 (24.7 - 85.1) 0.899
Blood Urea Nitrogen (mg/dL)
1주차 29.6 (11.0 - 92.6) 35.7 (13.6 - 179.6) 60.3 (37.7 - 107.0) 0.084 2주차 17.6 (4.6 - 37.8) 20.5 (3.4 - 187.8) 31.6 (9.8 - 79.6) 0.198 Serum Creatinine (mg/dL)
1주차 0.9 (0.2 - 1.5) 0.7 (0.2 - 2.3) 1.2 (0.2 - 1.7) 0.705
2주차 0.5 (0.3 - 1.3) 0.7 (0.2 - 2.9) 0.8 (0.4 - 1.6) 0.602
Capillary pH
1주차 7.3 (7.1 - 7.4) 7.3 (7.2 - 7.4) 7.2 (7.0 - 7.3) 0.321
2주차 7.3 (7.2 - 7.3) 7.3 (7.2 - 7.4) 7.2 (7.2 - 7.4) 0.047
Capillary pCO2 (mmHg)
1주차 45.8 (30.5 - 86.9) 39.0 (25.8 - 62.0) 41.8 (26.2 - 56.0) 0.549 2주차 46.7 (35.8 - 63.0) 41.6 (33.8 - 58.0) 44.0 (32.8 - 59.6) 0.402
Values are presented as median (range)
Values are presented as median (range)
초기 고용량 아미노산의 공급으로 인한 추가적인 영 양학적 이점을 확인할 수 없었다. 영양상태 개선 지표 를 통해 성장 발달의 차이가 없었을 것으로 예측할 수 있으므로 NICU 재원기간과 TPN 투여기간, 최대 체 중 감소율, 출생체중 회복 속도에서도 유의한 차이가 나타나지 않은 것으로 보인다.
부작용 지표로는 출생 후 1주차와 2주차에 BUN과 Scr 측정치를 비교하였는데, 세 군 간 유의한 차이가 없었다. 다만, 아미노산 공급량이 증가할수록 BUN 도 증가하는 경향성을 나타내었다. Ridout E 등의 연구에서는 미숙아에서 BUN과 아미노산 공급 사이 에 연관성이 없음을 보고하였으나30) 소규모 연구이며
실제 임상에서 아미노산 공급의 모니터링 지표로 BUN이 많이 사용되고 있으므로4) 고용량의 아미노 산 공급 시 적극적인 신기능 모니터링이 필요할 것으 로 사료된다.
Te Braake 등은 미숙아를 대상으로 출생 첫날 2.4 g/kg/day의 아미노산을 공급한 군과 생후 3일 째 2.4 g/kg/day에 도달하도록 점진적으로 증량한 군으로 나누어 비교하였는데 동맥혈 가스 검사 결과 에 유의한 차이가 없었으며,15) Jadhav P 등의 연구
31)와 Trivedi A 등의 연구32)에서 대사성 산증과 아 미노산 공급과의 관련성이 없음을 보고한 바와 같이 본 연구에서도 capillary pH와 pCO2는 세 군에서 Table 7 Comparison of adverse effects associated parenteral nutrition 5 Comparison of adverse effects associated high-dose amino acid supplementation
P value HD group
(n=25) MD group
(n=46) LD group
(n=19) Glucose (mg/dl)
1주차 151 (87-475) 142 (78-691) 163 (72-380) 0.659
2주차 116 (58-247) 118 (56-569) 109 (74-522) 0.904
Aspartate transaminase (IU/L)
1주차 21.0 (14.0-47.0) 18.5 (12.0-86.0) 21.0 (13.0-225.0) 0.697
2주차 18.0 (13.0-37.0) 20.5 (7.0-59.0) 18.0 (0.6-76.0) 0.816
Alanine transaminase (IU/L)
1주차 6 (5-10) 6 (5-15) 5 (5-37) 0.514
2주차 6 (5-23) 8 (5-22) 7 (5-23) 0.094
Direct bilirubin (mg/dl)
1주차 0.8 (0.4~1.3) 0.7 (0.3~1.6) 0.6 (0.5~1.6) 0.232
2주차 0.5 (0.3~1.1) 0.6 (0.3~2.0) 0.6 (0.3~6.0) 0.333
Serum calcium (mg/dl)
1주차 9.8 (8.4-13.3) 10.0 (8.5-12.7) 10.1 (8.1-12.8) 0.211
2주차 9.8 (8.2-10.7) 9.7 (8.2-10.9) 9.8 (8.8-11.1) 0.777
Serum phosphorus (mg/dl)
1주차 3.6 (2.0-6.0) 4.2 (2.0-7.5) 4.2 (2.0-7.4) 0.295
2주차 5.0 (3.5-9.8) 5.3 (2.2-7.2) 5.5 (3.5-7.1) 0.689
Values are presented as median (range)
유의한 차이가 없었다.
미숙아는 출생 후 모체로부터 영양 공급이 중단되므 로 조기에 영양이 공급되지 않으면 이화 작용으로 세 포 내 이온이 방출되어 고인산혈증 및 저칼슘혈증이 나타난다. 반대로, 출생 초기 적극적으로 영양공급을 할 경우 동화작용을 촉진시켜 인이 빠르게 성장하는 세포로 흡수되어 저인산혈증 및 고칼슘혈증이 관찰될 수 있다.17)-20) 본 연구에서는 혈중 칼슘 농도와 혈중 인산 농도에 있어 세 군간 유의한 차이가 나타나지 않 았는데, 이는 본원에서 고용량의 아미노산 공급 시 적 극적인 모니터링을 통해 전해질 불균형을 교정하여 주었기 때문으로 사료된다. 또한 고용량 아미노산 공
급 시 내인성 인슐린의 분비 증가로 오히려 혈당이 감 소할 수 있으며, 정맥영양을 통한 당 공급으로 인해 혈당이 상승할 수도 있어 혈당 수치를 조사하였으며 역시 세 군 간 유의한 차이가 없었다. PN에 의한 간 부작용 지표인 AST와 ALT, DB도 유의한 차이가 없었으며, 이를 통해 간 부작용이 아미노산 공급량보 다 지방유제의 구성성분 및 공급량과 TPN 공급 기간 에 영향을 받는다는 기존의 연구 결과와 유사함을 확 인할 수 있었다.33)-35)
ELBW를 대상으로 한 초기 고용량 아미노산 공급 관련 연구에서 영양 및 성장 개선과 함께 부작용으로 BUN 상승과 저인산혈증, 고칼슘혈증이 나타났다고 Table 8 Comparison of adverse effects associated parenteral nutrition in extreme low birth weight
P value HD group
(n=7) MD group
(n=15) LD group
(n=10) Glucose (mg/dl)
1주차 186.5 (117-475) 178 (139-639) 226 (72-380) 0.855
2주차 137.5 (93-247) 146 (56-569) 171 (98-522) 0.641
Aspartate transaminase (IU/L)
1주차 20.0 (14.0-47.0) 28.0 (13.0-86.0) 28.0 (17.0-225.0) 0.180
2주차 17.5 (13.0-34.0) 21.0 (7.0-59.0) 26.0 (15.0-33.0) 0.184
Alanine transaminase (IU/L)
1주차 5.5 (5-10) 6 (5-15) 6 (5-37) 0.312
2주차 6 (5-9) 9 (5-22) 8 (6-23) 0.037
Direct bilirubin (mg/dl)
1주차 0.8 (0.4-1.3) 0.7 (0.3-1.1) 0.6 (0.5-1.5) 0.432
2주차 0.6 (0.3-1.1) 0.6 (0.3-1.7) 0.7 (0.3-4.0) 0.982
Serum calcium (mg/dl)
1주차 9.5 (8.4-10.5) 10.1 (8.5-12.3) 10.6 (8.1-12.8) 0.120
2주차 9.5 (8.2-10.6) 9.7 (8.2-10.9) 9.7 (8.8-11.1) 0.772
Serum phosphorus (mg/dl)
1주차 4.0 (2.1-6.0) 3.8 (2.0-7.1) 3.7 (2.0-5.5) 0.817
2주차 5.2 (4.4-9.8) 4.3 (2.7-7.2) 4.8 (3.5-5.8) 0.189
Values are presented as median (range)
보고하였으나 본 연구에서는 추가적인 영양학적 이점 과 부작용 모두 유의한 차이가 없었다. 미숙아 대상과 동일하게 아미노산 공급량이 증가할수록 BUN도 증 가하는 경향성을 나타냈다는 점을 고려하여 ELBW 에게 고용량의 아미노산 공급 시 적극적인 신기능 모 니터링이 필요할 것으로 사료된다.
본 연구는 전자의무기록을 후향적으로 조사한 연구 로서, 재태기간이 짧을수록 소변으로의 단백 소실이 증가하기 때문에 아미노산을 공급해주어도 음의 단백 균형 및 총체적인 단백 결핍이 발생할 수 있으나36),37) 대상 환자 수의 부족으로 재태기간에 따른 하위그룹 분석을 실시하지는 못하였다. 다만, 세 군의 재태기 간 중앙값이 동일하였으므로 재태기간의 차이가 연구 결과에 미치는 영향은 미미했을 것으로 사료된다. 또 한, 출생 초기에는 부작용 지표에 해당하는 실험실적 검사 시행이 미비하여 TPN 투여 1주차와 2주차의 결과만을 세 군 간 비교할 수 있었다. 이에 더하여, 고용량의 아미노산 공급이 신경 발달과 성장에 미치 는 장기적인 영향은 추적하지 못하였으므로 추후 전 향적인 연구와 장기적인 영향에 대한 연구가 더 필요 할 것으로 보인다.
결론
1 g/kg/day 이상으로 아미노산 공급을 시작하는 미숙아에게 있어 초기 아미노산 공급량을 더 증가시 킬 경우의 추가적인 영양상태 개선 효과를 확인할 수 없었다. 또한, 아미노산 공급량에 따라 부작용이 증 가하지는 않았으나 BUN 상승 경향을 고려할 때 고 용량 아미노산 투여 시 신기능 등의 모니터링이 요구 되며, 향후 전향적인 추가 연구가 필요할 것으로 사 료된다.
참고문헌
1) van Goudoever JB, Carnielli V, Darmaun D et al. ESPGHAN/ESPEN/ESPR/CSPEN guidelines on pediatric parenteral nutri- tion: Amino acids. Clin Nutr. 2018;37(6):
2315-23.
2) Valentine CJ, Puthoff TD. Enhancing
parenteral nutrition therapy for the ne- onate. Nutrition in Clinical Practice.
2007;22(2):183-93.
3) Riskin A, Hartman C, Shamir R. Paren- teral Nutrition in Very Low Birth Weight Preterm Infants. The Israel Medical As- sociation journal: IMAJ. 2015;17(5):310-5.
4) Mark R. Corkins Jb, Elizabeth bobo, ste- ve plogsted. The A.S.P.E.N. Pediatric nutrition support core curriculum, 2nd ed. United states of America. 2015;AS- PEN:594-6.
5) Chang YS. Nutritional support in pre- mature infants. Hanyang Medical Re- views. 2011;31(4):246-53.
6) Ziegler E, O’donnell A, Nelson S et al.
Body composition of the reference fetus.
Growth. 1976;40(4):329-41.
7) Brownlee K, Kelly E, Ng P et al. Early or late parenteral nutrition for the sick preterm infant? Archives of disease in childhood. 1993;69(3 Spec No):281-3.
8) Ho M-Y, Yen Y-H, Hsieh M-C et al. Ear- ly versus late nutrition support in pre- mature neonates with respiratory dis- tress syndrome. Nutrition. 2003;19(3):
257-60.
9) Shulman DI, Kanarek K. Gastrin, Moti- lin, Insulin, and Insulin-Like Growth Factor-I Concentrations in Very-Low- Birth-Weight Infants Receiving Enteral or Parenteral Nutrition. Journal of Par- enteral and Enteral Nutrition. 1993;17 (2):130-3.
10) Van Goudoever J, Colen T, Wattimena J et al. Immediate commencement of amino acid supplementation in preterm infants: effect on serum amino acid concentrations and protein kinetics on the first day of life. The Journal of pediatrics. 1995;127(3):458-65.
11) Osborn DA, Schindler T, Jones LJ et al.
Higher versus lower amino acid intake in parenteral nutrition for newborn in- fants. Cochrane Database Syst Rev.
2018;3:CD005949.
12) Thureen PJ. Effect of Low versus High Intravenous Amino Acid Intake on Very Low Birth Weight Infants in the Early Neonatal Period. Pediatric Research.
2003;53(1):24-32.
13) Porcelli PJ, Jr, Sisk PM. Increased par- enteral amino acid administration to extremely low-birth-weight infants during early postnatal life. J Pediatr Gastroenterol Nutr. 2002;34(2):174-9.
14) Thureen PJ, Melara D, Fennessey PV et al. Effect of low versus high intrave- nous amino acid intake on very low birth weight infants in the early neona- tal period. Pediatric research.
2003;53(1):24-32.
15) Te Braake FW, van den Akker CH, Wat- timena DJ et al. Amino acid adminis- tration to premature infants directly after birth. The Journal of pediatrics.
2005;147(4):457-61.
16) Hans DM, Pylipow M, Long JD et al.
Nutritional practices in the neonatal intensive care unit: analysis of a 2006 neonatal nutrition survey. Pediatrics.
2009;123(1):51-7.
17) Moltu SJ, Strømmen K, Blakstad EW et al. Enhanced feeding in very-low- birth-weight infants may cause elec- trolyte disturbances and septicemia–a randomized, controlled trial. Clinical nutrition. 2013;32(2):207-12.
18) Bonsante F, Iacobelli S, Latorre G et al.
Initial amino acid intake influences phosphorus and calcium homeostasis in preterm infants–it is time to change the
composition of the early parenteral nu- trition. PloS one. 2013;8(8):e72880.
19) Mizumoto H, Mikami M, Oda H et al.
Refeeding syndrome in a small-for- dates micro-preemie receiving early parenteral nutrition. Pediatrics Inter- national. 2012;54(5):715-7.
20) Ichikawa G, Watabe Y, Suzumura H et al. Hypophosphatemia in small for ges- tational age extremely low birth weight infants receiving parenteral nutrition in the first week after birth. Journal of Pediatric Endocrinology and Metabo- lism. 2012;25(3-4):317-21.
21) ASPEN. ASPEN Appropriate dosing for parenteral nutrition ASPEN recom- mendations2019.
22) Pediatrics AAo, Pediatrics AAo. Com- mittee on Nutrition. Nutritional needs of low-birth-weight infants. Pediat- rics. 1985;75(5):976-86.
23) REQUIREMENT C. Nutritional needs of low-birth-weight infants. Pediatrics.
1985;75(5):976-86.
24) Lapillonne A, Griffin IJ. Feeding pre- term infants today for later metabolic and cardiovascular outcomes. The Jou- rnal of pediatrics. 2013;162(3):S7-S16.
25) Stephens BE, Walden RV, Gargus RA et al. First-week protein and energy in- takes are associated with 18-month de- velopmental outcomes in extremely low birth weight infants. Pediatrics. 2009;
123(5):1337-43.
26) Denne SC, Karn CA, Wang J et al. Ef- fect of intravenous glucose and lipid on proteolysis and glucose production in normal newborns. American Journal of Physiology-Endocrinology And Metab- olism. 1995;269(2):E361-E7.
27) Denne SC, Poindexter BB, editors. Evi-
dence supporting early nutritional sup- port with parenteral amino acid infu- sion. Seminars in perinatology; 2007:
Elsevier.
28) Osborn DA, Schindler T, Jones LJ et al.
Higher versus lower amino acid intake in parenteral nutrition for newborn in- fants. Cochrane Database of Systemat- ic Reviews. 2018;3.
29) Neu J, Hauser N, Douglas-Escobar M, editors. Postnatal nutrition and adult health programming. Seminars in fetal and Neonatal Medicine; 2007: Elsevier.
30) Ridout E, Melara D, Rottinghaus S et al. Blood urea nitrogen concentration as a marker of amino-acid intolerance in neonates with birthweight less than 1250 g. Journal of perinatology. 2005;
25(2):130-3.
31) Jadhav P, Parimi PS, Kalhan SC. Par- enteral amino acid and metabolic acido- sis in premature infants. Journal of Parenteral and Enteral Nutrition. 2007;
31(4):278-83.
32) Trivedi A, Sinn JK. Early versus late administration of amino acids in pre- term infants receiving parenteral nu- trition. Cochrane Database of System- atic Reviews. 2014;7.
33) Nandivada P, Cowan E, Carlson S et al.
Mechanisms for the effects of fish oil lipid emulsions in the management of parenteral nutrition-associated liver disease. Prostaglandins, Leukotrienes and Essential Fatty Acids. 2013;89(4):
153-8.
34) Lam HS, Tam YH, Poon TC et al. A dou- ble-blind randomised controlled trial of fish oil-based versus soy-based lipid preparations in the treatment of in- fants with parenteral nutrition-associ-
ated cholestasis. Neonatology. 2014;
105(4):290-6.
35) Kelly DA. Intestinal failure–associated liver disease: what do we know today?
Gastroenterology. 2006;130(2):S70-S7.
36) Hay WW, Lucas A, Heird WC et al.
Workshop summary: nutrition of the extremely low birth weight infant.
Pediatrics. 1999;104(6):1360-8.
37) Denne S. Protein and energy require- ments in preterm infants. Seminars in neonatology. 2001;6(5):377-82.