Characterization of Subway MVAC System in Seoul
Kun Li Jung Hee Jang Young Min Jo ⋅ ⋅
Dept. of Environmental Science & Engineering, Green Energy Research Group, Kyunghee University
Abstract
Seoul is one of the most dynamic capital cities in the world of which population is about 10.49 million.
The air quality of Seoul subway is a great concern to users and the public authorities, especially the pollution of particulate matters. The metallic particulate matters are generated from the friction of wheels and subway rails, which causes dispersion into the platform and even to the trains. This study attempted to characterize the current filters in subway MVAC system and a newly developed filter which was a type of thin electret fiber bundle. Collection efficiency of the filtration system varies from 20% to 90% depending on filter life and dust particle size. The removal of fine dust with diameter smaller than 1 , which could not ㎛ be well achieved by current filtration system, is very important in the subway air cleaning system. The new electret filter was found to have a high potential for the use in subway MVAC with high collection efficiency, especially for fine mode dust.
Keywords : Subway air quality MVAC; Fine dust filtration; Fibrous filter Thin fiber bundle electret filter
(TFBE filter)
1. Introduction
Metro-subway is considered to be the most con- venient mode of commuter transportation in Seoul.
Everyday about ten million people would make use of it. The air quality in the subway, particularly dust lev- el, has been a significant concern of the passengers and the government (Korea MOE, 2004). Many re- searchers reported that the subway particles were more genotoxic than street particles and induce oxida- tive stress in cultured human lung cells (Park and Ha, 2008; Harrison et al., 1997; Chow et al., 2002;
Karlsson et al., 2005). More international studies show that the presences of ultra-fine particles in sub- way increase the human health problems. By Kim’s research (2008), taking both worker and passenger areas into consideration, the concentration of PM in Seoul metro subway was relatively higher on plat- forms, in passenger carriage and in driver compart- ments, all of which are part of the subway operation space. Pfeiffer et al. (1999) concluded that the main cause of PM pollution is related to the dispersion into the air of inorganic metallic dust resulting from the deterioration of the subway station internal facilities as well as the friction between the railway line and the train wheels during normal operation.
Many ways are currently being explored to de- crease the particle concentration such as electrostatic precipitator (Tokarek et al. 2006), filtration method (Wang, 2001), cyclone dust collector (Wan, 2008) and so on. These are curative treatment with the aim to treat the ambient air using suitable systems placed in the station. The air filter is widely used in the indoor
air control system because of several advantages: low pressure drop and convenient operation (Wang, 2001).
Ensuring clean indoor air quality requires the assis- tance of effective air filtration systems. It is important to note that certain filters, specifically those greater than 30% efficiency, may increase static pressures causing problems to the blowers of the Mechanical Ventilation and Air-Conditioning (MVAC) system.
Essentially, there are three types of filter technologies:
impingement, electrostatic and adsorption. Imping- ement and electrostatic air filters are used to remove particulate concentrations from the air (Lee et al., 1996), whereas, adsorption type filters (Riyad et al.
1998, Yang et al. 2008) are used to eliminate gases present in the air through the adsorption.
In this research, performance of the filtration sys- tem and characteristics of dust collected by the filter in subway stations of Seoul were examined in the lab and real-time field test. The close examination may present the better condition for fine dust filtration of the metro-subway system.
2. Experimental Methods
2.1 Subject details
There are two subway systems in Seoul, as such,
subway lines 1-4 are operated by the Seoul Metro-
politan Subway Corporation (SMSC), while subway
lines 5-8 are managed by the Seoul Metropolitan
Rapid Transit Corporation (SMRTC). Among these
lines, line 1 and line 2 are quite old ones and environ-
mentally poor. Two underground stations (N-station
and J-station) of the line 1 and line 2 were selected for the test. The MVAC systems (Figure 1.) of these two stations employ the filtration system of which fil- ter is fixed in a pleated structure to obtain a large fil- tration surface. The air from outside and all the return streams are mixed in the plant-room, and then passed though the Air Handling Unit, where the fine dust la- den by the air could be separated by the fibrous filters. The cleaned air is then recirculated to the con- course and platform public. The dust sampling was fulfilled at the point of 0.5 m from the filter in the upstream and downstream at every 15 min regularly.
2.2 Test method
In order to comply with the acceptable IAQ of the subway (Korea MOE, 2004), periodic maintenance of the ventilation system is essential. Therefore, the filter in the air control system is being replaced periodi- cally, usually once or twice per month. In this study, when replacing the filter, the used filters were taken from the field station and brought carefully to the lab- oratory (2008.5-2008.12). A micromanometer (PLT-
D5000Pa, ULFA Technology Co. Ltd.) was used to measure the pressure drop, △ P, across the test filters.
The filtration velocity was set as lower than 2.5 m/s which are the designed maximum flow velocity of the subway MVAC system. The characteristics of the sub- way filter including the basis weight, thickness, mean fiber diameter and packing fraction were evaluated.
Based on 100 fiber diameter value measured by SEM-EDX (SS-550, Shimadzu Corporation), the mean diameter of test filters was calculated by the log prob- ability way (Hinds, 1998), this is mostly applied to the lognormal particle size distribution analysis.
2
f g g
d =d exp(pln σ )
(1)
where
dgthe geometric mean diameter,
dfthe arith- metic mean diameter and p is a parameter which serves to define the various possible diameters with the values of
df, 0.5. Use of log probability method is the simplest way to determine the mean and geo- metric standard deviation (
σg) provided the dis- tribution does indeed follow a lognormal shape.
The packing fraction of the test filters was calcu- lated by the empirical model of Davies (1973),
2
μtuf(α)
P r
Δ =
(2)
1m 2m
3m
2m Air from outside Filetr
Pump
Optical aerosol spectrometer
Air from system Air from inside
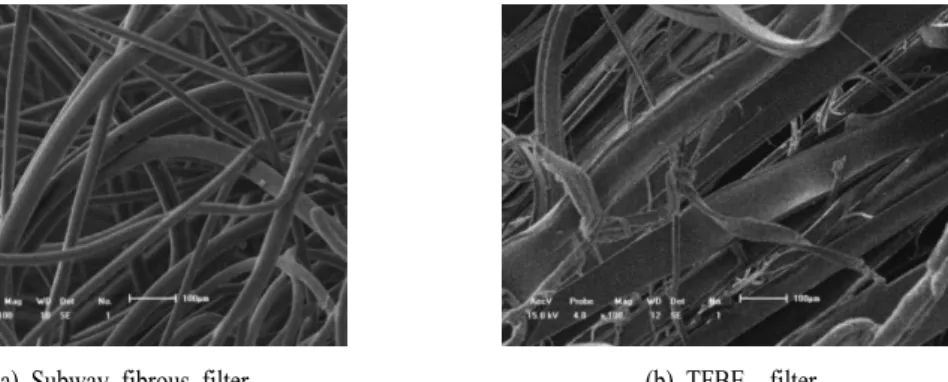
(a) Subway fibrous filter (b) TFBE filter
1.5 3
f(α)=64α (1+56α )
for 0.006< α < 0.3 (3) where
ΔPis the pressure drop across the filter; μ the air viscosity; t the filter thickness; u the face ve- locity; r the fiber diameter and α is the packing density. The filters tested in the study include the TFBE filter with special three-dimensional structure.
It shows nonperpendicular alignment of the fibers to the air flow, of which equation is based on an empiri- cal correlation including nonideal effects.
The collected dust on the current filters was charac- terized in size distribution by using Malvern M-sizer (MSS0010, Malvern Instruments Ltd.). Particle den- sity was measured by an Auto Pycnometer (AccuPyc 1330, Micrometric Instrument Corporation).
As the freshfilter was installed, the efficiency of dust collection was measured every day at 12 am until the next replacement (2009.1-2009.2). Two optical aerosol spectrometers (Model 1.108, Grimm Aerosol Tech-nik, Ainring, Germany) counted the dust par- ticles in the inflow and outflow before and after the filters in real time and each time lasted for 15~25 min. It could automatically calculate the mass concen- tration by gravimetric correction factor based on the assumption of spherical particles. Filtration perform- ance was tested by evaluation of the mass efficiency (
ηm), as the equation
down m
up
η =1-m
m
(4)
where
mdown( / ) are the downstream particle mass ㎍ ㎥ concentration, and
mup( / ) stand for the upstream ㎍ ㎥ particles mass concentration.
Electrostatic filters are composed of almost perma- nently charged Electrostatic fibers, and are widely used in the application requiring high collection effi- ciency with low pressure drop (Brown et al, 1988).
They capture the fine particles by electrostatic forces between particle and fibers rather than physical mech- anisms of inertia impaction or direct interception. Air filters produced with charged and Electrostatic media for MVAC filtration applications have gained sig- nificant market share and acceptance over the past few years.
A kind of thin fiber bundle Electrostatic filter, TFBE filter would be used in the experiment for the evaluation of filtration performance in practical MVAC room. At the filter replace day (2009.7.15), four TFBE filters cells with different thickness (A-10 , B and C-14.5 , D-22 ) were connected to four
㎝ ㎝ ㎝
same 20 ×20 ㎝ ㎝ areas without subway fibrous filter
in the MVAC pleated filter wall, as shown in Figure
1. Then, the upstream and downstream particles con-
centration of the four TFBE filters cells and MVAC
fibrous filter were measured by the OPS at the same
time. It could be observed that the face velocity of
four test filter cells and MVAC filtration wall is some
different with each other due to turbulence flow near
the filter cells. Therefore, a same area of subway fi-
brous filter cell was made and connected to the wall
without filter in two days later and then the upstream
and downstream particles concentration of these cells
would be measured in the following days. Then the
long term performance of the five filter cells and MVAC filtration room were evaluated until the next filter replacing day.
3. Results and discussions
3.1 Characterization of subway filter The MVAC systems of the two stations are mostly employing fibrous filters with the thickness of 10~15 mm. Figure 2 shows the SEM plates of the subway fibrous filters and test TFBE filter. The current sub- way filter is a type of non-woven fibrous filter made of polypropylene. TFBE filter consists of electrically charged thin fiber bundles. The characteristics of the current subway filter and TFBE filter are presented in
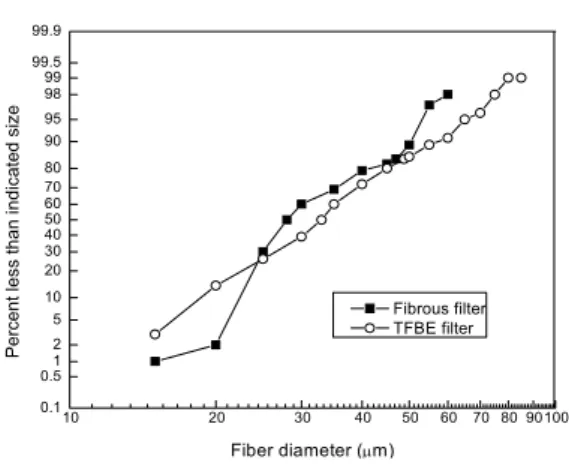
Table 1. Based on the Log(s) plot, fiber diameters of subway filter and TFBE filter are shown in Figure 3.
The low packing density might results in low pressure drop even facing high flow velocity of 2.5 m/s.
As for long term performance, pressure drop across the filter media is one of the most significant parame- ters to directly affect the energy consumption and fil- ter life. Figure 4 shows the variations of pressure drop of the fresh filters and the used filters in each station versus filtration velocity. Sample ID represents the fil- ter sampling date and station (N-station and J-station).
After a circle time, five dirty pieces were taken from different positions of each filter, and then measured the pressure drop with filtration velocity. The used fil- ters with dust showed high pressure drop at every fil- tration velocity than fresh filters of both test stations.
(a) Subway fibrous filter (b) TFBE filter
Filter type Basis weight (g/ ) ㎡
Thickness ( ) ㎜
Mean fiber diameter
( ) ㎛ Calculated packing fraction Fibrous filter
TFBE filter
345 5300
10-15 100,140,220
32.40 36.00
0.0222
0.0091
The overall pressure drop across the filter media in- cludes pressure drop of both across the clean medium and the dust layer collected in the filter. The filter used in N-station was of higher pressure drop; even it began with similar values of fresh medium. Samples N-9 and 10 (October~November)hold much more dust inside of the filter per unit area and thickness. Thus, the MVAC system in Seoul Metro should consider such an irregular overload inlet flow. J-9 and 10, which were examined for similar days to N-9 and 10, also showed relatively high dust loading on the filter, resulting in high pressure drop. Even in the same sta-
tion, it was found that the collected dust amount on the filter was different from sampling dates.
As can be seen in Table 2, the mean filter thickness does not relate consistently with dust loading or pres- sure drop. More deposition of particles could be pos- sible depending on the air quality outside of the sub- way station. Research by Furuya et al. (2001) showed that the concentration of PM in subway environment varies greatly according to the season. On the whole, higher loading of dust leads to higher pressure drop with a few exceptional cases. The pressure drops of most samples are lower than 25.5 mmH 2 O (250 Pa) except sample N-1, which is the minimum final resist- ance for coarse dust filter according to ASHRAE 52.2-1999.
3.2 Examination of collected dust
Figure 5 and Figure 6 show the mass concentration of each size particles and size distribution of particles in the upstream of the MVAC room in N-station. This results show that the particles with diameter smaller than 1 ㎛ compose the most part of the particles in the subway MVAC room. And the concentration of
10 20 30 40 50 60 70 80 90100
0.1 0.512 5 10 20 30 40 50 60 70 80 90 95 98 99.599 99.9
Fibrous filter TFBE filter
Percent less than indicated size
Fiber diameter (μm)
0 10 20 30 40 50
0 0.5 1 1.5 2 2.5 3
Face velocity (m/s)
Pressure drop (mmH2O) N N-1 N-2 N-3N-4 N-5 N-6
N-7 N-8 N-9
N-10
0 10 20 30 40 50
0 0.5 1 1.5 2 2.5 3
Face velocity (m/s)
Pressure drop (mmH2O) N J-1 J-2 J-3J-4 J-5 J-6
J-7 J-8 J-9
J-10
Sample Filters Used filter mean thickness ( ) ㎜
Dust loading w (kg-dust/ ·m-filter) ㎡
△ P ( H ㎜ 2 O/ ) ㎜ (u=2.5m/s) N-1
N-2 N-3 N-4 N-5 N-6 N-7 N-8 N-9 N-10
J-1 J-2 J-3 J-4 J-5 J-6 J-7 J-8 J-9 J-10
13.80 14.60 14.20 11.60 14.20 10.00 13.50 14.40 11.80 10.20 10.00 9.40 11.60 13.50 13.50 10.40 11.20 13.80 10.60 10.30
16.88 12.67 13.10 15.72 17.55 28.29 12.35 13.84 28.73 22.93 8.52 10.30 8.41 6.01 8.54 16.68 12.37 6.36 17.20 11.47
1.52 1.35 1.43 1.40 1.61 2.46 1.31 1.39 3.45 2.49 0.94 0.94 1.01 0.85 1.21 2.16 1.73 1.01 1.99 2.19
0 5 10 15 20 25 30 35 40 45 50
0.1 1.0 10.0 100.0
Particle size (µm)
Mass concentration (µg/m3)n 2009.1.21 1.22 1.23 1.24
1.25 1.26 1.27 1.28
1.29 1.30 2.1 2.3
2.5 2.9 2.10 2.12
0 20 40 60 80 100
0.1 1.0 10.0 100.0
Particle size (µm)
Cumulative distribution (%) nnn
2009.1.21 1.22
1.23 1.24
1.25 1.26
1.27 1.28
1.29 1.30
2.1 2.3
2.5 2.9
2.10 2.12
0 20 40 60 80 100
0.01 0.10 1.00 10.00 100.00 1000.00 10000.00 Particle size (µm)
Cumulative distribution (%) n
J-1 N-1 J-2 N-2 N-3 J-3 N-4 J-4 N-5
J-5 N-6 J-6 N-7 J-7 N-8 J-8 Ash N-9
J-9 N-10 J-10
particles smaller than 3 ㎛ account for 50% of the to - tal particles concentration. Few particles larger than 3 in diameter were present upstream from the test
㎛
filters because relatively few of this size of particles reside in the ambient environment and because the pre-filters were effective at removing particles of this size. The fine mode particles are one of critical fac- tors that the MVAC of Seoul Metro should focus on.
Particles of this size come mainly from outside air and partly from the inner circulation of subway tunnel. Figure 7 shows the cumulative size dis- tribution of dust particles separated from the field filters. An analyzer with laser diffraction was applied to measure the particle size on the mass basis. It shows that the median size of dust collected on the subway filter is changeable to a certain extent but mostly in the range of PM 10 except the N-1 sample with a larger mean diameter of 15.55 ㎛ . While the filtration room is efficient to collect the dust larger than 1 , it shows low filtration efficiency for par ㎛ - ticles smaller than 1 . This is a significant dis ㎛ - advantage of the current fibrous filter used in subway MVAC room.
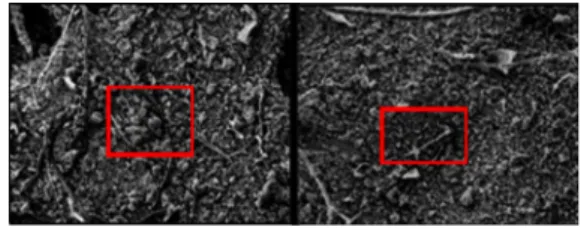
Figure 8 is SEM plates of the dust collected on the filters, which is very irregular. Dust density was about 2.3~2.5 g/ . Chemical elements were analyzed by ㎤ SEM/EDX, although it may vary with the focused particles, the largest parts of the composition for both stations was iron, some of the iron can be explained by contributions from the re-suspension of earth or geological materials from the railway, but the level of enrichment suggests an additional non-geological source. This is probably because of the friction be- tween the wheels and the railway during operation.
Other elements are associated with a predominantly geological source, including Mg, Al, Si, Ca, Ba.
Carbon may be a part of organic carbons from the outdoor.
3.3 Long term performance of filtration system As for the filtration of mechanical filter, particles smaller than 0.5 ㎛ in diameter are collected primarily due to Brownian diffusion whereas particles larger than 1 ㎛ in diameter are collected due to interception, impaction and electrostatic attraction (Brown, 1988).
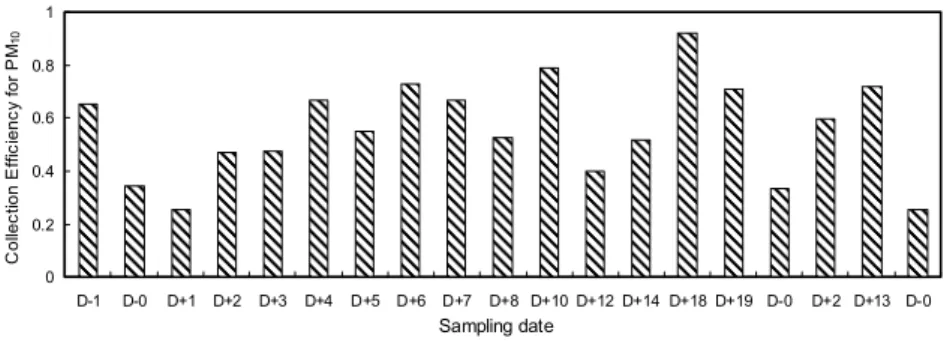
Figure 9 is the overall dust collection efficiency for 1 month including the three times of replacement.
Fresh filters were inserted in the morning at 22 nd of
Jan and 10 th and 23 rd of Feb. The particles mass effi
ciency was measured in two sequential periods.
Generally, the collection efficiency shows consistently increase with dust loading. This trend could be often seen in conventional filters as predicted. A few ex- ceptions, 3 rd and 5 th of Feb (D+12 and D+14 days), may sometime appear during a long term test. This to- tal collection efficiency is for particles smaller than 10 . For each sampling, the particle size distribution ㎛ of upstream inflow is different and therefore the total collection efficiency would be changeable even the grade efficiency for each size is similar. The change- able particle size distribution is associated with the weather condition. Initial dust collection efficiency of a fresh filter was 30%, and then it has gone up to 95% just before replacing the filter. Anyhow, the low dust collection efficiency in the initial stage must be improved.
Figure 10 shows the fractional efficiency with par- ticle size during one replacing circle time which is measured at the same position upstream and down- stream of filter wall. Figure 10 (a) is the data of filtra- tion efficiency versus particle diameter for the subway filter before replacing in the MVAC system, immedi- ately after replacing filter and after one and two days
of use. The filtration efficiency for the smaller par- ticles reach the stable level soon and the value is much lower, about 20%~30%; as for used filter before replacing, the filtration efficiency increases as particle size increasingand then arrives at approximately 100%
for the particles larger than 3 ㎛ . Results show that the fresh filter has much lower collection efficiency than used filter for particles larger than 1 ㎛ over the initial period. However, the collection efficiency for particles smaller than 1 ㎛ is stable and just a little lower than the results of filters before replacing. This may be because that clean fibrous filter with enough space will cause the small particles agglomerate and form larger size particles during the motion process.
And, as particles collected on the filter, the formed dust cake would improve the large particles collection.
So, this will result in higher concentration of large particles in the downstream of the filtration system.
This is a very important problem for the initial per- formance of current filtration system.
Figure 10 (b) and Figure 10 (c) present efficiency measurements versus particle size after 4 to 14 days of using. It could be found that the collection effi- ciency for particles larger than 1 ㎛ increases to a sta
0 0.2 0.4 0.6 0.8 1
D-1 D-0 D+1 D+2 D+3 D+4 D+5 D+6 D+7 D+8 D+10 D+12 D+14 D+18 D+19 D-0 D+2 D+13 D-0 Sampling date
Collection Efficiency for PM10
ble level and almost reach 100%. This is similar with the results of filters before replacing. The efficiency improvements are probably due to better particle cap- ture by impaction and interception mechanisms as the filters become loaded with particles. The results from Figure 10 (d) show that the minimum efficiency for particles larger than 1 ㎛ occurred one day after the filter replacing.
The efficiency data in figures exhibits more varia- ble than results found in controlled laboratory experi- ments. This variability is not surprising because many factors cannot be controlled during field tests. For ex- ample, the ambient particle size distribution changed from day to day. In particular, the breadth of the dis- tribution and the concentration of upstream particles varied during filtration process. Thus, these fluctua- tions increase the variability of measurement effi-
ciency in the filtration room. Few particles larger than 3 ㎛ in diameter are present upstream from the test filters. Therefore, efficiency measurements by the OPS (optical aerosol spectrometer) for large particles are highly variable because even a change of a single particle in the upstream or downstream count could influence the efficiency measurements. This variability is especially important for particles larger than 2 or 3 in diameter because they are susceptible to the
㎛
OPS phantom particle problem. Furthermore, the fan speeds in the air-handling units are not constant dur- ing filtration operation. The units responded to ven- tilation requirements within the building are de- termined by the computer control. Thus, velocity through the filters sometimes varies by some percent during the sampling process.
0 0.2 0.4 0.6 0.8 1
0.1 1.0 10.0 100.0
Particle size (µm)
Efficiency
D-1 D-0 D+1 D+2
0 0.2 0.4 0.6 0.8 1
0.1 1.0 10.0 100.0
Particle size (µm)
Efficiency
D+3 D+4 D+5
0 0.2 0.4 0.6 0.8 1
0.1 1.0 10.0 100.0
Particle size (µm)
Efficiency D+6
D+7 D+8 D+10 D+12 D+14
0 0.2 0.4 0.6 0.8 1
0.1 1.0 10.0 100.0
Particle size (µm)
Efficiency
D+18 D+19 D-0 D+2 D+13 D-0
3.4 Application of TFBE filter to the subway MVAC system
Dust loading on the electrically charged filters with dust is not affected only by mechanical mechanisms, but also by electrostatic means. The dust will form structured deposits or dendrites by pure mechanical means (particle deposition, inertial capture, inter- ception, diffusion). The general effect of particle den- drites formed on the electret filters will be to increase both the filtration efficiency and the airflow resis- tance. The second effect is that a reduction in filtra-
tion efficiency which possibly caused by (a) neutrali- zation of the charge on the fiber by opposite charges on the captured aerosols particles, (b) screening of the fiber charge by a layer of captured particles, and (c) disruption of the charge-carrying part of the fibers by the aerosol, either by dissolution of the surface layer or by chemical reaction (Ji et al., 2003). This would not result directly in the increase of flow resistance.
As particles are loaded on the filter fibers, the collec- tion efficiencies of these filters gradually degrade (Baumgartner & Loffler, 1986; Brown et al., 1988;
0.0 0.2 0.4 0.6 0.8 1.0
0.1 1.0 10.0 100.0
Particle size(µm)
Efficiency n
TFBE filter-A TFBE filter-B TFBE filter-C TFBE filter-D Fibrous filter HVAC 0.0
0.2 0.4 0.6 0.8 1.0
0.1 1.0 10.0 100.0
Particle size(µm)
Efficiency
TFBE filter-A TFBE filter-B TFBE filter-C TFBE filter-D HVAC
0.0 0.2 0.4 0.6 0.8 1.0
0.1 1.0 10.0 100.0
Particle size(µm)
Efficiencyn
TFBE filter-A TFBE filter-B TFBE filter-C TFBE filter-D Fibrous filter HVAC
0.0 0.2 0.4 0.6 0.8 1.0
0.1 1.0 10.0 100.0
Particle size(µm)
Efficiency n
TFBE filter-A TFBE filter-B TFBE filter-C TFBE filter-D Fibrous filter HVAC
0.0 0.2 0.4 0.6 0.8 1.0
0.1 1.0 10.0 100.0
Particle size(µm)
Efficiencyn
TFBE filter-A TFBE filter-B TFBE filter-C TFBE filter-D Fibrous filter HVAC
Tanthapanichakoon et al., 2003; Weeraya et al., 2006).
Most on-coming particles collected on the already captured particles form multiple agglomerates on elec- tret fibers. As a consequence, the mechanical effect on the overall efficiency gradually rises up and ulti- mately becomes the dominant collection mechanism.
Figure 11 is the comparison of the grade efficiency obtained from the field test for the two kinds of filters at the subway filtration system. It could be found that the TFBE filter (A-10cm B,C-14cm D-22cm in thick- ness) show higher initial collection efficiency for par- ticles with diameter smaller than 1 . The initial col ㎛ - lection efficiency of MVAC filter room is similar with fibrous filter cell. The collection efficiency of MVAC filters for particles smaller than 2 ㎛ is much lower than that of the TFBE filter cell in the first day.
The grade efficiency of TFBE filter has direct ratio to the filter thickness, and the cell with 10cm filter shows lower efficiency for both fine particles and large particles. This means the special structure of TFBE filter perform well with enough thickness fiber.
As filtration processing, the collection efficiency of TFBE filter decrease obviously especially for the fine particles and large particles, this is partly due to the decay of electrostatic force during the filtration proc- ess, and also partly attribute to the special three-di- mension structure of the filter would lead to re-bounce of the collected particles to the airflow. But the col- lection efficiency of MVAC filters for large particles increase steeply due to the formation of dust cake on the surface of filter. The collection efficiency of MVAC filters for fine particles has no obviously in- crease with the filtration, which is consistent with pre- vious sampling results. TFBE filter with higher initial
efficiency for particles fine than 1 ㎛ could compen - sate the low efficiency of current subway filters.
Through the filtration process, the pressure drop of TFBEfilter almost keeps at a stable value with a little increase. Therefore, the high efficiency for fine par- ticles and relatively well performance at high filtration velocity make TFBE filter be a good choice for the air cleaning in the Metro-subway system.
3.5 lab-scale pressure drop measurement of test filters
Figure 12 shows the pressure drop across the test filters with dust loading at the face velocity of 1m/s.
The feeding Arozona dust concentration was controlled at 6×10 5 ~1×10 6 /liter in the lab-scale experi- ment. The pressure drop across the filter media has been known to be associated with its fiber diameter, packing density and filter thickness. The initial value of pressure drop tends to be low in fibrous filter which is currently used in MVAC of subway.
However, dust loading at the filter medium would cause steeper increase than that of TFBE filter (with thickness of 100mm). Consistent particle collection did not cause high increasing rate of pressure drop
0 2 4 6 8
0 20 40 60 80 100
Filtration time(min) Pressure drop (mmH2O)
Fibrous filter-1st Fibrous filter-2nd Fibrous filter-3rd TFBE filter-1st TFBE filter-2nd TFBE filter-3rd