INTRODUCTION
Bronchial asthma is a chronic airway inflammatory disor- der, characterized by airway infiltration of inflammatory cells such as eosinophils and T-lymphocytes, and progressive air- flow obstruction (1). These cells are involved in a network of various cytokines (2) and contribute to bronchial hyperre- sponsiveness and structural changes (3). As a consequence, enhanced attention has been paid to the structural changes referred as airway remodeling (4-7) characterized by goblet cell hyperplasia/hypertrophy (8), subepithelial collagen depo- sition, and smooth muscle hyperplasia/hypertrophy. All these changes were responsible for airway wall thickening, which appears to be the basis of increased airway hyperresponsive- ness (AHR) in chronic asthma (9). Recently, several animal studies were performed to clarify the relation between airway inflammation and remodeling, and furthermore their contri- bution to AHR in chronic asthma, despite the fact that the precise mechanisms and associations are unknown (10-15).
In the present study, we studied the kinetics of inflamma- tory cell infiltration, specific IgE, IgG1, IgG2a response, cy- tokine production in the airways, goblet cell hyperplasia, airway fibrosis, and their association with AHR during chron-
ic (long time course) ovalbumin (OVA) challenge in sensi- tized mice.
MATERIALS AND METHODS Animal model
Specific pathogen-free female BALB/c mice were used as a chronic asthma model when they reached 7 weeks of age.
The mice were housed in environmentally controlled specif- ic-pathogen free conditions for 1 week prior to the study and during the experiments. All animal experimental protocols were approved by the Catholic University of Korea, Animal Subjects Committee. Mice were actively sensitized by intra- peritoneal injections of 100 g OVA (grade V; Sigma, St.
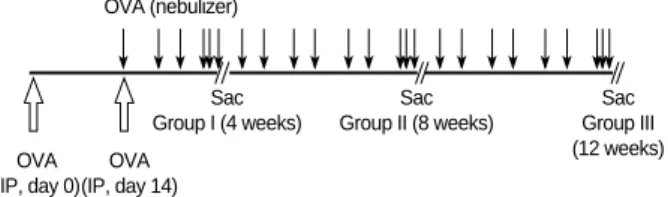
Louis, MO) together with 500 g aluminum hydroxide (Ald- rich, Milwaukee, WI) in phosphate buffered saline (PBS) on day 0 and day 14. From day 21, they were exposed to aero- solized OVA (1% wt/vol diluted in sterile PBS) for 30 min twice weekly. Different groups of mice were studied accord- ing to the duration of antigen exposure: Group I (n=12), 4 weeks; Group II (n=12), 8 weeks; Group III (n=11), 12 weeks
Seung Joon Kim, Chi Hong Kim, Joong Hyun Ahn, Myung Sook Kim, Seok Chan Kim, Sook Young Lee, Soon Seog Kwon, Young Kyoon Kim, Kwan Hyoung Kim, Hwa Sik Moon, Jeong Sup Song, Sung Hak Park
Division of Pulmonology, Department of Internal Medicine, College of Medicine, The Catholic University of Korea, Seoul, Korea
Address for correspondence Sung Hak Park, M.D.
Department of Internal Medicine, Kangnam St. Mary’s Hospital, The Catholic University of Korea, 505 Banpo-dong, Seocho-gu, Seoul 137-040, Korea Tel : +82.2-590-1653, Fax : +82.2-599-3589 E-mail : [email protected]
183
Time Sequence of Airway Remodeling in a Mouse Model of Chronic Asthma: the Relation with Airway Hyperresponsiveness
During the course of establishing an animal model of chronic asthma, we tried to elucidate the time sequence of airway hyperresponsiveness (AHR), airway inflam- mation, airway remodeling, and associated cytokines. Seven-week-old female BALB/
c mice were studied as a chronic asthma model using ovalbumin (OVA). After sen- sitization, mice were exposed twice weekly to aerosolized OVA, and were divided into three groups depending on the duration of 4 weeks, 8 weeks, and 12 weeks.
At each time point, airway responsiveness, inflammatory cells, cytokines in bron- choalveolar lavage fluids (BALF), serum OVA-specific IgE, IgG1, IgG2a, and his- tological examination were carried out. AHR to methacholine, increased levels of OVA-specific IgG1 and IgG2a, and goblet cell hyperplasia were continuously sus- tained at each time point of weeks. In contrast, we observed a time-dependent dec- rease in serum OVA-specific IgE, BALF eosinophils, BALF cytokines such as IL- 13, transforming growth factor-beta1, and a time-dependent increase in BALF pro- matrix metalloproteinase-9 and peribronchial fibrosis. In this OVA-induced chronic asthma model, we observed airway remodelings as well as various cytokines and inflammatory cells being involved in different time-dependent manners. However, increased airway fibrosis did not directly correlate with a further increase in airway hyperresponsiveness.
Key Words : Asthma; Disease Models, Animal; Mice; Bronchial Hyperreactivity; Chronic Disease
Received : 26 April 2006 Accepted : 4 August 2006
(Fig. 1). Control mice (n=8) were sensitized and then exposed to PBS in the same manner. Mice of each experimental group were then killed 24 hr after exposure to OVA or PBS aerosols for 3 consecutive days. The aerosol was generated from a neb- ulizer and was drawn into a dome shaped exposure chamber where restrained animals were distributed evenly and circum- ferentially.
Measurement of airway function
Before the mice were killed, airway responsiveness to me- thacholine was measured. To assess the airway responsiveness, we used a non-invasive whole body mouse plethysmograph (Allmedicus, An Yang, Korea) to measure a derived index named enhanced pause (Penh). Penh is a reasonable analogue of airway responsiveness to a non-specific inhaled stimulus, such as methacholine, which provides an accepted measure for comparison between the experimental groups.
Bronchoalveolar lavage fluid (BALF) preparation
After determination of airway responsiveness, the animals were killed for collection of BALF and histological exami- nation. The right lung of each mouse was lavaged with 0.4 mL calcium- and magnesium-free PBS after the trachea was cannulated and the left bronchus was tied. This procedure was repeated three times (total volume; approximately 1.0 mL, recovery >80%). BALF from each animal was collected in a plastic tube and cooled on ice, and centrifuged (2,000 rpm) at 4℃for 7 min. The supernatants of BALF in each experimental group were stored at -70℃for determination of IL-13, IFN-gamma, pro-matrix metalloproteinase-9 (pro- MMP-9), tissue inhibitor of matrix metalloproteinase-1 (TI- MP-1), and transforming growth factor-beta1 (TGF-beta1).
Cell pellets were resuspended in PBS, stained with trypan blue, and the number of nucleated cells was counted in a hematocytometer. A differential count was made on a smear prepared with a cytocentrifuge and stained with Diff-Quik solution of at least 400 cells.
Measurement of OVA-specific IgE, IgG1, and IgG2a
Bloods from each experimental group were collected, and sera were obtained by centrifugation and stored at -70℃.
OVA-specific IgE, IgG1, and IgG2a were determined by enzyme-linked immunosorbent assay (ELISA) as follows. One hundred microliters of OVA (100 g/mL in PBS) was dis- pensed into each well of a 96-well flat microtiter plate and incubated overnight at 4℃. The antigen-coated plates were washed three times with 0.05% PBS-Tween 20 buffer (wash- ing buffer) and incubated with mice sera overnight at 4℃. Plates were washed five times with washing buffer and incu- bated with antimouse IgE (Pharmingen, San Diego, CA, U.S.A.), IgG1 (Sigma, St. Louis, MO, U.S.A.), and IgG2a (Sigma, St. Louis, MO, U.S.A.) antibody overnight at 4℃. They were then washed further five times before adding cit- ric acid-phosphate buffer containing 0.15 mg/mL of O-pheny- lenediamine (Sigma, St. Louis, MO, U.S.A.). Color was devel- oped at room temperature, and the reaction was stopped with 2.5 M sulfuric acid, which was measured at 492 nm. The each antibody level was expressed as arbitrary unit (A.U.), which was a relative value based on the standard mouse serum that was sensitized and exposed to OVA in the same manner.
Measurement of cytokines in BALF
The amount of cytokine in the supernatant of BALF was measured using enzyme immunoassay (R&D Systems, Min- neapolis, MN, U.S.A. for IL-13, IFN-gamma, pro-MMP-9, and TIMP-1, BioSource International, Camarillo, CA, U.S.A.
for TGF-beta1). Each sample was measured according to the manufacturer’s recommendations. The detection limit of each kit is 1.5 pg/mL for IL-13, 2 pg/mL for IFN-gamma, 8 pg/mL for pro-MMP-9, 2.1 pg/mL for TIMP-1, and 15.6 pg/mL for TGF-beta1.
Immunocytochemical staining for MMP-9 and TIMP-1
For immunocytochemistry of MMP-9 and TIMP-1, the cytocentrifuge preparations of BALF cells were fixed with 4% paraformaldehyde for 5 min and incubated sequentially in accordance with instructions for mouse MMP-9, TIMP-1 immunostaining kit (R&D Systems, Minneapolis, MN, U.S.A.).
Briefly, detection was based on the formation of the avidin- biotin complex with primary antibodies that reacted with antigens. Visualization was based on enzymatic conversion of a chromogenic substrate 5-bromo-4-chloro-3′-indolyphos- phate p-toluidine salt (BCIP) and nitro blue tetrazolium chlo- ride (NBT) into a colored black-purple precipitate by alka- line phosphatase (AP) at the sites of antigen localization.
After immunostaining, the slides were counterstained with Nuclear Fast Red (Vector Laboratories, Burlingame, CA, U.S.A.). For the control, BALF cells from mice were treated without the primary antibody, under the same condition.
Histological study
For each mouse, the left lung was removed and fixed in 4%
Fig. 1.Schematic representation of systemic sensitization and provocation protocol in each group of mouse asthma model.
IP, intraperitoneal injection.
OVA (nebulizer)
Sac Group I (4 weeks) OVA
(IP, day 0) OVA (IP, day 14)
Sac Group II (8 weeks)
Sac Group III (12 weeks)
paraformaldehyde and then embedded in paraffin. At that time, the left lung of each mouse was equally sectioned into three pieces from the apex of the lung. Hematoxylin and eosin stains were performed for general morphology, periodic acid- Schiff (PAS) stain for identification of goblet cells in the epi- thelium, Masson’s trichrome stain for airway fibrosis, respec- tively. For the study, the bronchioles in which the total length of the epithelial basement membrane is 1.0-1.5 mm, were selected.
To quantify the goblet cell hyperplasia, we used the method described by Padrid et al. (16) with some modifications. Brie- fly, the pathological changes were evaluated according to the modified 5-point scoring system (grade 0-4) and were exp- ressed by scores according to the percentage of the goblet cells in the epithelial cells: grade 0 (no goblet cells); grade 1, <25%;
grade 2, 25-50%; grade 3, 51-75%; grade 4, >75%. The mean scores of goblet cell hyperplasia in each mouse were calculated.
The areas of airway fibrosis beneath the epithelial basement membrane in the Masson’s trichrome stained tissue sections were calculated using a Polaroid DMC1e digital microscope color camera (Polaroid Corporation, Cambridge, MA, U.S.A.) connected with computerized image analyzer program, Op- timas (Media Cybernetics, Silver Spring, MD, U.S.A.). The mean areas of subepithelial fibrosis in each mouse were cal- culated.
Statistical analysis
Values are presented as mean±SEM. The significance bet- ween saline-inhaled and OVA-inhaled animals was estimated using the two-tailed Student’s t test. p values of less than 0.05 were considered to be statistically significant.
RESULTS Airway responsiveness
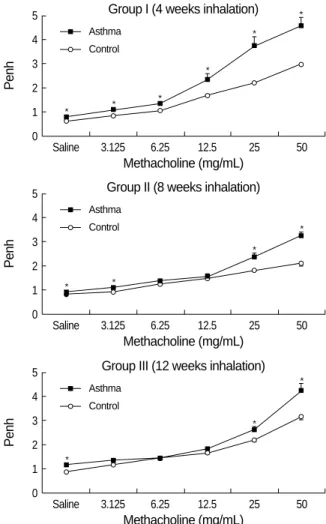
To investigate the relation with airway remodeling, AHR to methacholine was examined at each time point. Fig. 2 shows the dose response curve of airway responsiveness to methacholine. In each OVA-exposed asthma group, airway responsiveness to methacholine was significantly increased compared with control group. But there was no significant difference in AHR between the asthma groups.
Serum OVA-specific Immunoglobulins and BALF cytokines
The serum level of OVA-specific IgE was consistently in- creased in each asthma group exposed to OVA for 4, 8, and 12 weeks as compared with that of control mice. The peak level of OVA-specific IgE was reached at 4 weeks of OVA exposure, and after that, the level was significantly decreased
according to the exposure duration.
All asthma groups produced detectable levels of OVA- specific IgG1 and IgG2a in serum, but there was no differ- ence between the asthma groups. In control group, serum OVA-specific IgG1 and IgG2a were not detected.
In BALF, the amount of a Th2 cytokine, IL-13 was signif- icantly increased in all asthma groups compared with con- trol group. In asthma groups, the peaked IL-13 level at 4 weeks was decreased at 8, 12 weeks according to the dura- tion of antigen exposure. In contrast, the level of a Th1 cyto- kine, IFN-gamma showed no significant difference between control and asthma groups. The amount of pro-MMP-9 and TIMP-1 in BALF was significantly higher in asthma groups than in control mice throughout the experiment. In asthma groups, the pro-MMP-9 level was increased in time depen- dent manner and reached its peak at 12 weeks after exposure.
In contrast, the TIMP-1 level in asthma groups showed no significant difference according to the duration of antigen exposure. The TGF-beta1 level in BALF was significantly higher in asthma groups than in control mice, and the level
Fig. 2.Airway hyperresponsiveness to methacholine in each group of mouse asthma model. Compared with the control group, asth- ma groups showed significantly increased airway hyperrespon- siveness for 12 weeks (*p<0.01 vs. control group).
Penh
5 4 3 2 1 0
Saline 3.125 6.25 12.5 25 50
Methacholine (mg/mL) Group I (4 weeks inhalation)
Asthma Control
*
*
*
* *
*
Penh
5 4 3 2 1 0
Saline 3.125 6.25 12.5 25 50
Methacholine (mg/mL) Group II (8 weeks inhalation)
Asthma Control
* *
*
*
Penh
5 4 3 2 1 0
Saline 3.125 6.25 12.5 25 50
Methacholine (mg/mL) Group III (12 weeks inhalation)
Asthma Control
*
*
*
peaked at 4 weeks after exposure (Table 1).
Cellular response in BALF
A significant increase in the total number of BALF cells from OVA challenged mice was observed in comparison with control mice (Fig. 3). The increase in total cell numbers was associated with a significant increase in eosinophils, lympho- cytes and to a lesser degree, neutrophils throughout the exper- iments. The increased eosinophils in Group I were signifi- cantly decreased according to the duration of repeated OVA challenge in Group II and Group III.
Immunocytochemical staining for MMP-9 and TIMP-1
Compared with control mice, MMP-9 and TIMP-1 expres- sions were remarkable in all asthma groups. According to
the morphological criteria, these expressions were observed in various kinds of cells including macrophages, eosinophils, neutrophils, and lymphocytes (Fig. 4).
Goblet cell hyperplasia
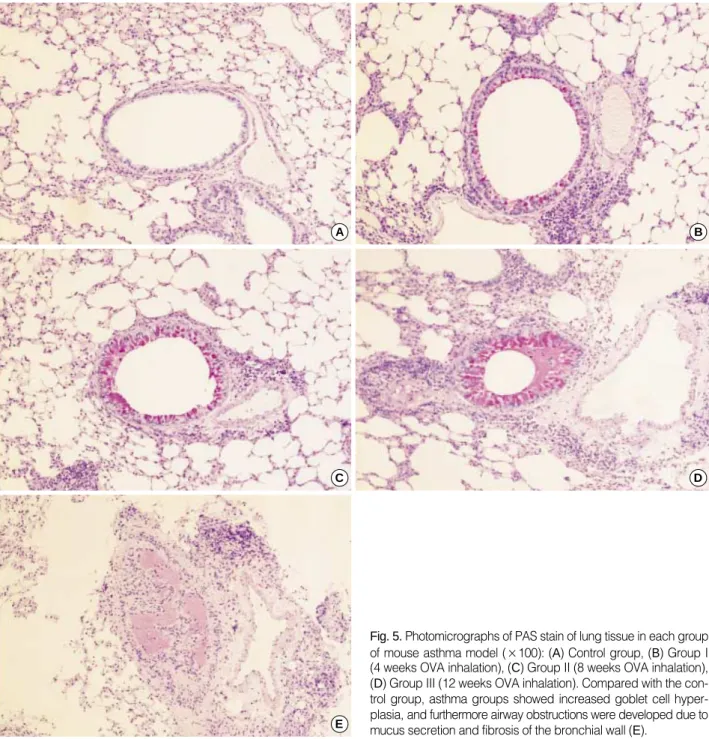
For the morphometric measurements of goblet cell hyper- plasia, the average number of 25 (range: 23 to 27) airways were analyzed in each experimental group. The length of peribronchial basement membrane showed no significant differences in each experimental group; Control, Group I, Group II, and Group III (1.27±0.26 mm, 1.28±0.39 mm, 1.27±0.25 mm, and 1.28±0.24 mm, respectively). All asthma groups showed significant goblet cell hyperplasia compared with the control group detected with PAS staining (Fig. 5). All of the challenged mice but none of the controls demonstrated severe goblet cell hyperplasia, but there were no significant differences between asthma groups (Fig. 6).
Peribronchial fibrosis
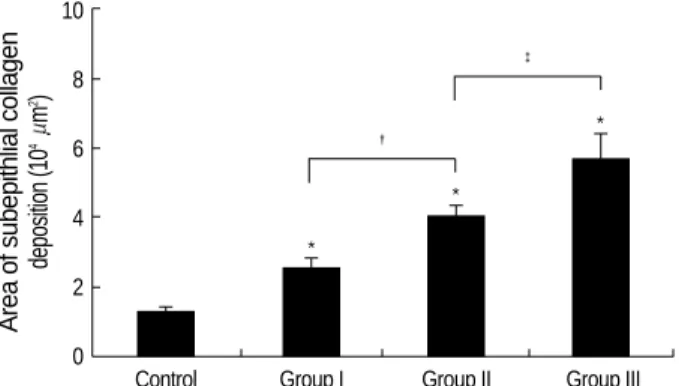
For the morphometric measurements of peribronchial fibro- sis, the average number of 28 (range: 21 to 33) airways were analyzed in each experimental group. The length of peribron- chial basement membrane showed no significant differences in each experimental group; Control, Group I, Group II, and Group III (1.26±0.27 mm, 1.26±0.28 mm, 1.26±0.21 mm, and 1.26±0.17 mm, respectively). All asthma groups showed significantly increased peribronchial fibrosis com- pared with the control group detected with Masson’s trich- rome staining (Fig. 7). In asthma groups, peribronchial fibro- sis was significantly increased according to the duration of OVA exposure (Fig. 8).
DISCUSSION
Until now, methods to establish a animal model of bron- chial asthma have been diverse because many laboratories
Control Group I Group II Group III
Serum, OVA-specific
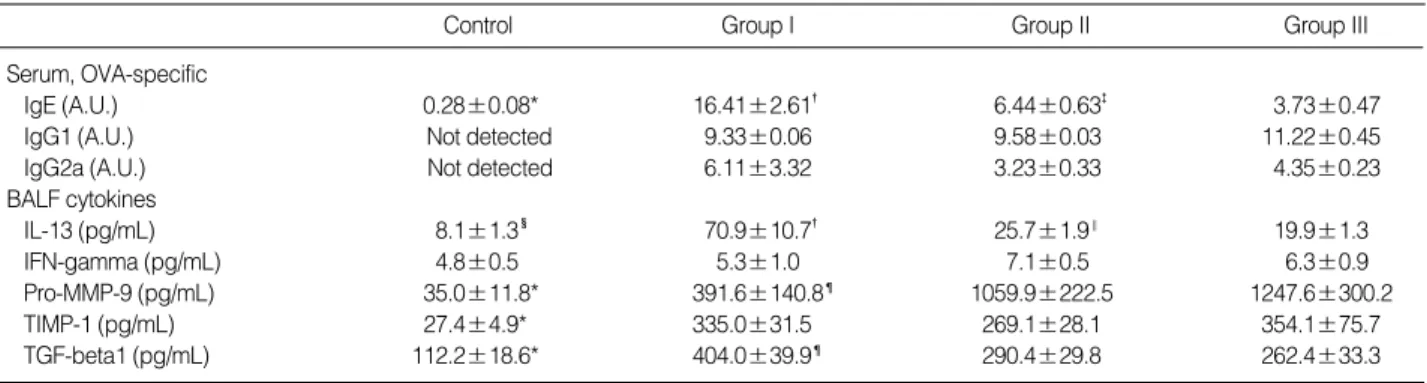
IgE (A.U.) 0.28±0.08* 16.41±2.61� 6.44±0.63� 3.73±0.47
IgG1 (A.U.) Not detected 9.33±0.06 9.58±0.03 11.22±0.45
IgG2a (A.U.) Not detected 6.11±3.32 3.23±0.33 4.35±0.23
BALF cytokines
IL-13 (pg/mL) 8.1±1.3� 70.9±10.7� 25.7±1.9‖ 19.9±1.3
IFN-gamma (pg/mL) 4.8±0.5 5.3±1.0 7.1±0.5 6.3±0.9
Pro-MMP-9 (pg/mL) 35.0±11.8* 391.6±140.8¶ 1059.9±222.5 1247.6±300.2
TIMP-1 (pg/mL) 27.4±4.9* 335.0±31.5 269.1±28.1 354.1±75.7
TGF-beta1 (pg/mL) 112.2±18.6* 404.0±39.9¶ 290.4±29.8 262.4±33.3
Table 1.Changes of serum OVA-specific immunoglobulin productions and BALF cytokine levels in each group of mouse asthma model
*p<0.01 vs. Group I, Group II, and Group III; �p<0.01 vs. Group II and Group III; �p<0.01 vs. Group III; �p<0.05 vs. Group I, Group II, and Group III; ‖p<
0.05 vs. Group III; ¶p<0.05 vs. Group II and Group III.
Total cells Macrophages Eosinophils Lymphocytes Neutrophils
Cells in BALF (104/mL) 200
150
100
50
0 Control Group I Group II Group III
Fig. 3.Changes of inflammatory cells in bronchoalveolar lavage fluid in each group of mouse asthma model. Compared with the control group, asthma groups showed significantly increased in- flammatory cells including eosinophils, lymphocytes and neutro- phils (*p<0.01). In the asthma groups, eosinophils were significant- ly decreased after prolonged OVA inhalations for 8 weeks and 12 weeks (�p<0.01).
* *
�
�
*
*
*
* * * * *
*
performed different animal experiments according to the type and dose of antigen, duration of antigen exposure, route of antigen administration, the use of systemic sensitization, animal strain, and method of measuring AHR (10-15).
Human asthmatic airway shows chronic change, so called airway remodeling. However, most of the experimental ani- mals for human asthma studies use an acute animal model, which lacks the airway remodeling characteristics of human
Fig. 4.Photomicrographs of MMP-9 (I) and TIMP-1 (II) immunoreactivity in the bronchoalveolar lavage cells of each group of mouse asth- ma model (×400): (A) Control group, (B) Group I (4 weeks OVA inhalation), (C) Group II (8 weeks OVA inhalation), (D) Group III (12 weeks OVA inhalation). Positive staining cells expressed blue color in their cytoplasm. Compared with the control group, MMP-9 and TIMP-1 expres- sions were obvious in asthma groups.
A
C
B
D
A
C
B
D I
II
chronic asthma. Recently, some animal researches used a chro- nic asthma model that resembled airway remodeling of human chronic asthma (10, 14). However, after chronic antigen expo- sure, the animal easily developed immune tolerance, and chronic asthma model was difficult to maintain for a long time (13, 17).
In this study, we established a clinically relevant experi- mental animal model that replicated most of the features of chronic human asthma. Furthermore, we could observe the time sequence of airway inflammation and remodeling as well as AHR from 4 to 12 weeks of allergen exposure. Vari- ous cytokines as well as inflammatory cells were related with
airway inflammation and remodeling in a time-dependent manner in this study protocol.
Total inflammatory cell counts in BALF decreased after a prolonged exposure. In Group III, total inflammatory cell counts showed a significant decrease compared with Group I. The reason could be thought that generally, not acute but chronic inflammation tends to decrease the number of infla- mmatory cells. The eosinophils in BALF also decreased after prolonged exposure, but the neutrophils and the lymphocytes increased gradually which showed that chronic exposure of antigen was associated with the increased lymphocytes and neutrophils. Therefore, it might be thought that neutrophils
Fig. 5.Photomicrographs of PAS stain of lung tissue in each group of mouse asthma model (×100): (A) Control group, (B) Group I (4 weeks OVA inhalation), (C) Group II (8 weeks OVA inhalation), (D) Group III (12 weeks OVA inhalation). Compared with the con- trol group, asthma groups showed increased goblet cell hyper- plasia, and furthermore airway obstructions were developed due to mucus secretion and fibrosis of the bronchial wall (E).
A B
C
E
D
and lymphocytes as well as eosinophils are involved in chron- ic allergic airway inflammation. Kamath et al. (18) suggest- ed the important role of neutrophils in the allergic airway
inflammations, and presented data that supported the cur- rent renewed interest in the neutrophil as a primary driver of airway inflammation, particularly in the most severe forms of asthma. Further studies, especially the principal drivers
Fig. 7.Photomicrographs of Masson’s trichrome stain of lung tissue in each group of mouse asthma model (×100): (A) Control group, (B) Group I (4 weeks OVA inhalation), (C) Group II (8 weeks OVA inhalation), (D) Group III (12 weeks OVA inhalation). Peribronchial fibrosis developed after prolonged OVA inhalations.
A
C
B
D Fig. 8.Changes of peribronchial collagen deposition in each group of mouse asthma model. Compared with the control group, asth- ma groups showed significantly increased peribronchial fibrosis (*p<0.01). In the asthma groups, Group II showed more signifi- cant increase of peribronchial fibrosis than Group I (�p<0.01), and Group III showed more significant increase of peribronchial fibro- sis than Group II (�p<0.05).
Area of subepithlial collagen deposition (104m2) 10
8
6
4
2
0
Control Group I Group II Group III
*
*
� *
�
Goblet cell hyperplasia
5
4
3
2
1
0
Control Group I Group II Group III
* *
*
Fig. 6.Changes of goblet cell hyperplasia in each group of mouse asthma model. The hyperplasia of goblet cells in the epithelial lin- ing was expressed by a score according to the percentage of the goblet cells in the epithelial cells: grade 0, no goblet cells; grade 1, <25%; grade 2, 25-50%; grade 3, 51-75%; grade 4, >75% or total bronchial obstruction due to mucus. Compared with the con- trol group, asthma groups showed significantly increased goblet cell hyperplasia (*p<0.01). However, there were no significant differences between asthma groups.
of neutrophil influx into asthmatic airways, the quantifica- tion of neutrophil trafficking, and its therapeutic applications would be needed more on the exact role of neutrophils (18, 19). In the present study, the eosinophils in BALF were dec- reased significantly after a prolonged exposure, but the AHR was maintained, suggesting that eosinophils were not the only effecter cells, but neutrophils, lymphocytes, and other factors might have been involved in the AHR.
OVA-specific IgG1 and IgG2a were significantly increased in the asthma groups compared with the control group, which suggested that the Th1 immune response as well as the Th2 immune response were involved in allergic inflammation.
These results were similar to those of mouse asthma model by Tanaka et al. (20), in which IgG1 showed a significant increase and IgG2a showed an increased tendency compared with control mice.
The Th2 cytokine IL-13 in BALF was increased in all as- thma groups compared with the control group, and after a peak level at the 4 weeks exposure, it decreased gradually at the 8 and 12 weeks exposure, which was reverse with the degree of peribronchial fibrosis.
Goblet cell hyperplasia developed remarkably as early as 4 weeks of OVA exposure, and was maintained in the same potency to 12 weeks of OVA exposure. However, peribron- chial fibrosis occurred only mildly in 4 weeks of OVA expo- sure, although it progressed severely in a time-dependent manner. Goblet cell hyperplasia and peribronchial fibrosis are the main components of airway remodeling, but each expressed different patterns in a time-dependent manner. In the pathogenesis of airway mucus hypersecretion, Morcillo et al. (21) reviewed that a distinct mucus hypersecretory phe- notype may be present in asthma. Overexpression of MUC- 5AC, MUC5B and Muc2 has been associated in asthma secre- tions. Activation of epidermal growth factor receptor appears to be the central part in transducing many different stimuli, including oxidative stress, proteases and T-helper-2 derived cytokines such as IL-4, IL-5, IL-9, and IL-13. Among the T-helper-2 derived cytokines, IL-13 is probably the primary regulator of mucus hyperplasia in vivo (22). In contrast to airway mucus hypersecretion, collagen I, III, and V; fibro- nectin; and tenascin-C are deposited in the pathogenesis of peribronchial fibrosis. Extensive evidence supports the piv- otal role of IL-4 and IL-13 in peribronchial fibrosis; howev- er the precise mechanism remains unclear (23). Therefore, it might be thought that goblet cell hyperplasia and peribron- chial fibrosis could have different expressive patterns accord- ing to the time sequence due to their different pathogenesis.
AHR was continuously noted from 4 weeks to 12 weeks of OVA exposure, but it did not progress after repeated OVA exposure. Furthermore, at 8 or 12 weeks of OVA exposure, it did not show a significant difference in some of methacho- line concentrations compared with the control group. Thus, we could know that further increase of peribronchial fibrosis did not contribute to further increase of AHR, at least in this
model. We could suggest several possible mechanisms under- lying this discordance between AHR and peribronchial fibro- sis. First, AHR was developed by diverse relationships such as inflammatory cells including the eosinophils, the cytokine balance, the components of airway remodeling including bronchial epithelium, submucosal changes, smooth muscle hyperplasia/hypertrophy, angiogenesis. Thus, AHR could not be determined by only one element among them. Second, according to the study of Palmans et al. (24) with Brown Norway rat, airway fibrosis increased in a time-dependent manner, but AHR was abolished at 12 weeks exposure. They suggested that airway fibrosis could have made thinner air- way thickness, which led to decreased AHR.
In this study, Pro-MMP-9 and TIMP-1 in BALF were also increased in the asthma groups compared with the control group, which was consistent in other human and animal asth- ma studies, suggesting that both MMP-9 and TIMP-1 con- tribute to tissue remodeling (25-29). The balance between MMP-9 and TIMP-1 may be critical in extracellular matrix remodeling. An excess of TIMP-1 over MMP-9 has been associated with chronic airflow obstruction, but the mecha- nisms underlying this association remain unknown. In this experiment, as the peribronchial fibrosis progressed, TIMP-1 levels were maintained relatively constant, but pro-MMP-9 showed a further increase due to the prolonged antigen inha- lation. This result could be explained by the previous report of Cho et al. (30) that they showed MMP-9 and TIMP-1 had different expression patterns according to the source of ana- tomical sites in the remodeled airway. MMP-9 but not TIMP- 1, was expressed in airway epithelium, whereas both MMP- 9 and TIMP-1 were expressed in peribronchial inflammato- ry cells. In this experiment, we examined MMP-9 and TIMP- 1 levels in BALF that manifested mostly the airway epithe- lium, the main source of MMP-9 but not of TIMP-1. In addi- tion, we measured pro-MMP-9 levels, which could not dis- play the active form of MMP-9.
In conclusion, we established a mouse model of chronic asthma that maintained the airway and systemic inflamma- tion for 12 weeks, which may contribute to the development of airway remodeling. Chronic inflammatory cells, IgE, Th1 and Th2 cytokines, MMP-9 and TIMP-1 were involved con- tinuously with different-time dependent manners. Airway hyperresponsiveness could not be determined with a single factor such as peribronchial fibrosis.
REFERENCES
1. Brown PJ, Greville HW, Finucane KE. Asthma and irreversible air- flow obstruction. Thorax 1984; 39: 131-6.
2. Broide DH, Lotz M, Cuomo AJ, Coburn DA, Federman EC, Wasser- man SI. Cytokines in symptomatic asthma airways. J Allergy Clin Immunol 1992; 89: 958-67.
3. Jeffery PK, Wardlaw AJ, Nelson FC, Collins JV, Kay AB. Bronchial
biopsies in asthma. An ultrastructural, quantitative study and corre- lation with hyperreactivity. Am Rev Respir Dis 1989; 140: 1745-53.
4. Bousquet J, Chanez P, Lacoste JY, White R, Vic P, Godard P, Michel FB. Asthma: a disease remodeling the airways. Allergy 1992; 47: 3-11.
5. Redington AE, Howarth PH. Airway wall remodelling in asthma.
Thorax 1997; 52: 310-2.
6. Akkoc T, Tolunay S, Barlau I, Basaran M. Airway remodeling and serum total immunoglobulin E (IgE) levels in a murine model of asth- ma. J Asthma 2001; 38: 585-91.
7. Hoshino M, Nakamura Y, Sim JJ. Expression of growth factors and remodelling of the airway wall in bronchial asthma. Thorax 1998;
53: 21-7.
8. Aikawa T, Shimura S, Sasaki H, Ebina M, Takashima T. Marked goblet cell hyperplasia with mucus accumulation in the airways of patients who died of severe acute asthma attack. Chest 1992; 101:
916-21.
9. Cui ZH, Skoogh BE, Pullerits T, Lotvall J. Bronchial hyperrespon- siveness and airway wall remodelling induced by exposure to aller- gen for 9 weeks. Allergy 1999; 54: 1074-82.
10. Kumar RK, Foster PS. Murine model of chronic human asthma. Im- munol Cell Biol 2001; 79: 141-4.
11. Kumar RK, Foster PS. Modeling allergic asthma in mice; pitfalls and opportunities. Am J Respir Cell Mol Biol 2002; 27: 267-72.
12. Blyth DI, Wharton TF, Pedrick MS, Savage TJ, Sanjar S. Airway subepithelial fibrosis in a murine model of atopic asthma; Suppres- sion by dexamethasone or anti-interleukin-5 antibody. Am J Respir Cell Mol Biol 2000; 23: 241-6.
13. Leong KP, Huston DP. Understanding the pathogenesis of allergic asthma using mouse models. Ann Allergy Asthma Immunol 2001; 87:
96-110.
14. Temelkovski J, Hogan SP, Shepherd DB, Foster PS, Kumar PK. An improved murine model of asthma: selective airway inflammation, epithelial lesions and increased methacholine responsiveness follow- ing chronic exposure to aerosolised allergen. Thorax 1998; 53: 849- 56.
15. Trifilieff A, El-Hashim A, Bertrand C. Time course of inflammatory and remodeling events in a murine model of asthma: effect of steroid treatment. Am J Physiol Lung Cell Mol Physiol 2000; 279: 1120-8.
16. Padrid P, Snook S, Finucane T, Shiue P, Cozzi P, Solway J, Leff AR.
Persistent airway hyperresponsiveness and histologic alterations after chronic antigen challenge in cats. Am J Respir Crit Care Med 1995; 151: 184-93.
17. Sakai K, Yokoyama A, Kohno N, Hamada H, Hiwada K. Prolonged antigen exposure ameliorates airway inflammation but not remod- eling in a mouse model of bronchial asthma. Int Arch Allergy Immu- nol 2001; 126: 126-34.
18. Kamath AV, Pavord ID, Ruparelia PR, Chilvers ER. Is the neutrophil the key effector cell in severe asthma? Thorax 2005; 60: 529-30.
19. Louis R, Djukanovic R. Is the neutrophil a worthy target in severe asthma and chronic obstructive pulmonary disease? Clin Exp Aller- gy 2006; 36: 563-7.
20. Tanaka H, Masuda T, Tokuoka S, Komai M, Nagao K, Takahashi Y, Nagai H. The effect of allergen-induced airway inflammation on airway remodeling in a murine model of allergic asthma. Inflamm Res 2001; 50: 616-24.
21. Morcillo EJ, Cortijo J. Mucus and MUC in asthma. Curr Opin Pulm Med 2006; 12: 1-6.
22. Wills-Karp M, Chiaramonte M. Interleukin-13 in asthma. Curr Opin Pulm Med 2003; 9: 21-7.
23. Takayama G, Arima K, Kanaji T, Toda S, Tanaka H, Shoji S, McKen- zie AN, Nagai H, Hotokebuchi T, Izuhara K. Periostin: a novel com- ponent of subepithelial fibrosis of bronchial asthma downstream of IL-4 and IL-13 signals. J Allergy Clin Immunol 2006; 118: 98-104.
24. Palmans E, Kips JC, Pauwels RA. Prolonged allergen exposure induces structural airway changes in sensitized rats. Am J Respir Crit Care Med 2000; 161: 627-35.
25. Lee YM, Kim YK, Park JK, Suh J, Kim KU, Kim DJ, Uh ST, Kim YH, Park CS. Alteration of airway hyperresponsiveness and expres- sion of MMP-9 and TIMP-1 in bronchial tissue by nebulized IFN- in murine model of asthma. J Asthma Allergy Clin Immunol 2003;
23: 788-99.
26. Cataldo DD, Gueders M, Munaut C, Rocks N, Bartsch P, Foidart JM, Noel A, Louis R. Matrix metalloproteinases and tissue inhibitors of matrix metalloproteinases mRNA transcripts in the bronchial sec- retions of asthmatics. Lab Invest 2004; 84: 418-24.
27. Matsumoto H, Niimi A, Takemura M, Ueda T, Minakuchi M, Tabue- na R, Chin K, Mio T, Ito Y, Muro S, Hirai T, Morita S, Fukuhara S, Mishima M. Relationship of airway wall thickening to an imbalance between matrix metalloproteinase-9 and its inhibitor in asthma. Tho- rax 2005; 60: 277-81.
28. Lee JH, Lee JH, Song DY, Baek SH, Kang IJ. Changes of matrix metalloproteinase-9 and tissue inhibitor matrix metalloproteinase-1 in sputum from moderate to severe acute asthma after corticosteroid therapy. Pediatr Allergy Respir Dis (Korea) 2005; 15: 389-98.
29. Tang LF, Du LZ, Chen ZM, Zou CC. Levels of matrix metallopro- teinase-9 and its inhibitor in bronchoalveolar lavage cells of asth- matic children. Fetal Pediatr Pathol 2006; 25: 1-7.
30. Cho JY, Miller M, McElwain K, McElwain S, Shim JY, Raz E, Broi- de DH. Remodeling associated expression of matrix metalloprotei- nase 9 but not tissue inhibitor of metalloproteinase 1 in airway epi- thelium: modulation by immunostimulatory DNA. J Allergy Clin Immunol 2006; 117: 618-25.