The Association of Socioeconomic Status with Three-Year Clinical Outcomes in Patients with Acute Myocardial Infarction Who
Underwent Percutaneous Coronary Intervention
The aim of this study was to evaluate whether the clinical outcomes were associated with socioeconomic status (SES) in patients with acute myocardial infarction (AMI) who underwent percutaneous coronary intervention (PCI). The author analyzed 2,358 patients (64.9 ± 12.3 yr old, 71.5% male) hospitalized with AMI between November 2005 and June 2010. SES was measured by the self-reported education (years of schooling), the residential address (social deprivation index), and the national health insurance status (medical aid beneficiaries). Sequential multivariable modeling assessed the relationship of SES factors with 3-yr major adverse cardiovascular events (MACEs) and mortality after the adjustment for demographic and clinical factors. During the 3-yr follow-up, 630 (26.7%) MACEs and 322 (13.7%) all-cause deaths occurred in 2,358 patients. In multivariate Cox proportional hazards regression modeling, the only lower education of SES variables was associated with MACEs (hazard ratio [HR], 1.41; 95% confidence interval [CI], 1.04-1.91) and mortality (HR, 1.93; 95% CI, 1.16-3.20) in the patients with AMI who underwent PCI. The study results indicate that the lower education is a significant associated factor to increased poor clinical outcomes in patients with AMI who underwent PCI.
Keywords: Social Class; Acute Myocardial Infarction; Mortality Jeong Hun Kim,1,2 Myung Ho Jeong,1,2
In Hyae Park,2 Jin Soo Choi,2 Jung Ae Rhee,2 Doo Hwan Lee,1 Soo Hwan Park,1 In Soo Kim,1 Hae Chang Jeong,1 Jae Yeong Cho,1 Soo Young Jang,1 Ki hong Lee,1 Keun-Ho Park,1 Doo Sun Sim,1 Kye Hun Kim,1 Young Joon Hong,1 Hyung Wook Park,1 Ju Han Kim,1 Youngkeun Ahn,1 Jeong Gwan Cho,1 and Jong Chun Park1
1The Heart Center of Chonnam National University Hospital, Gwangju; 2Department of Public Health, Chonnam National University Medical School, Gwangju, Korea
Received: 28 September 2013 Accepted: 3 February 2014 Address for Correspondence:
Myung Ho Jeong, MD
Principal Investigator of Korea Acute Myocardial Infarction Registry, Director of Heart Research Center Nominated by Korea Ministry of Health and Welfare, Chonnam National University Hospital, 671 Jaebong-ro, Dong-gu, Gwangju 501-757, Korea Tel: +82.62-220-6243, Fax: +82.62-228-7174
E-mail: [email protected]
This study was supported by grants of The Korean Society of Cardiology, The Korea Centers for Disease Control and Prevention (2013-E63005-00), and The Korean Health Technology R&D Project (HI13C1527), Ministry of Health & Welfare, Republic of Korea.
http://dx.doi.org/10.3346/jkms.2014.29.4.536 • J Korean Med Sci 2014; 29: 536-543
INTRODUCTION
Coronary heart disease (CHD) is one of the leading causes of death in both high- and low-income countries (1). The increased prevalence and mortality associated with the large burden of CHD is a reflection of the epidemiological transition that has accompanied economic and social development (2). Numer- ous studies show that the socioeconomic status (SES) is associ- ated with a risk of CHD (3-6). There was the definite relation- ship between the low SES and the predicted risk of ischemic heart disease (IHD) (7). Also, both individual SES and the SES of the neighborhood of residence are independently associated with the incidence of acute myocardial infarction (AMI) (8, 9).
The association between SES and outcomes of AMI is gener- ally well documented in western countries (10-12). Therefore, the measures of SES have been identified as the risk factors af-
ter AMI (13, 14). However, because the SES is a multidimen- sional concept comprising various indicators acting at different levels, the mechanisms by which it affects post-AMI prognosis are incompletely understood (15, 16).
The objective of this study was to investigate whether the SES variables independently contribute to 3-yr clinical outcomes in Korean patients with AMI who underwent percutaneous coro- nary intervention (PCI).
MATERIALS AND METHODS Study design
This was a retrospective cohort observational study of 2,700 AMI patients who admitted to Chonnam National University Hospi- tal between November 2005 and June 2010. Among the patients, 2,358 eligible patients (64.9 ± 12.3 yr old, 71.5% male) who un- Cardiovascular Disorders
derwent PCI were sorted according to the level of education and followed-up during 3-yr. The medical records of all patients were reviewed and the patients’ clinical data were collected. The pa- tients were followed-up in order to find out whether they were still alive. All patients were contacted by telephone. In each suc- cessful contact, either patient or a close relative (wife or husband, son or daughter, parents, and sister or brother) were interview- ed. If the patient be found, it was regarded as censoring.
AMI was defined as the elevated cardiac biomarkers (tropo- nins or creatine kinase MB fraction) with ischemic symptoms or electrocardiographic findings indicative of ischemia and was further classified by the ST-segment change. ST-elevation myo- cardial infarction was defined as new ST elevation in at least two contiguous leads, measuring > 0.2 mV in leads V1-V3, or
> 0.1 mV in all other leads or presumably new-onset left bundle branch block (17). All other electrocardiographic patterns, in- cluding ST-segment depression or T-wave inversion, were diag- nosed as non-ST-elevation myocardial infarction.
Diagnostic angiography and PCI were performed after the premedication with aspirin (at least 100 mg) and the unfrac- tionated heparin (from 50 to 70 U/kg). Loading of clopidogrel (from 300 to 600 mg) was done before PCI. Coronary angiogra- phy was performed through the femoral or radial artery. Hepa- rin was infused throughout the procedure to maintain an acti- vated clotting time of at least 250 sec. Stents were deployed after prior balloon angioplasty and administration of platelet glyco- protein IIb/IIIa-receptor blocker was left to the decision of each cardiologist.
Socioeconomic measures
SES was measured by the self-reported educational level, the residential address, and the national health insurance status.
Individual SES data were self-reported at the index hospitaliza- tion and included the following variables: education (years of schooling) and national health insurance status (medical aid beneficiaries). The study group was divided into 3 groups ac- cording to the years of schooling (lower group, ≤ 6 yr; middle group, 7-12 yr; upper group, ≥ 13 yr).
Neighborhood SES was estimated through a social depriva- tion index (SDI) by the report of Health Promotion Strategies and Programmes Development for Health Inequalities Allevia- tion (18). The index, which is based on the 2005 National Cen- sus data (19), is a summary of numerous socioeconomic mea- sures (ratio of living environment instability, elderly population, low educated population, low social class per household, apart- ment resident, households without cars, household alone, and female-headed household). The neighborhood SES was classi- fied into three levels of SDI: lower (less than the lowest tertile of SDI), middle (the lowest tertile to the middle tertile), and upper (greater than the highest tertile).
Demographic and clinical variables
Demographic and clinical characteristics recorded were gender, age, and medical history. The latter included any history of cur- rent smoking, drinking, hypertension, diabetes mellitus, dyslip- idemia, previous IHD, family history of heart disease, time of symptom onset, and Killip classification.
Current smoking was defined as self-report of active smoking within the last year before the admission. Drinking was defined as the consumption of an alcoholic beverage (1 unit) at least one times per week. The hypertension was defined as systolic blood pressure > 140 mmHg and/or diastolic blood pressure
> 90 mmHg at rest, at repeated measurements, or treatment with anti-hypertensive medications. The diabetes mellitus was defined as a fasting plasma glucose levels ≥ 126 mg/dL or 2-hr postprandial plasma glucose readings ≥ 200 mg/dL. The dys- lipidemia was defined as low-density lipoprotein cholesterol concentration of > 140 mg/dL and/or triglyceride concentra- tion of > 150 mg/dL and/or high-density lipoprotein cholester- ol concentration of < 40 mg/dL in male and < 50 mg/dL in fe- male and/or the use of treatment with medication for dyslipid- emia. The coronary angiographic lesion characteristics were classified according to the criteria of the American College of Cardiology/American Heart Association (ACC/AHA) (20). The degree of coronary flow was classified using Thrombolysis In Myocardial Infarction (TIMI) score (21).
Outcome measures
The primary study endpoints were the composite of major ad- verse cardiovascular events (MACEs) and mortality during the three years of clinical follow-up. The former included a com- posite of all-cause death, recurrent AMI, and repeated PCI or coronary artery bypass graft. Recurrent AMI was defined as the recurrence of symptoms or new electrocardiographic changes compatible with AMI in association with a rise in cardiac en- zymes at least twice the upper limit of normal. Repeated PCI included target lesion revascularization and target vessel revas- cularization.
Statistical analysis
The analyses were performed with SPSS for Window, version 17.0 (SPSS Inc., Chicago, IL, USA). The baseline clinical charac- teristics across educational levels were compared by the chi- square test for categorical variables (expressed as percentages) and ANOVA for continuous variables (expressed as mean ± stan- dard deviation). The statistical significance was generally defin- ed as a 2-tailed P value of less than 0.05.
The survival across SES variables was assessed by the Kaplan- Meier method with right censoring at the time of last follow-up and compared by the log-rank test. The Cox proportional haz- ards models were constructed to evaluate the hazard ratio and 95% confidence interval for MACEs and mortality associated
with SES variables. The proportional hazard assumptions were examined by inspecting log minus-log survival plots, with no violations detected. The initial adjustment was made for age, sex, hypertension, diabetes mellitus, dyslipidemia, current smo- king, drinking, previous IHD, and family history of heart disease.
Subsequently, the additional adjustment was performed for Killip class, multivessel disease, ACC/AHA lesion types, drug- eluting stent, and post-procedural TIMI flow grade.
Ethics statement
The institutional review board of Chonnam National University Hospital approved the study protocol (I-2008-1-009). Written in formed consent was obtained from all participating patients.
RESULTS
Baseline clinical characteristics of the subjects
Of the 2,358 patients, 1,686 (71.5%) were male and 672 (28.5%) were female. The mean age of the sample was 64.9 ± 12.3 yr old (62.0 ± 12.0 yr old in male, 72.2 ± 9.7 yr old in female). The mean follow-up period was 823 ± 389 days with the loss of follow-up (321 patients) for MACEs and 920 ± 332 days with the loss of follow-up (356 patients) for mortality. The loss of follow-up was a censored observation for the analysis.
The patients of female were residing in upper-SDI area and higher prevalence of medical aid beneficiaries, hypertension,
diabetes mellitus, and higher Killip class. The male patients had higher prevalence of drinking, current smoking, family history of heart disease than female patients (Table 1).
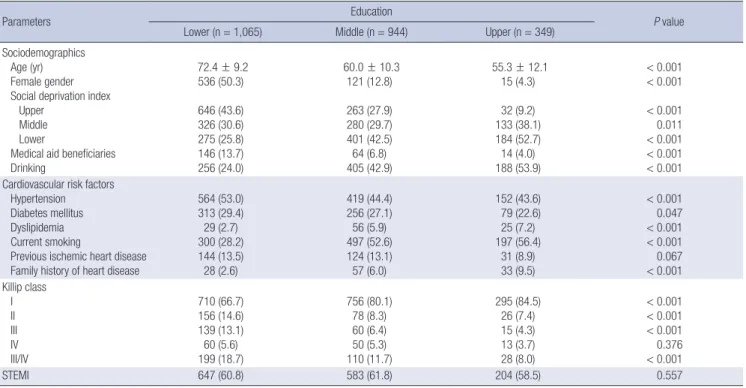
The patients of lower group were generally older and predo- minantly female. They also had higher prevalence of hyperten- sion and diabetes mellitus and had severe disease, as indicated by higher Killip class and more frequent previous history of IHD compared with upper group patients. The patients of lower group were residing in upper-SDI area and higher frequency of medi- cal aid beneficiaries (Table 2).
No significant differences in the coronary angiographic and procedural characteristics were found between the groups, ex- cept that the lower group had a higher incidence of multivessel disease and more frequent implantation of bare-metal stent (Table 3).
Unadjusted effect of educational levels on three-year MACEs and mortality
The mortality rate and incidence of MACEs were significant dif- ferences among the three groups during 3-yr follow-up. During the 3-yr follow-up period, MACEs occurred in 344 patients (32.3%) in the lower group, 223 patients (23.6%) in the middle group, and 63 patients (18.1%) in the upper group (P < 0.001). An all-cause death occurred in 216 patients (20.3%) in the lower group, 87 patients (9.2%) in the middle group, and 19 patients (5.4%) in the upper group (P < 0.001) (Table 4).
Table 1. Baseline clinical characteristics of the subjects, stratified by gender
Characteristics Total
(n = 2,358)
Gender
P value Male (n = 1,686) Female (n = 672)
Sociodemographics Age (yr)
Social deprivation index Upper
Middle Lower
Medical aid beneficiaries Education
Upper ( ≥ 13 yr) Middle (7-12 yr) Lower ( ≤ 6 yr) Drinking
64.9 ± 9.2 759 (32.2) 739 (31.3) 860 (36.5) 224 (9.5) 349 (14.8) 944 (40.0) 1,065 (45.2) 849 (36.0)
62.0 ± 12.0 509 (30.2) 524 (31.1) 653 (38.7) 122 (7.2) 334 (19.8) 823 (48.8) 529 (31.4) 774 (45.9)
72.2 ± 9.7 250 (37.2) 215 (32.0) 207 (30.8) 102 (15.2) 15 (2.2) 121 (18.0) 536 (79.8) 75 (11.2)
< 0.001 0.001 0.666
< 0.001
< 0.001
< 0.001
< 0.001
< 0.001
< 0.001 Cardiovascular risk factors
Hypertension Diabetes mellitus Dyslipidemia Current smoking
Previous ischemic heart disease Family history of heart disease
1,135 (48.1) 648 (27.5) 110 (4.7) 994 (42.2) 299 (12.7) 118 (5.0)
725 (43.0) 424 (25.1) 90 (5.3) 930 (55.2) 207 (12.3) 95 (5.6)
410 (61.0) 224 (33.3) 20 (3.0) 64 (9.5) 92 (13.7) 23 (3.4)
< 0.001
< 0.001 0.014
< 0.001 0.352 0.026 Killip class
I II III IV III/IV
1,761 (74.7) 260 (11.0) 214 (9.1) 123 (5.2) 337 (14.3)
1,333 (79.1) 159 (9.4) 119 (7.1) 75 (4.4) 194 (11.5)
428 (63.7) 101 (15.0) 95 (14.1) 48 (7.1) 143 (21.3)
< 0.001
< 0.001
< 0.001 0.008
< 0.001
STEMI 1,434 (60.8) 1,044 (61.9) 390 (58.0) 0.081
Data are presented as mean ± standard deviation for continuous variables, number (%) for categorical variables. STEMI, ST-segment elevation myocardial infarction.
Table 2. Baseline clinical characteristics of the subjects, stratified by education
Parameters Education
P value
Lower (n = 1,065) Middle (n = 944) Upper (n = 349)
Sociodemographics Age (yr) Female gender Social deprivation index
Upper Middle Lower
Medical aid beneficiaries Drinking
72.4 ± 9.2 536 (50.3) 646 (43.6) 326 (30.6) 275 (25.8) 146 (13.7) 256 (24.0)
60.0 ± 10.3 121 (12.8) 263 (27.9) 280 (29.7) 401 (42.5) 64 (6.8) 405 (42.9)
55.3 ± 12.1 15 (4.3) 32 (9.2) 133 (38.1) 184 (52.7) 14 (4.0) 188 (53.9)
< 0.001
< 0.001
< 0.001 0.011
< 0.001
< 0.001
< 0.001 Cardiovascular risk factors
Hypertension Diabetes mellitus Dyslipidemia Current smoking
Previous ischemic heart disease Family history of heart disease
564 (53.0) 313 (29.4) 29 (2.7) 300 (28.2) 144 (13.5) 28 (2.6)
419 (44.4) 256 (27.1) 56 (5.9) 497 (52.6) 124 (13.1) 57 (6.0)
152 (43.6) 79 (22.6) 25 (7.2) 197 (56.4)
31 (8.9) 33 (9.5)
< 0.001 0.047
< 0.001
< 0.001 0.067
< 0.001 Killip class
I II III IV III/IV
710 (66.7) 156 (14.6) 139 (13.1) 60 (5.6) 199 (18.7)
756 (80.1) 78 (8.3) 60 (6.4) 50 (5.3) 110 (11.7)
295 (84.5) 26 (7.4) 15 (4.3) 13 (3.7) 28 (8.0)
< 0.001
< 0.001
< 0.001 0.376
< 0.001
STEMI 647 (60.8) 583 (61.8) 204 (58.5) 0.557
Data are presented as mean ± standard deviation for continuous variables, number (%) for categorical variables. STEMI, ST-segment elevation myocardial infarction.
Table 3. Coronary angiographic and procedural characteristics
Parameters Education
P value Lower (n = 1,065) Middle (n = 944) Upper (n = 349)
Symptom-to-door time (hr) 11.7 ± 21.2 10.3 ± 30.0 10.7 ± 31.0 0.494
Symptom-to-door time (hr) in STEMI 10.1 ± 20.0 9.1 ± 34.9 10.1 ± 36.0 0.810
Door-to-balloon time (hr) 18.4 ± 35.9 16.8 ± 32.8 16.0 ± 31.9 0.438
Door-to-balloon time (hr) in STEMI 9.0 ± 25.2 9.7 ± 22.7 10.4 ± 29.7 0.753
Location of culprit lesion Left main coronary artery Left anterior descending artery Left circumflex artery Right coronary artery
22 (2.1) 487 (45.7) 174 (16.3) 382 (35.9)
27 (2.9) 466 (49.4) 146 (15.5) 305 (32.3)
6 (1.7) 167 (47.9)
61 (17.5) 115 (33.0)
0.357 0.263 0.668 0.220
Multivessel disease 607 (57.0) 451 (47.8) 148 (42.4) < 0.001
ACC/AHA lesion types B1
B2 C B2/C
190 (17.8) 617 (57.9) 258 (24.2) 875 (82.2)
179 (19.0) 590 (62.5) 175 (18.5) 765 (81.0)
82 (23.5) 192 (55.0) 75 (21.5) 267 (76.5)
0.065 0.024 0.008 0.065 Pre-procedural TIMI flow grade
0 1 2 3
483 (45.4) 54 (5.1) 292 (27.4) 236 (22.2)
408 (43.2) 54 (5.7) 233 (24.7) 249 (26.4)
180 (51.6) 12 (3.4) 87 (24.9) 70 (20.1)
0.028 0.253 0.337 0.021 Stent type
Bare-metal stent Drug-eluting stent Only balloon angioplasty
266 (25.0) 736 (69.1) 63 (5.9)
150 (15.9) 745 (78.9) 49 (5.2)
70 (20.1) 266 (76.2) 13 (3.7)
< 0.001
< 0.001 0.279 Post- procedural TIMI flow grade
0 1 2 3
11 (1.0) 6 (0.6) 18 (1.7) 1,030 (96.7)
6 (0.6) 1 (0.1) 18 (1.9) 919 (97.4)
1 (0.3) 1 (0.3) 0 (0.0) 347 (99.4)
0.321 0.209 0.039 0.023
Data are presented as mean ± standard deviation for continuous variables, number (%) for categorical variables. ACC/AHA, American College of Cardiology/American Heart Association; STEMI, ST-segment elevation myocardial infarction; TIMI, Thrombolysis In Myocardial Infarction.
Table 4. Clinical outcomes at three-year according to educational level
Outcomes
Education
P value Lower
(n = 1,065) Middle (n = 944) Upper
(n = 349) In-hospital death 71 (6.7) 26 (2.8) 4 (1.1) < 0.001 Major adverse cardiovascular events
All-cause death
Repeat myocardial infarction Repeat PCI
Coronary artery bypass graft
344 (32.3) 198 (18.6) 32 (3.0) 113 (10.6)
1 (0.1)
223 (23.6) 80 (8.5) 23 (2.4) 117 (12.4)
3 (0.3)
63 (18.1) 16 (4.6)
3 (0.9) 44 (12.6)
0 (0.0)
< 0.001
< 0.001 0.080 0.379 0.337 Mortality
Cardiac death Non-cardiac death
216 (20.3) 155 (14.6) 61 (5.7)
87 (9.2) 61 (6.5) 26 (2.8)
19 (5.4) 13 (3.7) 6 (1.7)
< 0.001
< 0.001
< 0.001 Data are presented as number (%) for categorical variables. PCI, percutaneous coro- nary intervention.
Fig. 1. Unadjusted Kaplan-Meier curve. (A) Three-year major adverse cardiovascular events (MACEs) and (B) three-year mortality are significantly different according to the level of education (Log-rank test, P < 0.001).
MACE-free survival (%)
Duration of follow-up (days)
0 365 730 1,095 100
90
80
70
60
Upper group
Middle group
Lower group
Survival (%)
Duration of follow-up (days)
0 365 730 1,095 100
90
80
70
60
Upper group Middle group
Lower group
A B
Fig. 1 showed unadjusted Kaplan-Meier survival curves for MACEs and mortality by the education level groups. The lower group had higher MACEs and mortality in patients with AMI who underwent PCI.
Independent predictors of three-year MACEs and mortality including clinical and angiographic variables Cox regression analyses were then conducted to determine which variables were predicted 3-yr MACEs and mortality in patients with AMI who underwent PCI. All variables confirmed by bi- variate analyses were entered in the analysis. The independent predictors of MACEs were found to be an old age, previous IHD, diabetes mellitus, Killip class ≥ 3, multivessel disease, post-TIMI flow grade ≤ 1, and lower education. The independent predic- tors of mortality were found to be an old age, Killip class ≥ 3, post- TIMI flow grade ≤ 1, and lower education (Table 5).
Multivariable model of SES on three-year MACEs and mortality
The multivariable-adjusted associations of various SES deter- minants with MACEs and mortality are shown in Table 6. The only education of individual SES indicators out of various SES variables was strongly associated with 3-yr MACEs and mortal- ity in the patients with AMI who underwent PCI (model 1). Fur- thermore, the association of most of these measures persisted even on the simultaneous adjustment for coronary angiogra- phic and procedural characteristics (model 2). However, the SDI of neighborhood SES indicators was not significant for the incidence of MACEs and mortality in the patients with AMI who underwent PCI.
DISCUSSION
The results of this study indicated that the lower education of individual SES indicators was associated with a trend toward worse the 3-yr clinical outcomes in patients with AMI who un- derwent PCI. However, the SDI of neighborhood SES indicators and the economic status were not associated with the outcomes after adjustment of clinical and angiographic variables.
SES was a commonly used concept in health research. This factor has been shown to be associated with other established medical risk factors that contribute to further increase cardio- vascular risk (22). There was no single best indicator of SES suit- able for all study aims and applicable at all time points in all set- tings. Each indicator measures different, often related aspects of socioeconomic stratification and may be more or less rele- vant to different health outcomes and at different stages in the life course. Therefore, the SES of the individual was multidimen- sional, and the dimensions most relevant to health differences
are considered to be education, occupational social class and income (23).
Table 5. Independent predictors of three-year major adverse cardiovascular events and mortality including clinical and angiographic variables
Variables Composite MACEs Mortality
HR (95% CI) P HR (95% CI) P
Age > 65 yr 1.40 (1.15-1.72) 0.001 2.77 (1.97-3.89) < 0.001
Male gender 1.20 (0.98-1.47) 0.065 1.23 (0.94-1.61) 0.118
Current smoking 0.93 (0.77-1.11) 0.443 0.80 (0.61-1.06) 0.125
Drinking 0.91 (0.75-1.09) 0.317 0.94 (0.71-1.24) 0.697
Previous IHD 1.26 (1.02-1.56) 0.031 1.04 (0.77-1.41) 0.773
Hypertension 0.99 (0.84-1.17) 0.965 1.10 (0.87-1.39) 0.423
Diabetes mellitus 1.28 (1.08-1.52) 0.004 1.22 (0.96-1.55) 0.095
Dyslipidemia 1.03 (0.70-1.50) 0.870 1.01 (0.56-1.83) 0.950
Family history of heart disease 0.78 (0.51-1.18) 0.246 0.73 (0.37-1.42) 0.358
Killip class ≥ 3 2.62 (2.19-3.14) < 0.001 3.87 (3.07-4.88) < 0.001
ACC/AHA lesion Type B2, C 0.96 (0.77-1.18) 0.715 0.84 (0.62-1.13) 0.261
Multivessel disease 1.31 (1.11-1.54) 0.001 1.12 (0.89-1.41) 0.304
Drug-eluting stent 0.63 (0.53-0.74) < 0.001 0.56 (0.45-0.71) < 0.001
Post-TIMI flow grade ≤ 1 2.93 (1.77-4.85) < 0.001 2.34 (1.23-4.44) 0.009
Education Upper ( ≥ 13 yr) Middle (7-12 yr) Lower ( ≤ 6 yr)
1 (Reference) 1.20 (0.90-1.59)
1.41 (1.04-1.91) 0.197
0.023
1 (Reference) 1.35 (0.82-2.24)
1.93 (1.16-3.20) 0.233
0.011 Hazard ratio (HR) was calculated by Cox regression analysis. MACEs, major adverse cardiovascular events; CI, confidence interval; IHD, ischemic heart disease; ACC/AHA, Ameri- can College of Cardiology/American Heart Association; TIMI, Thrombolysis In Myocardial Infarction.
Table 6. Multivariable-adjusted association with three-year major adverse cardiovas- cular events and mortality for various socioeconomic measures
Variables Hazard ratio (95% confidence interval)
Unadjusted Model 1 Model 2
Composite MACEs Social deprivation index
Upper Middle Lower P for trend
Medical aid beneficiaries Education
Upper ( ≥ 13 yr) Middle (7-12 yr) Lower ( ≤ 6 yr) P for trend
1.13 (0.95-1.33) 0.95 (0.74-1.21) 1 (Reference)
0.114 1.25 (0.98-1.60) 1 (Reference) 1.33 (1.01-1.76) 2.02 (1.54-2.64)
< 0.001
1.02 (0.86-1.21) 0.92 (0.72-1.18) 1 (Reference)
0.652 1.12 (0.87-1.44)
1 (Reference) 1.21 (0.91-1.60) 1.50 (1.11-2.02)
0.007
0.99 (0.83-1.17) 0.95 (0.74-1.21) 1 (Reference)
0.888 1.07 (0.83-1.38)
1 (Reference) 1.20 (0.90-1.59) 1.41 (1.04-1.91)
0.031 Mortality
Social deprivation index Upper
Middle Lower P for trend
Medical aid beneficiaries Education
Upper ( ≥ 13 yr) Middle (7-12 yr) Lower ( ≤ 6 yr) P for trend
1.22 (0.96-1.55) 1.09 (0.78-1.52) 1 (Reference)
0.081 1.43 (1.03-1.98) 1 (Reference) 1.72 (1.05-2.83) 4.13 (2.58-6.60)
< 0.001
0.96 (0.76-1.23) 1.03 (0.74-1.44) 1 (Reference)
0.822 1.19 (0.86-1.67)
1 (Reference) 1.41 (0.85-2.32) 2.11 (1.28-3.48)
< 0.001
0.89 (0.70-1.14) 1.07 (0.77-1.50) 1 (Reference)
0.435 1.16 (0.83-1.62)
1 (Reference) 1.35 (0.82-2.24) 1.93 (1.16-3.20)
< 0.001 Hazard ratio was calculated by Cox regression analysis. Model 1: adjusted for age, sex, hypertension, diabetes mellitus, dyslipidemia, current smoking, drinking, previ- ous ischemic heart disease, and family history of heart disease. Model 2: model 1 plus Killip class, multivessel disease, coronary lesion types, drug-eluting stent, and post- procedural thrombolysis in myocardial infarction flow grade. MACEs, major ad- verse cardiovascular events.
Gerber et al. (24) reported that the neighborhood SES was strongly associated with long-term survival after AMI. Also, the neighborhood effects can be related to the characteristics of the social environment, which include the social norms and pre- vailing attitudes toward the health and health-related behavior and features of the social connections within neighborhoods such as social cohesion and support (25). Such connections may lead to better sharing of health-related information and expertise gained from experience with the healthcare system.
However, our results demonstrated that the neighborhood SES as measured by SDI was not associated with the outcomes in the patients with AMI who underwent PCI.
The income was the indicator of SES that most directly mea- sures the material resources component. Also, the income level was associated with worse outcome among the patients with acute coronary syndromes (26). The result of our study showed that the income level as measured by medical aid beneficiaries demonstrated a correlation with mortality rate in the patients with AMI who underwent PCI. However, the effect was attenu- ated by adjust for demographic and clinical variables.
The educational level was normally completed in young adult- hood and strongly determined by parental SES, which in turn contributes to a person’s social class, income, and knowledge, all of which were interwoven with other non-material resources that were likely to have an impact on the health. The knowledge and skills attained through education may affect a person’s cog- nitive functioning, make them more receptive to health educa- tion messages, or more able to communicate with and access appropriate health services. Furthermore, the education was most often used, because it was easily obtained and also fre-
quently treated as a proxy for SES overall (27). The education was comparatively easy to measure in self administered ques- tionnaires, garners a high response rate, and was relevant to peo- ple regardless of age or working circumstances, unlike many other SES indicators (28). In addition, the collection of informa- tion on the education may be less contentious in some contexts than other SES indicators. However, there may be heterogene- ity between the education level and the health outcomes across different populations within specific countries. For example, the risk for AMI increased with higher education in the black African group in the INTERHEART African substudy but the opposite was observed in coloured and white Africans (29). Nev- ertheless, our findings suggest that lower education was the SES marker most consistently associated with increased incidence of MACEs and mortality in the patients with AMI who under- went PCI.
The failure to identify the symptoms correctly was associated with the lower education, which was found to be a predictor of prehospital delay in previous study (30). The patients who pres- ent with atypical symptoms are frequently misdiagnosed, and less likely to receive optimal treatment for AMI. Consequently, the greater morbidity and mortality are noted. This finding might be explained by old age and lower education compared to typi- cal symptoms patients (31, 32). Because the education were easily ascertained and frequently used as proxies for SES, these variables can be used to screen for high-risk groups, especially among the patients with AMI who underwent PCI. Therefore, our findings indicated the importance of enhancing preventive/
rehabilitative healthcare services for post-AMI patients with lower education.
Our study had several strengths. Firstly, this study was the complete enrollment of all comers of the patients who were hos- pitalized with independently confirmed AMI and the use of rel- atively recent data that reflect the current medical practices.
Secondly, our study was the first to evaluate the roles of individ- ual-level and neighborhood-level SES measures in post-AMI prognosis. Finally, this study could contribute to existing litera- ture on the topic and also could provide the evidence for better understanding of social determinants of health in general and the issue of health equity in particular in Korea and perhaps in other developing countries of similar conditions.
There were several limitations to the present study. Firstly, because of an observational registry study, there were the base- line differences in several important prognostic factors between our primary comparison groups. The limitation of propensity score matching is that many unmatched samples are excluded from analysis, resulting in loss of data which may reduce the precision of the estimated association between the SES factors and outcomes. Thus, we included most confounders in the mul- tivariable Cox regression model. It is possible that some poten- tial confounders might have crept in. Secondly, although we
have measured SES more directly by using individual-level mea- sures and more comprehensively by looking at multiple mea- sures than many previous studies, there are facets of SES that we did not include, such as measures of wealth and occupation- al class that might provide a more comprehensive picture of so- cial class. Thirdly, we did not include additional factors that might confound the relationship between SES and rehospital- ization and mortality, specifically the behavioral or lifestyle fac- tors such as diet, substance use, or adherence to medications;
the mental health factors such as depression; and additional comorbidities. Fourthly, although we assessed risk factors at the time of the index event, we could not reliably measure how long the risk factors had been present before the AMI. Fifthly, our study cohort was comprised of the patients with AMI who underwent PCI. Therefore, our results may not be applicable to the general population of the patients with AMI. Finally, this study only included a patient population admitted to a single hospital. So, the future studies should also investigate about the patients who admitted in multicenters.
The study results indicated that the lower education was a significant associated factor to increased MACEs and mortality in patients with AMI who underwent PCI. This work also high- lights the need for continued investigation of the specific means by which SES affects a variety of health outcomes, as the mech- anisms vary by disease process and outcome.
DISCLOSURE
The authors have no conflicts of interest to disclose.
ORCID
Jeong Hun Kim http://orcid.org/0000-0002-5637-1121 Myung Ho Jeong http://orcid.org/0000-0003-4173-1494 REFERENCES
1. World Health Organization. The top 10 causes of death. Available at http:
//www.who.int/mediacentre/factsheets/fs310/en/index.html [accessed on 3 August 2013].
2. Gaziano TA, Bitton A, Anand S, Abrahams-Gessel S, Murphy A. Grow- ing epidemic of coronary heart disease in low- and middle-income coun- tries. Curr Probl Cardiol 2010; 35: 72-115.
3. Rosengren A, Subramanian SV, Islam S, Chow CK, Avezum A, Kazmi K, Sliwa K, Zubaid M, Rangarajan S, Yusuf S. Education and risk for acute myocardial infarction in 52 high, middle and low-income countries: IN- TERHEART case-control study. Heart 2009; 95: 2014-22.
4. González-Zobl G, Grau M, Muñoz MA, Martí R, Sanz H, Sala J, Masiá R, Rohlfs I, Ramos R, Marrugat J, et al. Socioeconomic status and risk of acute myocardial infarction: population-based case-control study. Rev Esp Cardiol 2010; 63: 1045-53.
5. Manderbacka K, Elovainio M. The complexity of the association between
socioeconomic status and acute myocardial infarction. Rev Esp Cardiol 2010; 63: 1015-8.
6. Salomaa V, Niemelä M, Miettinen H, Ketonen M, Immonen-Räihä P, Koskinen S, Mähönen M, Lehto S, Vuorenmaa T, Palomäki P, et al. Re- lationship of socioeconomic status to the incidence and prehospital, 28- day, and 1-yr mortality rates of acute coronary events in the FINMONI- CA myocardial infarction register study. Circulation 2000; 101: 1913-8.
7. Koh DH, Kim HR, Han SS, Jee SH. The relationship between socioeco- nomic position and the predicted risk of ischemic heart disease with us- ing health risk appraisal. J Prev Med Public Health 2006; 39: 359-64.
8. Sundquist J, Malmström M, Johansson SE. Cardiovascular risk factors and the neighbourhood environment: a multilevel analysis. Int J Epide- miol 1999; 28: 841-5.
9. Stjärne MK, Fritzell J, De Leon AP, Hallqvist J; SHEEP Study Group. Nei- ghborhood socioeconomic context, individual income and myocardial infarction. Epidemiology 2006; 17: 14-23.
10. Lawlor DA, Davey Smith G, Patel R, Ebrahim S. Life-course socioecono- mic position, area deprivation, and coronary heart disease: findings from the British Women’s Heart and Health Study. Am J Public Health 2005;
95: 91-7.
11. Kölegård Stjärne M, Diderichsen F, Reuterwall C, Hallqvist J; Sheep Study Group. Socioeconomic context in area of living and risk of myocardial infarction: results from Stockholm Heart Epidemiology Program (SHEEP).
J Epidemiol Community Health 2002; 56: 29-35.
12. Gerward S, Tydén P, Hansen O, Engström G, Janzon L, Hedblad B. Sur- vival rate 28 days after hospital admission with first myocardial infarc- tion: inverse relationship with socio-economic circumstances. J Intern Med 2006; 259: 164-72.
13. Chang WC, Kaul P, Westerhout CM, Graham MM, Armstrong PW. Ef- fects of socioeconomic status on mortality after acute myocardial infarc- tion. Am J Med 2007; 120: 33-9.
14. Gerber Y, Goldbourt U, Drory Y; Israel Study Group on First Acute Myo- cardial Infarction. Interaction between income and education in pre- dicting long-term survival after acute myocardial infarction. Eur J Car- diovasc Prev Rehabil 2008; 15: 526-32.
15. Braveman PA, Cubbin C, Egerter S, Chideya S, Marchi KS, Metzler M, Posner S. Socioeconomic status in health research: one size does not fit all. JAMA 2005; 294: 2879-88.
16. Lahelma E, Martikainen P, Laaksonen M, Aittomäki A. Pathways be- tween socioeconomic determinants of health. J Epidemiol Community Health 2004; 58: 327-32.
17. French JK, White HD. Clinical implications of the new definition of myo- cardial infarction. Heart 2004; 90: 99-106.
18. Korea Health Promotion Foundation. Health promotion strategies and programmes development for health inequalities alleviation. Manage- ment Center for Health Promotion, 2009. (Policy research 08-55).
19. Korea Centers for Disease Control and Prevention (KCDC). Korea Na- tional Health and Nutrition Examination Survey. Available at http://
knhanes.cdc.go.kr [accessed on 20 December 2006].
20. Kini AS. Coronary angiography, lesion classification and severity assess- ment. Cardiol Clin 2006; 24: 153-62.
21. Manginas A, Gatzov P, Chasikidis C, Voudris V, Pavlides G, Cokkinos DV. Estimation of coronary flow reserve using the Thrombolysis in Myo- cardial Infarction (TIMI) frame count method. Am J Cardiol 1999; 83:
1562-5.
22. Socio-economic status and risk factors for cardiovascular disease: a multicentre collaborative study in the International Clinical Epidemi- ology Network (INCLEN): the INCLEN Multicentre Collaborative Group.
J Clin Epidemiol 1994; 47: 1401-9.
23. Galobardes B, Shaw M, Lawlor DA, Lynch JW, Davey Smith G. Indica- tors of socioeconomic position (part 1). J Epidemiol Community Health 2006; 60: 7-12.
24. Gerber Y, Benyamini Y, Goldbourt U, Drory Y; Israel Study Group on First Acute Myocardial Infarction. Neighborhood socioeconomic context and long-term survival after myocardial infarction. Circulation 2010;
121: 375-83.
25. Diez Roux AV, Kershaw K, Lisabeth L. Neighborhoods and cardiovascu- lar risk: beyond individual-level risk factors. Curr Cardiovasc Risk Rep 2008; 2: 175-80.
26. Rao SV, Kaul P, Newby LK, Lincoff AM, Hochman J, Harrington RA, Mark DB, Peterson ED. Poverty, process of care, and outcome in acute coro- nary syndromes. J Am Coll Cardiol 2003; 41: 1948-54.
27. Davey Smith G, Hart C, Hole D, MacKinnon P, Gillis C, Watt G, Blane D, Hawthorne V. Education and occupational social class: which is the more important indicator of mortality risk? J Epidemiol Community Health 1998; 52: 153-60.
28. Liberatos P, Link BG, Kelsey JL. The measurement of social class in epi- demiology. Epidemiol Rev 1988; 10: 87-121.
29. Steyn K, Sliwa K, Hawken S, Commerford P, Onen C, Damasceno A, Ounpuu S, Yusuf S; INTERHEART Investigators in Africa. Risk factors associated with myocardial infarction in Africa: the INTERHEART Afri- ca study. Circulation 2005; 112: 3554-61.
30. Hwang SY, Jeong MH. Cognitive factors that influence delayed decision to seek treatment among older patients with acute myocardial infarction in Korea. Eur J Cardiovasc Nurs 2012; 11: 154-9.
31. Hwang SY, Ahn YG, Jeong MH. Atypical symptom cluster predicts a high- er mortality in patients with first-time acute myocardial infarction. Ko- rean Circ J 2012; 42: 16-22.
32. Hwang SY, Park EH, Shin ES, Jeong MH. Comparison of factors associ- ated with atypical symptoms in younger and older patients with acute coronary syndromes. J Korean Med Sci 2009; 24: 789-94.