A Study on the Correlation Analysis of the Present Status of Turbo Pumps Installed in Ships
Sang-Il Lee*․You-Taek Kim†
(Received September 16, 2008 ; Revised November 10, 2008 ; Accepted November 18, 2008)
Abstract:Now days, various types of ships are operated to transport both cargo and passengers all around the world. Most of the important auxiliary machinery installed in those ships is fluid machinery such as pumps, compressors, and fans. A large percentage of fluid machinery is pumps which are classified as turbo and positive displacement pumps.
This paper analyzes only turbo pumps out of the two types. This thesis has two aims: (a) to analyze the present status of pumps installed in merchant and training ships and (b) to find the correlation among sea going pump kW, port pump kW, GE kW, ME MCR, number of pumps, ME kgf, pump kgf. Based on the ship's type, my paper seeks to find special characteristics as a result of analyzing head, flow rate, and kW. Moreover this paper analyzes and compares number of pumps, rpm of pumps, pump kW/ME MCR and pump kW/GE kW under the conditions of seagoing and berthing according to the ship's type.
In conclusion, ① For the exact comparison, information on the head, kW, flow rate, number of pumps by ship’s type, the pump installation status of the Merchant Ships and Training Ships were tabulated and compared in this paper. ② In order to qualify one ship as the delegate ship, several methods were used. The result of the examination indicates that the chosen ships could be justified as a suitable representation of ships of their own type. ③ The correlation of several values(total pump kW, port pump kW, GE kW, seagoing pump kW, pump weight, ME weight, ME MCR, number of pumps and ME kW) could be obtained.
Key words:Turbo pump, Correlation analysis, Merchant ships, Training ships
†Corresponding Author(Department of Marine System Engineering Korea Maritime Universit. Korea, 1, Dongsam-dong, Youndo-ku, Busan 606‐791, Kore, E-mail:[email protected], Tel: 051-410-4258)
* Sea Training Center, Korea Maritime University
Nomenclature
F.O. : Fuel Oil
GE : Generator Engine G/T : Gross tonnage kW : kilowatt
LNGC: Liquified Natural Gas Carrier L.O. : Lubricating Oil
MCR : Maximum Continuous Rating ME : Main Engine
T/S : Training ship
1. Introduction
Currently, there are numerous types of ships[1] that are operated globally at sea.
Most of the auxiliary machineries that are installed in a ship are fluid machinery [2]
such as pumps, compressors and fans. A large percentage of fluid machineries in the ship are pumps. However, the only research that has taken place on pumps is on the types of pumps, their specifications, internal fluid flow and pump performance[3]. Practically, no systematic study has taken place on the relation between ship’s type and the using status and characteristics of ship's pumps. Pumps are important machineries for cooling, lubricating, supplying of fuel oil to main engine and auxiliary machineries and loading/ unloading in the ships, most of which are classified into turbo and positive displacement types except a few special pumps.
This paper is based on the present state of installation of turbo pumps in the way of ① ‐ ④ below.
①Analysis of ship's characteristics through comparing and analyzing pressure head, flow rate, kW and number of pumps classified by ships' type.
②Characterization according to the distribution of turbo pumps by ship's type.
③Comparison and analysis of the power of dividing pump by ME MCR under the conditions of seagoing and berthing.
④Analysis of the characteristics by means of dividing weight of pump by weight of ME.
Based on the results, the correlation between the variables in ①②③ and ④ stated above are analyzed.
First of all, by simultaneously testing all the ships types and comparing them separately according to ship's type to
identify the correlation between pump and the above parameters.
The varieties of ships are broad and have special characters. We would like to verify whether the ship that was chosen for this study can represent the diversity of ships.
2. The status of pump installation classified by ship's type
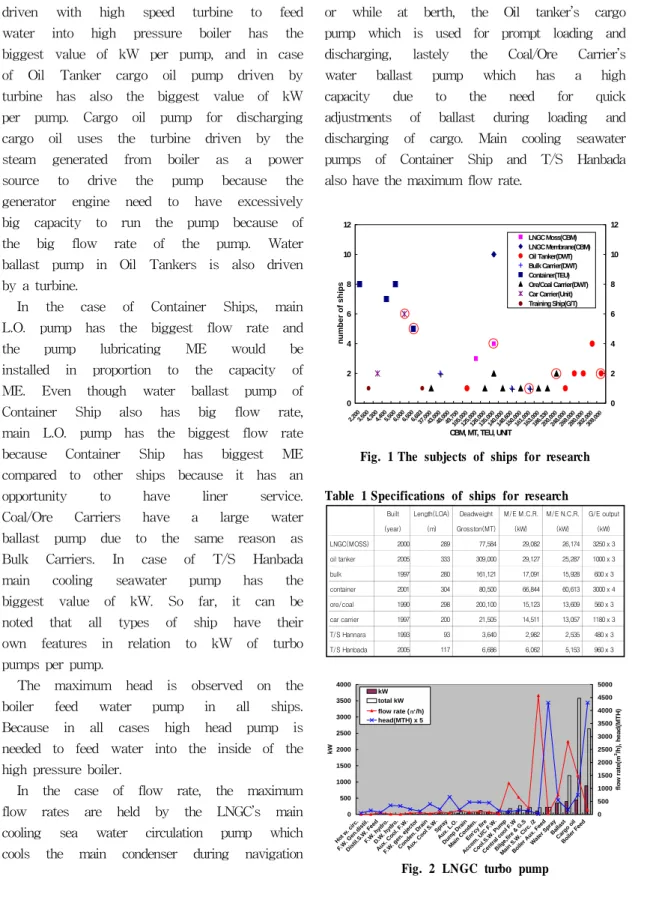
The following tabulated information are derived from a ship that is currently operating at a shipping and also from LNGCs that are operating under the Korean flag. The biggest ships classified by ship's type as illustrated in Fig.1 were selected for the study and Table 1 shows the specifications of the selected ships.
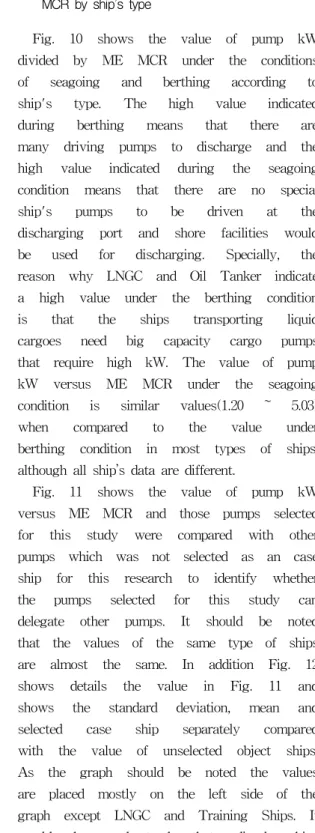
The power in kW, head, flow rate of turbo pumps of all types of ships were analyzed and Figs. 2~6 show the characteristics of the ships analyzed with the graph for Bulk Carrier, Car Carrier and Training Ship(Hannara) omitted. The vertical axis on the left of the graph indicates pump kW which is the output kW of one pump and sums up the kW of several pumps of same type, while the vertical axis on the right of the graph shows pump flow rate and head and the vertical axis on the left side shows pump kW. All data used in the paper is based on the data booklet and electric load analysis of the finished plan issued by the shipyard.
2.1 The usage characteristic of turbo pumps classified by ship's type
In LNGC, the boiler feed water pump
driven with high speed turbine to feed water into high pressure boiler has the biggest value of kW per pump, and in case of Oil Tanker cargo oil pump driven by turbine has also the biggest value of kW per pump. Cargo oil pump for discharging cargo oil uses the turbine driven by the steam generated from boiler as a power source to drive the pump because the generator engine need to have excessively big capacity to run the pump because of the big flow rate of the pump. Water ballast pump in Oil Tankers is also driven by a turbine.
In the case of Container Ships, main L.O. pump has the biggest flow rate and the pump lubricating ME would be installed in proportion to the capacity of ME. Even though water ballast pump of Container Ship also has big flow rate, main L.O. pump has the biggest flow rate because Container Ship has biggest ME compared to other ships because it has an opportunity to have liner service.
Coal/Ore Carriers have a large water ballast pump due to the same reason as Bulk Carriers. In case of T/S Hanbada main cooling seawater pump has the biggest value of kW. So far, it can be noted that all types of ship have their own features in relation to kW of turbo pumps per pump.
The maximum head is observed on the boiler feed water pump in all ships.
Because in all cases high head pump is needed to feed water into the inside of the high pressure boiler.
In the case of flow rate, the maximum flow rates are held by the LNGC’s main cooling sea water circulation pump which cools the main condenser during navigation
or while at berth, the Oil tanker’s cargo pump which is used for prompt loading and discharging, lastely the Coal/Ore Carrier’s water ballast pump which has a high capacity due to the need for quick adjustments of ballast during loading and discharging of cargo. Main cooling seawater pumps of Container Ship and T/S Hanbada also have the maximum flow rate.
0 2 4 6 8 10 12
2,200 3,500
4,300 4,400
5,500 6,000
6,500 6,683
37,000 43,000
48,000 49,700
105, 000
125, 000
126, 000
135, 000
140, 000
148,600 150,
000 161,
000 163, 000 186,330
200, 000 248, 000 269,000
280, 000 302, 000
309, 000 CBM, MT, TEU, UNIT
number of ships
0 2 4 6 8 10 12 LNGC Moss(CBM) LNGC Membrane(CBM) Oil Tanker(DWT) Bulk Carrier(DWT) Container(TEU) Ore/Coal Carrier(DWT) Car Carrier(Unit) Training Ship(G/T)
Fig. 1 The subjects of ships for research
Table 1 Specifications of ships for research
Built Length(LOA) Deadweight M/E M.C.R. M/E N.C.R. G/E output
(year) (m) Grosston(MT) (kW) (kW) (kW)
LNGC(MOSS) 2000 289 77,584 29,082 26,174 3250 x 3
oil tanker 2005 333 309,000 29,127 25,287 1000 x 3
bulk 1997 280 161,121 17,091 15,928 600 x 3
container 2001 304 80,500 66,844 60,613 3000 x 4
ore/coal 1990 298 200,100 15,123 13,609 560 x 3
car carrier 1997 200 21,505 14,511 13,057 1180 x 3
T/S Hannara 1993 93 3,640 2,982 2,535 480 x 3
T/S Hanbada 2005 117 6,686 6,062 5,153 960 x 3
0 500 1000 1500 2000 2500 3000 3500 4000
Hot w.
circ.
F.W. Gen .distil.
Distil.S.W. Feed F.W. hydro.
D.W. hy dro.
Aux.
Cool . F.
W.
F.W. gen.
ejector Conden
. D rain
Au x. Co
ol S.W. Spray
Aux. L.O. Dump Drain Main Conden
.
Em' cy
fire
Acco m. U/C F.W.
Cool.S.W. Pum p
Central cool F.W
Bilge,fire & G.S Ma
in S .W. Circ. /2 Boiler Aux.
Feed Wa
ter S pray
Ballast Carg o oi
l
Boiler Feed
kW
0 500 1000 1500 2000 2500 3000 3500 4000 4500 5000
flow rate(m3/h), head(MTH) kW
total kW flow rate (㎥/h) head(MTH) x 5
Fig. 2 LNGC turbo pump
0 500 1000 1500 2000 2500 3000 3500 4000
Hot w.
circ.
F.W. Gen .disti
l.
Disti l.S.
W. Feed F.W. hydr
o.
D.W.
hydr o.
Aux.
Cool . F.
W.
F.W. gen. ejecto r
Conden . Dr
ain
Aux.
Cool S.W.
Spray Aux. L.O.
Dump Drain Main Co nden. Em'cy fi
re
Accom. U/
C F.
W.
Cool.S.W. Pu mp
Central cool F.
W
Bilge,fire & G
.S
Main S.W. Ci
rc. /2
Boiler Aux. Feed
Water S pray
Ballast Carg o oi
l
Boiler Feed
kW
0 500 1000 1500 2000 2500 3000 3500 4000 4500 5000
flow rate(m3/h), head(MTH) kW
total kW flow rate (㎥/h) head(MTH) x 5
Fig. 3 Oil tanker turbo pump
0 200 400 600 800 1000 1200 1400 1600
Ho t w. circ. F.W. gen.
Distill.
M/E H.T circ. Feed I/G d
eck seal S.W
Boiler w ater Ci
rc.
F.W. hydroph. Eco
n. feed w.
C.O.P.T. cond.
F.W. gen. Ej ecto
r
M/E j ac.
co ol. F.W
Central cool . F.W. Aux.
co ol s.w
M/CO PT cool
S.W
Scr ubber
co ol S.W. Boiler Feed
w.
Em' cy fi
re
Bilge,fire & G
.S Main
L.O water ballast
car go oil/5
kW
0 500 1000 1500 2000 2500 3000 3500
flow rate(m3/h), head(MTH) kW
total kW flow rate (㎥/h) head (MTH)x10
Fig. 4 Container turbo pump
0 50 100 150 200 250 300
Hot W .Circ. F.W.G . dis
t.
Prov.Ref.
C.S.W .
M/E A/C Ch em.
F.W . hy
dro.
D.W. hydr o.
Boiler W. Ci rc.
Air Co n. C.S.W.
Boiler Fee d W
.
M/E J .C.F.W.
Aux. C.S.W.
F.W.G. eject. Ma
in C.S.W.
Em 'cy fire Bilge,fir
e & G .S Main L.O
.
Wa ter Ballast /4
kw
0 100 200 300 400 500 600 700
flow rate(m3/h), head(MTH) kW
total kW flow rate (㎥/h) head (MTH)
Fig. 5 Ore/coal turbo pump
0 20 40 60 80 100 120 140 160
M/E A/
C Ch em
.
G/E J.W P reheat Hot water c
irc.
M/E J .W Preheat
D.W. hy droph
.
Feed.W.
hydroph.
Boiler Feed w ater
Boile r Wa
ter Circ. M/E J.C.F.W.
F.W .hy
droph.
F.W.G. ejector S.W.
Training Chille
d Wa ter Em 'cy
fire
Bilge & Ba
llast Fire &
GS
Central C.F.W .
Main C .S.W.
kW
0 50 100 150 200 250 300 350 400
flow rate(m3/h), head(MTH)
kW total kW flow rate (m³/h) total head (MTH)
Fig. 6 T/S Hanbada turbo pump
2.2 The distribution feature of turbo pump classified by ship's type
Fig. 7 shows the total number of turbo pumps according to ship's type. Special ships like LNGC, Oil Tanker have many pumps, and T/S Hanbada also has many pumps as it's ME is a combined electronic engine and conventional cam fitted engine.
Fig. 8 displays the total number of pumps according to ship's type to compare the ships selected for this study with the unselected ships. There was no great deviation classified by ship's type in the amount of pumps to be represented as model pumps for the research, all types of ship have similar number of pumps.
Fig. 9 indicates the standard deviation[4]
and the mean of the total number of pumps according to ship's type and the ships selected for this study. The mean is the average value of the group. This Scatter diagram indicates the scattered extent of the value of variety, and the unit of measuring the variation extent or scattered state of data value is in a state of variance.
If it scatters widely from the mean, variance is large. On the other hand, if it is closed to the mean, variance is small. A square root of the variance is the standard deviation. Equation (1) is mean, equation (2) is variance, and equation (3) is standard deviation.
1 2
(X X Xn)
μ= + N+ ⋅⋅⋅ +
n i i
X N
=∑=1
(1)
2
2
(
n
i i
X N
μ
σ − )
=∑
(2)
( 2 n
i i
X N
μ σ
− )
= ∑
(3)
53
37
23 30
27 27 31 34
0 10 20 30 40 50 60
number
LNGC Oil tanker Bulk Container ore/coal car carrier
Hanara Hanbada turbo pump
Fig. 7 The number of pumps according to ship's type
0 20 40 60
number of pumps
LNG Oil tanker Bulk Container Ore/coal Car carrier Hannara Hanbada
LNG Oil tanker Bulk Container Ore/coal Car carrier Hannara Hanbada
Fig. 8 Comparison between ship for research and ships not for research for the number of pumps according to ship's type
0 2 4 6 8 10 12 14 16
20 25 30 35 40 45 50 55 60
number of pumps
number of ships
LNG LNG average Oil tanker
Oil tanker average Bulk Bulk average
Container Container average Ore/coal
Ore/coal average Car carrier Car carrier average
Hannara Hanbada
Fig. 9 Standard deviation, mean for the number of pumps according to ship's type
2.3 The power characteristics of pump kW vs. ME MCR by ship’s type
Fig. 10 shows the value of pump kW divided by ME MCR under the conditions of seagoing and berthing according to ship's type. The high value indicated during berthing means that there are many driving pumps to discharge and the high value indicated during the seagoing condition means that there are no special ship's pumps to be driven at the discharging port and shore facilities would be used for discharging. Specially, the reason why LNGC and Oil Tanker indicate a high value under the berthing condition is that the ships transporting liquid cargoes need big capacity cargo pumps that require high kW. The value of pump kW versus ME MCR under the seagoing condition is similar values(1.20 ~ 5.03) when compared to the value under berthing condition in most types of ships, although all ship’s data are different.
Fig. 11 shows the value of pump kW versus ME MCR and those pumps selected for this study were compared with other pumps which was not selected as an case ship for this research to identify whether the pumps selected for this study can delegate other pumps. It should be noted that the values of the same type of ships are almost the same. In addition Fig. 12 shows details the value in Fig. 11 and shows the standard deviation, mean and selected case ship separately compared with the value of unselected object ships.
As the graph should be noted the values are placed mostly on the left side of the graph except LNGC and Training Ships. It would be understood that diesel ships
have similar features regardless of the ship's type.
Fig. 10 Power characteristics of pump kW vs. ME MCR
0 2 4 6 8 10
sea going pump kW/MCR(%)
LNG Oil tanker Bulk Container Ore/coal Car carrier Hannara Hanbada
LNG Oil tanker Bulk Container Ore/coal Car carrier Hannara Hanbada
Fig. 11 Comparison between ship for research and ships not for research for the power characteristics of seagoing pump kW v.s. ME MCR
0 2 4 6 8 10 12
1 2 3 4 5 6 7
sea going pump kW/MCR(%)
number of ships
LNG LNG average Oil tanker
Oil tanker average Bulk Bulk average
Container Container average Ore/coal
Ore/coal average Car carrier Car carrier average
Hannara Hanbada
Fig. 12 Standard deviation, mean for the power characteristics of seagoing pump kW vs. ME MCR
0 5 10 15 20 25 30
port pump kW/MCR(%)
LNG Oil tanker Bulk Container Ore/coal Car carrier Hannara Hanbada
LNG Oil tanker Bulk Container Ore/coal Car carrier Hannara Hanbada
Fig. 13 Comparison between ship for research and ships not for research for the power characteristics of port pump kW vs. ME MCR
0 2 4 6 8 10 12
0 5 10 15 20 25 30
port pump kW/MCR(%)
number of ships
LNG LNG average Oil tanker
Oil tanker average Bulk Bulk average
Container Container average Ore/coal
Ore/coal average Car carrier Car carrier average
Hannara Hanbada
Fig. 14 Standard deviation, mean for the power characteristics of port pump kW vs. ME MCR
Fig. 13 and 14 indicate the value of pump kW/ME MCR under the berthing condition. The most important feature in contrast to the seagoing conditions is that the values of LNGC and Oil Tanker are placed on the right side of the graph. This means that the ships need more power for cargo oil pumps while at berth.
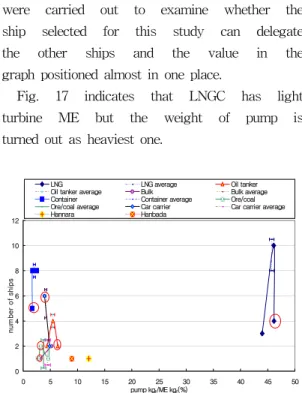
2.4 The feature of pump weight vs. ME weight by ship’s type
Fig. 15 shows the value of the Turbo
pump weight (in case of more than one pump the values are summed up) versus the ME weight according to ship's type.
The LNGC’s ME is a turbine which is light, but for Container ship’s, due to its principle for sharp time keeping in frequent arrivals and departures in ports as a liner service, it has a larger ME compared to other ships. Two Training Ships have the higher value than other Merchant Ships because they need basically all kinds of pump, even though they have small ME.
46.16
6.40 3.12
1.69
3.30 3.94
12.07 8.42
0 5 10 15 20 25 30 35 40 45 50
LNG Oil tanker Bulk Container Ore/coal car carrier hanara hanbada pump kgf /ME kg(%)
Main Engine(kgf) - LNG : 249,000 - Oil tanker : 999,000 - Bulk : 597,000 - Container : 2,136,112 - Ore/coal : 765,000 - Car carrier : 439,000 - Hanara : 66,000 - Hanbada : 128,700
turbo Pump (kgf) - LNG : 114,948 - Oil tanker : 63,916 - Bulk : 18,648 - Container : 36,018 - Ore/coal : 25,225 - Car carrier : 17.297 - Hannara : 7,969 - Hanbada : 10,833
Fig. 15 The weight characteristics of pump vs. ME
0 20 40 60
pump kg f / ME kgf(%)
LNG Oil tanker Bulk Container Ore/coal Car carrier Hannara Hanbada
LNG Oil tanker Bulk Container Ore/coal Car carrier Hannara Hanbada
Fig. 16 Comparison between ship for research and ships not for research for the mass characteristics of pump vs. ME
Fig. 16 shows that various methods were carried out to examine whether the ship selected for this study can delegate the other ships and the value in the graph positioned almost in one place.
Fig. 17 indicates that LNGC has light turbine ME but the weight of pump is turned out as heaviest one.
0 2 4 6 8 10 12
0 5 10 15 20 25 30 35 40 45 50
pump kgf/ME kgf(%)
number of ships
LNG LNG average Oil tanker
Oil tanker average Bulk Bulk average
Container Container average Ore/coal
Ore/coal average Car carrier Car carrier average
Hannara Hanbada
Fig. 17 Standard deviation, mean for the weight characteristics of pump vs. ME
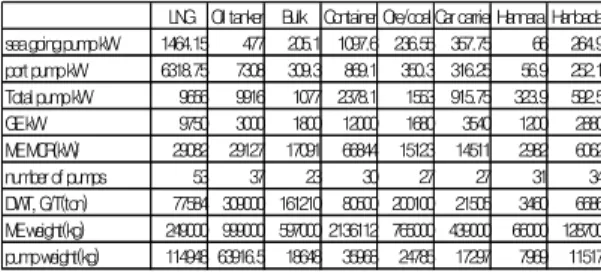
3. Analyzing correlation of all kinds of parameter classified by ship's type
Table 2 compares the values of each parameter according to ship's type. Table 3 analyzes correlation of parameters by using the Pearson's correlation coefficient[5]
procedures of Statistical Package for the Social Science (SPSS) to analyze the organic relation of the parameter. Pearson's correlation coefficient would be indicated by 'r' and the statistical definition equation used is equation (4).
1
( )( )
( 1)
n
i i
i
X Y
X X Y Y
r n S S
=
− −
= −
∑
(4)