Vol. 17, No. 8 pp. 502-507, 2016
The Impact of the Introduction of Hydrogen Energy into the Power Sector on the Economy and Energy
Sang-Ho Lee
Department of Food and Resource Economics, Yeungnam University
전력부문 수소에너지 도입의 경제 및 에너지부문 파급효과
이상호
영남대학교 식품경제외식학과
Abstract The transition from a carbon economy based on fossil fuels to a hydrogen economy is necessary to ensure energy security and to combat climate change. In order to pursue the transition to a hydrogen economy while achieving sustainable economic growth, a preliminary study into the establishment of the necessary infrastructure for the future hydrogen economy needs to be carried out. This study addresses the economic and environmental interactions in a dynamic computable general equilibrium (CGE) model focusing on the economic effects of the introduction of renewable energy into the Korean energy system. Firstly, the introduction of hydrogen results in an increase in the investment in hydrogen production and the reduction of the production cost, ultimately leading to GDP growth. Secondly, the mandatory introduction of renewable energy and associated government subsidies bring about a reduction in total demand. Additionally, the mandatory introduction of hydrogen energy into the power sector helps to reduce CO2 emissions through the transition from a carbon economy-based on fossil energy to a hydrogen economy. This means that hydrogen energy needs to come from non-fossil fuel sources in order for greenhouse gases to be effectively reduced. Therefore, it seems necessary for policy support to be strengthened substantially and for additional studies to be conducted into the production of hydrogen energy from renewable sources.
요 약 화석연료에 기반을 둔 경제구조에서 수소경제로의 이행은 에너지 안보와 기후변화의 대응이라는 측면에서 중요한 과제이다. 이러한 경제구조의 변환과정에서 발생할 수 있는 파급효과를 사전적으로 분석하는 연구가 필요하다. 따라서 이 논문은 동태 연산일반균형모형을 이용하여 수소에너지 도입이 경제와 환경에 미치는 영향을 분석하였다. 첫째, 수소 에너지 도입은 투자증대와 생산비용의 감소를 통해 GDP 증대에 기여한다. 둘째, 수소에너지와 같은 신재생에너지 도입을 위한 정부 보조의 경우 재원마련을 위한 세수증대로 인해 총수요가 감소하는 효과가 있다. 마지막으로 화석연료에서 수소경제로 전환 시키는 수소에너지 도입은 이산화탄소 배출을 감소시키는 환경적 효과가 있다 온실가스 감소를 통한 기후변화에 보다 효과적으로 대응하기 위해서는 신재생에너지에 기반을 둔 수소에너지로의 전환이 필요하다. 즉 정부는 지속가능성에 기반을 둔 수소에 너지 정책을 추진해야 하며, 향후 신재생에너지에 기반을 둔 수소에너지 도입의 경제적, 환경적 효과를 분석할 필요성이 있다.
Keywords : Emissions Trading; Regional General Equilibrium Modeling; Economic Welfare; GDP; Hydrogen energy
This work was supported by the 2014 Yeungnam University Research Grant.
*Corresponding Author : Sang Ho Lee(Yeungnam University) Tel: +82-53-810-2961 email: [email protected]
Received July 18, 2016 Accepted August 11, 2016
Revised (1st August 5, 2016, 2nd August 8, 2016, 3rd August 10, 2016) Published August 31, 2016
1. Introduction
With its rapid economic growth, especially in the
heavy and chemical industries, Korea's energy consumption has increased sharply. According to the 2014 national GHG emission statistics, Korea's total
GHG emission in 2012 recorded 688.3million TOE, increased by 0.4 percent compared with the previous year. Korea is among the top 6 countries ranked in terms of GHGs emissions and efforts to reduce emissions are urgently needed in Korea. In November 2015, the Korean government publicly announced the National Greenhouse Gas Reduction Target(37%
reduction below BAU level by 2030), making it necessary to establish an optimum reduction strategy.
In order to achieve these goals, the introduction of renewable energy is needed. The transition from a carbon economy based on fossil fuel to a hydrogen economy is necessary to ensure energy security and to combat climate change. In cases in which hydrogen is generated from low carbon energy sources, there are the additional advantages of reductions of carbon dioxide emissions. However, the introduction of hydrogen energy is expected to entail substantial costs relative to fossil energy. Thus, in order to pursue the transition to a hydrogen economy while achieving sustainable economic growth, a preliminary study into the establishment of infrastructure for the future hydrogen economy needs to be carried out.
The specific strengths and weaknesses of the bottom-up and top-down approaches explain a broad range of hybrid modeling efforts that combine the technological explicitness of bottom-up models with the economic comprehensiveness of top-down models[1]. Recent hybrid modelling approaches based on the same technique have been previously described by Bahn, Kypreos, B’Nueler and Luethi[2], Messner and Schrattenholzer[3], and Bosetti, Carraro, Galeotti, Massetti and Tavoni[4]. In an earlier paper, Bohringer[5] stressed the difference between bottom-up and top-down with regard to the characterization of technology options and associated input substitution possibilities in production. More recently, Schumacher and Sands[6] investigated process shifts and changes in the fuel input structure for the steel industry, comparing an aggregate top-down production characterization with a bottom-up description of
technologies for iron and steel production. These previous studies focused on the integration between bottom-up and top-down model. The advantages of these models provided the framework of integrated approach to the analysis of energy or climate policy options. However there was no specific models and results that was analyzed the Korean economy using integrated model.
In this paper, we evaluate the economic consequences of promoting the increased market penetration of electricity produced from hydrogen energy within Korea. We focus on the policy instruments which are central to the Korean strategy for the promotion of RPS: namely, quota obligation systems.
The remainder of this paper is as follows: Section 2 provides a brief summary of the dynamic CGE model for the promotion of hydrogen energy in electricity production. Section 3 describes the database underlying our numerical analysis and our modeling scenarios.
Section 4 presents the main results. Section 5 provides our conclusions.
2. Model specification
The model used to this paper consists of consumption, production, trade, capital stock, and government sectors.Thissectionprovidesanon-technical summary of the model.
The dynamic features allow to cover dynamic economic effects and the time dependent effects of the introduction of hydrogen energy and accumulation.
Dynamic modeling means, we have a time dependent process in which capital stocks available for use in year t+1 are determined by investment which takes place before year t+1[7]. There are two main approaches how dynamic aspects have been incorporated into CGE models: the dynamic sequencing of static equilibria, i.e the recursive dynamic approach, and the completely dynamic approach[7]. This paper
uses the recursive dynamic CGE models which solves a sequence of static equilibria. The equilibria are connected to each other through capital accumulation.
Recursive CGE models do not consider intertemporal aspects of decision making. Therefore, only economic agents with adaptive expectations can be modeled in these kinds of models[7].
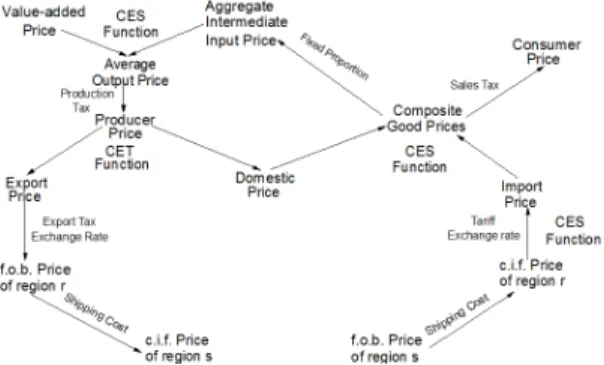
In the production, the optimization model adopts a three-tier, nested production technology that is a CES function that combines capital, labor, energy and materials at the top tier to produce output. At the second tier, inputs of both the energy and materials composites are formed from CES aggregates of goods and services. The energy composite includes output from electricity utilities, gas utilities, petroleum refining and crude oil and gas extraction. The lowest tier represents the production of goods and services purchased by the firm. These are CES aggregates of imported and domestic inputs. Figure 1 depicts the structure of production function for CGE model. The equilibrium based on neoclassical theory determined by the price mechanism. CES and CET functions for imports and exports were given a moderately elastic value of two for elasticity of substitution(transformation).
Fig. 1. The flow of production system
Household behavior is captured using a model of a representative household. In each period households consume goods and services, supply labor and save; by doing so, they demand consumer durables and residential housing. When making their decisions, households are assumed to maximize an intertemporal
utility function while facing a lifetime budget constraint.
Households invest in household capital and in return receive a flow of services. Households also receive imputed income from owning durables and housing.
Financial capital is assumed to be perfectly mobile.
Flows of financial capital between countries are subject to an interest arbitrage relation, which equalizes the expected returns on loans across all the countries each period. Capital gains and losses are possible on financial capital that is invested in physical capital, because adjustment costs cause large differences in ex post returns between countries.
3. Data and scenarios
For the calibration of the dynamic model, we adopt central case values of 5% for the time preference rate (i.e. the baseline interest rate), 2% for the growth rate of labor in efficiency units, and 7% for the capital depreciation rate[8]. These parameter values then are employed to infer the value of payments to capital across sectors and the gross value of capital formation consistent with a balanced steady-state growth path.
The value for the constant intertemporal elasticity of substitution η is set at 0.5.
In the dynamic CGE model, we replicate the initial equilibrium values using various parameters. However it was difficult to estimate parameter values directly using data, we usually have to specify these values based on existing studies or borrow conventional values.
In this paper, we use Korean national input-output (IO) data from 2013 (Bank of Korea, 2015) to create a social accounting matrix (SAM) representing transactions of industry, commodity, factor, final payments, and final demands.
In this paper, we can implement the imposition of green quotas by setting a cumulative quantity constraint on the share of electricity deriving from hydrogen energy. This quantity constraint is associated with a complementary endogenous subsidy on
renewable electricity production[8]. Hydrogen scenarios are set by mixing three alternatives from the demand side and three alternatives from the supply side corresponding to the demand side. The demand side alternatives are classified as baseline demand, high demand, and low demand according to hydrogen demand. One policy scenario consists of the impact of different introduction of hydrogen energy into electric sector, low (4.8%), base (5.0%), and high (5.2%).
Under the baseline scenario, the hydrogen demand is expected to reach 12.19 Million Ton in 2050 from 1,600 Ton in 2015. Under high demand scenario, the timing of 5% market share will be advanced from 2030 to 2025, and the hydrogen energy demand in 2050 may be 5.2% market share. Under low demand scenario, hydrogen energy will be firstly introduced from 2018 and reach 4.8% market share in 2050.
Scenarios Details for scenario
Low scenario the hydrogen energy demand in 2050 may be 4.8%
market share
Base scenariothe hydrogen demand is expected to reach 12.19 Million Ton in 2050
High scenariothe hydrogen energy demand in 2050 may be 5.2%
market share Table 1. Analysis scenarios
Target groups for this analysis included 2 regions, 6 sectors, and 3 production factors. Fossil fuels are classified as coal, oil, electricity, LNG and hydrogen, as the use of fossil fuel energy is the main reason for environmental pollution, and the degree of pollution depends on each energy source.
4. Major results
The mandatory introduction of hydrogen and government subsidies affects a reduction in the total demand. In cases in which the hydrogen energy industry is funded by government, household income will be reduced due to increases in tax, and total demand will be reduced. However, analysis shows that
demand decline eventually eases off with GDP growth.
Consumption drops below baseline levels over the full time horizon, demonstrating the welfare cost of the transition towards a green power system. There are two opposing income effects; income reduction by the government taxes and income increase through hydrogen energy industry.
Low Base High
2005 -0.012 -0.012 -0.012 2010 -0.010 -0.010 -0.010 2015 -0.010 -0.010 -0.010 2020 -0.011 -0.011 -0.011 2025 -0.011 -0.011 -0.011 2030 -0.010 -0.010 -0.010 2035 -0.008 -0.009 -0.009 2040 -0.006 -0.006 -0.007 2045 -0.004 -0.004 -0.004 2050 -0.000 -0.000 -0.000 Table 2. Changes in the final consumption relative to
the baseline scenario (%)
The reduction in production costs is explained by the financial support from the government, and GDP growth is expected to derive from the increase in the investment in hydrogen production coupled to the increase in hydrogen output. Lump-sum subsidies to hydrogen energy result in an increase in overall investment. Investment contributes to the capital accumulation, which results in a production increase.
Low Base High
2005 0.027 0.027 0.027 2010 0.045 0.047 0.047 2015 0.073 0.075 0.076 2020 0.096 0.099 0.100 2025 0.119 0.122 0.124 2030 0.141 0.145 0.147 2035 0.161 0.166 0.167 2040 0.178 0.183 0.185 2045 0.190 0.195 0.197 2050 0.194 0.199 0.201 Table 3. Changes in the investment demand relative to
the baseline scenario (%)
The introduction of hydrogen results in an increase in the investment in hydrogen production and the reduction of production cost, and ultimately leads to
GDP growth. The result of this analysis differs from other studies in which it was concluded that the introduction of hydrogen energy is expected to hinder economic growth, since its production cost is far higher than the cost of existing fossil fuels. This is because we assume government subsidy of the hydrogen industry. Therefore, the implementation of a subsidy program is critical for the successful transition to a hydrogen economy. GDP affected by consumption, investment, government spending, and net exports. In our analyses, investment affect positively to GDP.
Low Base High
2005 0.000 0.000 0.000 2010 0.013 0.013 0.013 2015 0.029 0.030 0.030 2020 0.049 0.050 0.051 2025 0.070 0.072 0.073 2030 0.092 0.094 0.095 2035 0.114 0.117 0.118 2040 0.134 0.138 0.139 2045 0.153 0.157 0.158 2050 0.168 0.172 0.174 Table 4. Changes in the GDP relative to the baseline
scenario (%)
The mandatory introduction of hydrogen energy in the power sector helps reduce CO2 emissions by virtue of the transition from a carbon economy based on fossil energy to a hydrogen economy. Our analysis shows that CO2 emissions begin to decline following the introduction of hydrogen, and decrease to 0.316%
against the BAU level by 2050 under the baseline scenario.
Low Base High
2005 0.000 0.000 0.000 2010 0.002 0.002 0.002 2015 0.005 0.005 0.005 2020 -0.040 -0.041 -0.041 2025 -0.084 -0.086 -0.087 2030 -0.128 -0.132 -0.133 2035 -0.173 -0.177 -0.179 2040 -0.217 -0.223 -0.225 2045 -0.262 -0.269 -0.272 2050 -0.308 -0.316 -0.319 Table 5. Comparison of CO2 mitigation for different
scenario (%)
5. Conclusions
This research adopts a dynamic computable general equilibrium model using a top-down approach to estimate the economic effects of the introduction of hydrogen into the Korean energy system. The principal results of the model are as follows.
Firstly, the mandatory introduction of hydrogen and government subsidies has an effect on the decline in the total demand. In cases in which the hydrogen energy industry is funded by government, household income will decrease due to tax increases and total demand will be decreased. However, our analysis demonstrates that demand decline eventually eases off with GDP growth.
Secondly, the reduction in production cost is explained by the financial support from the government; GDP growth is determined to derive from the increase in the investment in hydrogen production coupled to the increase in hydrogen output.
Thirdly, the mandatory introduction of hydrogen energy in the power sector helps to reduce CO2
emissions via the transition from a carbon economy based on fossil energy to a hydrogen economy.
As anticipated, our analysis demonstrates that the introduction of hydrogen helps reduce CO2 emissions.
This means that hydrogen energy needs to come from non-fossil fuel sources in order for green house gases to be effectively reduced. Therefore, it seems necessary that policy supports be strengthened substantially, and that additional studies are conducted into the production of hydrogen energy from renewable sources.
Our short summary is far from being comprehensive.
The omitted topics, which are potentially as important as those explicitly addressed, include implications from intertemporal flexibility, technological change and quantitative limits to trade.
References
[1] Hourcade, J.-C., Jaccard, M., Bataille, C., Gershi, F.,
“Hybrid modeling: new answers to old challenges,”
Energy Journal-Special Issue, pp.1-12, 2006.
DOI: http://dx.doi.org/10.2307/23297043
[2] Bahn, O., Kypreos, S., Büeler, B., Luethi, H.J.,
“Modelling an international market of CO2 emission permits,” International Journal of Global Energy Issues 12, pp.283-291, 1999.
DOI: http://dx.doi.org/10.1504/IJGEI.1999.000825 [3] Messner, S., Schrattenholzer, L., “MESSAGE-MACRO:
linking an energy supply model with a macroeconomic module and solving iteratively,” Energy—The International Journal 25(3), pp.267-282, 2000.
DOI: http://dx.doi.org/10.1016/s0360-5442(99)00063-8 [4] Bosetti, V., Carraro, C., Galeotti, M., Massetti, E.,
Tavoni, M., “WITCH: a world induced technical change hybrid model,” Energy Journal—Special Issue, pp.13-38, 2006.
[5] Böhringer, C., “The synthesis of bottom-up and top-down in energy policy modeling,” Energy Economics 20 (3), pp.233-248, 1998.
DOI: http://dx.doi.org/10.1016/S0140-9883(97)00015-7 [6] Schumacher, K., Sands, R.D., “Innovative energy
technologies and climate policy in Germany”. Energy Policy 34 (18), pp.3939-3941, 2006.
DOI: http://dx.doi.org/10.1016/j.enpol.2005.09.022 [7] Böhringer, C., Rutherford T.F., “Combining bottom-up
and top-down,” Energy Economics 30(2), pp.574-596, 2008.
DOI: http://dx.doi.org/10.1016/j.eneco.2007.03.004 [8] Katrin Springer, The DART General Equilibrium Model:
A Technical Description, Kiel Working Paper no. 883, 1998.
Sang-Ho Lee [Regular member]
•Feb. 1999 : Kyungpook National Univ., MS
•Feb. 2003 : Kyungpook National Univ., PhD
•March. 2014 ~ current : Yeungnam Univ., Dept. of Food and Resource Economics, Associate Professor
<Research Interests>
Agricultural Economics, Environmental and Resources Economics, Energy Economics