I. Introduction
At present, the level of public action in conducting routine health checks tends to be lacking. Based on the results of the
Kompas Research and Development poll in October 2016, almost 97% of respondents in Indonesia felt that routine health checks were beneficial. However, only one in three respondents routinely have a comprehensive health check;
most of the other respondents are reluctant to have medi- cal tests because of the high costs and lack of time to go to the hospital. Moreover, they feel that they are still healthy;
therefore, comprehensive health checks seem unnecessary to them. Checking the health of an individual here refers to two important aspects of health, namely, physical health and mental health. The medical devices that are generally used to measure these two aspects of health are still separate, so that they are considered less effective than they might be other- wise.
Physical health in a person can be measured through basic parameters of normal values of vital signs. Changes in vi- tal signs have a very important value for the monitoring of bodily functions because these changes have meaning as an
Measurement Device for Stress Level and Vital Sign Based on Sensor Fusion
Noor Cholis Basjaruddin, Febian Syahbarudin, Ediana Sutjiredjeki
Department of Electrical Engineering, Politeknik Negeri Bandung, Bandung, Indonesia
Objectives: Medical health monitoring generally refers to two important aspects of health, namely, physical and mental health. Physical health can be measured through the basic parameters of normal values of vital signs, while mental health can be known from the prevalence of mental and emotional disorders, such as stress. Currently, the medical devices that are generally used to measure these two aspects of health are still separate, so they are less effective than they might be otherwise.
To overcome this problem, we designed and realized a device that can measure stress levels through vital signs of the body, namely, heart rate, oxygen saturation, body temperature, and galvanic skin response (GSR). Methods: The sensor fusion method is used to process data from multiple sensors, so the output that shows the stress level and health status of vital signs can be more accurate and precise. Results: Based on the results of testing, this device is able to show the health status of vital signs and stress levels within ±20 seconds, with the accuracies of body temperature measurements, oxygen saturation, and GSR of 97.227%, 99.4%, and 98.6%, respectively. Conclusions: A device for the measurement of stress levels and vital signs based on sensor fusion has been successfully designed and realized in accordance with the expected functions and specifica- tions.
Keywords: Stress, Psychological, Vital Signs, Sensor Fusion, Health Status, Internet of Things
Healthc Inform Res. 2021 January;27(1):11-18.
https://doi.org/10.4258/hir.2021.27.1.11 pISSN 2093-3681 • eISSN 2093-369X
Submitted: May 27, 2020
Revised: 1st, September 13, 2020; 2nd, December 1, 2020 Accepted: December 22, 2020
Corresponding Author Noor Cholis Basjaruddin
Department of Electrical Engineering, Politeknik Negeri Bandung, Jl. Gegerkalong Hilir, Ds. Ciwaruga, Bandung 40012, Indonesia. Tel:
+62-8-1720-2982, E-mail: noorcholis@polban.ac.id (https://orcid.
org/0000-0003-2003-7452)
This is an Open Access article distributed under the terms of the Creative Com- mons Attribution Non-Commercial License (http://creativecommons.org/licenses/by- nc/4.0/) which permits unrestricted non-commercial use, distribution, and reproduc- tion in any medium, provided the original work is properly cited.
ⓒ 2021 The Korean Society of Medical Informatics
indication of the activity of organs in the body [1]. Develop- ment of new ways of measuring human vital signs has been pursued in several studies [2-4]. According to the studies [2,3], a technique to monitor human vital signs by means of radar was developed, whereas in [4], a vital sign measure- ment technique using a smart device was proposed. The de- velopment of vital sign measuring devices generally involves many sensors [5]. In the study of Sun et al. [5], a vital sign measuring instrument was developed that is able to measure the pulse rate, respiratory rate, and body temperature. Vital sign measurement using wearable electronics was also re- searched in [6]. A wearable system for measuring vital signs equipped with an energy-harvesting module was developed.
Mental health can be assessed by measuring the level of stress or monitoring an individual’s mental and emotional state. The prevalence of mental and emotional disorders as indicated by stress symptoms, such as depression and anxi- ety, for people aged 15 and above increased from around 14 million or 6% of the total population of Indonesia in 2013 to 9.6% in 2018. In addition, stress can also cause health problems, such as a decrease in the body’s immune response, which can lead to various diseases [7] and have a detrimen- tal impact on physical and mental health [8]. Several studies on the development of stress detection have been carried out [9-11]. In [9], stress monitoring was conducted through biosignal measurements processed using machine learning methods. In [10], a multimodel system for stress measure- ment was introduced, while in [11] a stress monitor using a wrist device was developed. Stress detection research that focused on the use of sensors was carried out in [12], while research focused on computing for stress detection was car- ried out in [13]. Stress detection using wearable physiologi- cal sensors has also been researched [14,15].
Because mental and physical health are closely related, we need a device that can assess both physical and mental health simultaneously. In this work, we developed such a device, which would be able to provide early warnings in the form of the health status of vital signs and stress levels using the sensor fusion method. In addition, this device can provide convenient health monitoring because it uses a mobile ap- plication, and the measurement data is stored automatically and in a cloud database. The device is expected to help users monitor their health and can provide early health warnings in the form of health status of vital signs and stress levels.
Such early warnings could prompt users to visit a doctor to have their health checked.
II. Methods
1. Sensor Fusion
Sensor fusion is a data collection technique in which data obtained by several sensors is combined to provide com- prehensive and accurate information. The information produced by fusion sensors is in some ways better than the information provided by separate sensors. In fusion sensor data retrieval, data is not directly retrieved from the sensor readings; rather, the sensor readings are processed first by other methods, such as the fuzzy logic method, the voting method, discrete Bayesian methods, neural networks, and Kalman filtering. The fusion process in decision making takes place at three levels, namely, sensors, fusion operators, and control applications [16].
2. System Design
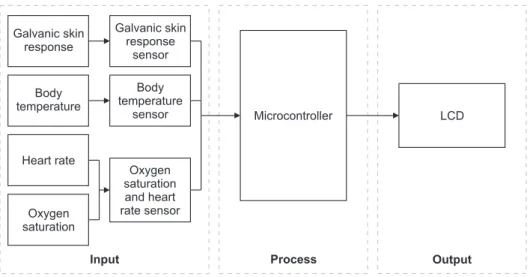
The proposed device to measure stress levels and vital signs based on sensor fusion is able to measure a person’s mental health (stress levels) and physical health (vital signs) simul- taneously. This tool can be connected to a mobile application via the Internet to facilitate health monitoring, and mea- surement data are stored in a cloud database. In this tool, the vital signs measured are oxygen saturation level (SpO2), body temperature, and heart rate. The stress level is mea- sured by combining the galvanic skin response (GSR), body temperature, and heart rate sensor readings, which are then processed by a fuzzy logic algorithm in the microcontroller to determine the stress level. A system block diagram of the device is presented in Figure 1.
1) Software design
The software for this device is divided into two parts, name- ly, the software for the microcontroller and that for the ap- plication. The software for the microcontroller functions so that the device can read and process sensor data properly and determine the stress level with the sensor fusion method using a fuzzy logic algorithm. In addition, the microcon- troller sends data processing results to cloud databases via the Internet.
Sensor reading using the sensor fusion method is done sequentially by determining the priority of initiating each component to be set in the program. This is done so that the readings between the sensors do not collide with each other.
The software in the mobile application ensures that users can sign up and log in to the application and give the com- mand of “start” to read the parameters of the body to the microcontroller. In addition, the mobile application retrieves
sensor reading data from the cloud database and determines the health status of the user’s vital signs by using the IF- THEN algorithm and saves the measurement data into the data record page.
The work process of this device starts when the user presses the “start” sensor reading button in the mobile application, where the user must sign in first. If the button is pressed, the application will send a “start” instruction so that the device will start reading the user’s biosignals for 25 seconds. The results of the biosignal reading process are processed by the microcontroller to determine the user’s stress level. Then the biosignal data and the stress level are sent to the cloud data- base by the microcontroller to later be obtained by the mo- bile application. Data in the cloud database is then retrieved by the mobile application and processed using the IF-THEN algorithm to determine the health status of the user’s vital signs. The data is then stored in the mobile application so that it can be used as a health data record.
2) Fusion sensor design
Referring to the software design of mobile applications and microcontrollers described earlier, the sensor fusion method is needed so that the device can make a final decision based on data collected by the sensor. The fusion sensor architec- ture designed for this device is shown in Figure 2.
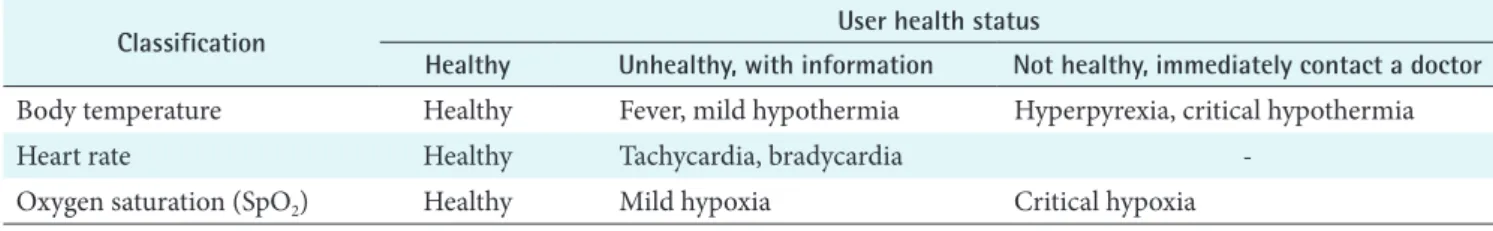
The final decision on sensor fusion for stress levels and vital signs is made based on Kozier & Erb’s Fundamentals of Nursing (Tenth Edition), which is a basic manual for nursing [17]. The classification of vital signs is shown in Table 1.
In the implementation of the device, limits are required for body temperature, heart rate, and SpO2. The normal range of body temperature for young adults is considered to be between 36°C and 37.5°C (96.8°F to 99.5°F). There are two main changes in body temperature: pyrexia and hypother- mia. Body temperature above the normal range is usually called pyrexia or hyperpyrexia. Pyrexia occurs when the body temperature ranges from 38°C (100.4°F) to 40°C (104°F). A very high fever, such as 41°C (105.8°F), is called
LCD
Process Output
Microcontroller
Input Galvanic skin
response
Body temperature
Heart rate
Oxygen saturation
Galvanic skin response
sensor
Body temperature
sensor
Oxygen saturation and heart rate sensor
Figure 1. Block diagram of the system.
Control application
Relax Calm Anxious Stress Healthy Unwell Unhealthy
Fusion operator
GSR
Sensor MLX90614 MAX30100
Classification process Classification process
Temperature status
Heart rate status
SpO status
2
Body
temperature Heart rate Oxygen saturation
GSR Figure 2. Fusion sensor design. GSR:
galvanic skin response.
hyperpyrexia [17]. Body temperature below normal, less than 35°C (95°F), is known as hypothermia.
The normal heart rate range is 60 to 100 beats per minute (bpm). A fast heart rate in adults of more than 100 bpm is called tachycardia, while a heart rate in adults less than 60 bpm is called bradycardia. If a client has tachycardia or bra- dycardia, then the client’s apical pulse should be measured [17]. Factors that affect heart rate include age, gender, exer- cise, fever, medications, dehydration, stress, and pathology.
A healthy person with normal lungs and breathing air at sea level will have an arterial oxygen saturation of 95% to 100% [17]. If the oxygen saturation is 94% or lower, then the patient is suffering from hypoxia and needs to be treated quickly. If the saturation is less than 90%, it can indicate a clinical emergency [18].
Based on Section 29 vital signs of the Fundamental of Nurs- ing [17], stress affects changes in vital sign values. The final decision on the level of stress is based on other research as shown in Table 2 [19].
The algorithm used to determine the user’s health status is IF-THEN, while the fuzzy logic algorithm is used to de- termine the stress level. The fuzzy logic block diagram for determining stress levels is shown in Figure 3.
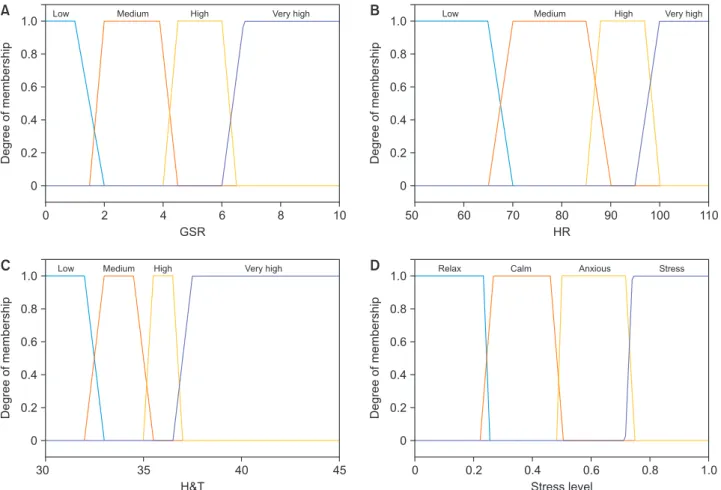
The fuzzy membership functions of GSR, heart rate, body temperature, and stress level are shown in Figure 4, and the fuzzy associative memory (FAM) of fuzzy logic is shown in Table 3.
III. Results
1. Sensors Testing
The body temperature sensor was tested by comparing tem- perature readings from a heated measuring cup obtained by a mercury thermometer and the sensor used. The user of the proposed device can take his or her body temperature by placing a finger on the sensor with a distance of ±4 mm.
Our test results showed that the temperature sensor proto- type achieved a precision level of 99.926%, an accuracy of 97.227%, and a relative error of 0.271%.
Heart rate sensor testing was done by comparing the re- sults obtained by the prototype heart rate sensor with a com- parison device, which was a heart rate sensor mounted on a smart phone that had been tested for accuracy. Heart rate data is obtained by the sensor when the user places a finger on the sensor, which has a red LED.
Oxygen saturation sensor testing was done by comparing the results obtained by prototype oxygen saturation sensor with a comparison device, which was an oxygen saturation sensor installed on a smart phone that had been tested for accuracy. The test results showed that the oxygen saturation sensor achieved a precision level of 99.7%, an accuracy of 99.4%, and a relative error of 0.3%.
GSR sensor testing was done by comparing the resistance readings obtained by the sensor prototype with those ob- tained by a multimeter. The sensor prototype obtains read- ings from two electrodes attached to two fingers of one hand. The test results showed that the prototype GSR sensor Table 2. Classification of stress level final decisions
Condition GSR (µS) Heart rate (bpm) H&T (°C)
Relax <2 60–70 36–37
Calm 2–4 70–90 35–36
Anxious 4–6 90–100 33–35
Stress >6 >100 <33
GSR: galvanic skin response, H&T: body temperature.
GSR
HR
H&T
Stress level Stress level
(mamdani)
Figure 3. Fuzzy logic system design. GSR: galvanic skin response, HR: heart rate, H&T: body temperature.
Table 1. Classification of vital sign final decisions
Classification User health status
Healthy Unhealthy, with information Not healthy, immediately contact a doctor Body temperature Healthy Fever, mild hypothermia Hyperpyrexia, critical hypothermia
Heart rate Healthy Tachycardia, bradycardia -
Oxygen saturation (SpO2) Healthy Mild hypoxia Critical hypoxia
0 2 4 6 8 1.0
0.8 0.6 0.4 0.2
10
Degreeofmembership
GSR 0
A B
C D
Low Medium High Very high
50 60 70 80 90 100
1.0 0.8 0.6 0.4 0.2
110
Degreeofmembership
HR 0
Low Medium High Very high
30 35 40
1.0 0.8 0.6 0.4 0.2
45
Degreeofmembership
H&T 0
Low Medium High Very high
0.2 0.4 0.6 0.8
1.0 0.8 0.6 0.4 0.2
1.0
Degreeofmembership
Stress level 0
Relax Calm Anxious Stress
0
Figure 4. Membership function of (A) galvanic skin response (GSR), (B) heart rate (HR), (C) body temperature (H&T), and (D) stress level.
Table 3. Fuzzy associative memory
GSR Body temperature Heart rate
Low Medium High Very high
Low Low Relax Anxious Anxious Anxious
Medium Relax Calm Anxious Anxious
High Relax Calm Calm Anxious
Very high Relax Relax Calm Anxious
Medium Low Anxious Anxious Anxious Stress
Medium Calm Calm Anxious Anxious
High Calm Calm Calm Anxious
Very high Relax Calm Calm Relax
High Low Anxious Calm Anxious Anxious
Medium Anxious Anxious Anxious Anxious
High Calm Calm Anxious Anxious
Very high Calm Calm Anxious Stress
Very high Low Anxious Anxious Stress Anxious
Medium Anxious Anxious Anxious Stress
High Anxious Calm Anxious Stress
Very high Calm Calm Anxious Stress
GSR: galvanic skin response.
Table 4. Vital signs health status and stress level classification testing results
No
Vital signs health status testing results Stress level classification testing results Heart
rate (bpm)
Body temperature
(ᵒC)
Oxygen saturation
(%)
Status Information Heart rate (bpm)
Body temperature
(ᵒC)
GSR
(µS) Status Fuzzy output
1 93.20 35.00 96 Unhealthy Mild
hypothermia
93.20 35.00 2.33 Anxious 0.61
2 83.83 37.11 95 Healthy - 83.83 37.11 2.60 Calm 0.36
3 68.42 36.79 95 Healthy - 68.42 36.79 2.25 Calm 0.26
4 60.78 36.55 95 Healthy - 60.78 36.55 1.92 Calm 0.34
5 80.90 36.07 95 Healthy - 80.90 36.07 2.22 Calm 0.36
6 79.23 38.21 96 Unhealthy Fever/pyrexia 79.23 38.21 2.14 Calm 0.36
7 90.90 34.93 97 Not healthy Hypothermia 90.90 34.93 6.00 Anxious 0.61
8 82.00 37.00 94 Unhealthy Mild hypoxia 82.00 37.00 2.97 Calm 0.36
9 85.29 36.41 99 Healthy - 85.29 36.41 0.77 Calm 0.36
10 107.45 37.87 97 Unhealthy Tachycardia 107.45 37.87 6.00 Stress 0.86
GSR: galvanic skin response.
Table 5. Results of overall fusion sensor testing
No Heart rate
(bpm)
Body
temperature (ᵒC) GSR (µS) Oxygen saturation (%)
Status
Stress level Vital signs
1 87.17 37.03 1.64 97 Calm Healthy
2 81.01 37.39 4.65 99 Calm Healthy
3 74.01 36.51 4.49 100 Calm Healthy
4 84.98 36.05 3.04 100 Calm Healthy
5 102.92 35.95 1.58 99 Anxious Unhealthy
6 80.05 36.25 0.99 96 Calm Healthy
7 71.72 36.45 1.41 99 Relax Healthy
8 69.25 35.75 2.29 98 Calm Unhealthy
9 65.63 36.75 1.02 99 Relax Healthy
10 107.45 37.87 6.00 95 Stress Unhealthy
GSR: galvanic skin response.
A B
Figure 5. (A) Mobile application views and (B) intake of data from the body to the instrument.
achieved a precision level of 97.402%, an accuracy of 94.66%, and a relative error of 2.59%.
2. Fusion Sensor Method for Vital Sign Health Status and Stress Level Testing
The ultimate method of sensor fusion or the final output of this device is divided into two decisions, namely, the vital sign health status and stress level. The decision on the health status of vital signs is based on the data readings of heart rate, oxygen saturation, and body temperature. The health status of vital signs is determined using the IF-THEN algo- rithm. The health status of vital signs is presented as three possible outcomes: healthy, unhealthy (with information), and unhealthy (with advice to immediately contact a doc- tor). The ultimate method of sensor fusion (control applica- tion) or the final output of this device is divided into two decisions, namely, the health status of vital signs and stress levels. The stress level status decision determines the user’s stress level based on the combined data readings of the heart rate, GSR, and body temperature. This determination of stress levels uses fuzzy logic algorithms. Stress level status is divided into four possible outcomes, namely, relaxed, calm, anxious, and stressed. Table 4 shows the results of vital sign health status and stress levels testing.
3. Realization of Mobile Applications and Overall System Testing
Human-machine interface (HMI) in the form of a mobile application on this device displays data from sensor read- ings and sensor fusion processing. This mobile application also saves the user’s health record data. The mobile applica- tion was created using App Inventor, an open-source web application. In this application, Bluetooth is used to send commands to the microcontroller to “start” a sensor reading and “stop” a sensor reading. The Internet is used to receive sensor readings from the microcontroller and send/read data from the Firebase cloud database. The results obtained for the mobile application are shown in Figure 5A.
For overall system testing, the sensor fusion algorithm was tested as a whole to see whether the communication between the devices, databases, and mobile applications takes place properly or not. This testing was carried out to determine whether the proposed device can work in accordance with the expected functions and specifications.
The first test was the sensor fusion test as a whole. As shown in Figure 5B, data was retrieved from the user’s body by attaching the user’s index finger and middle finger of the right hand to the space located on the front of the prototype
device. The results of the overall system test to determine the health status of vital signs and stress levels are shown in Table 5.
IV. Discussion
A device to measure stress levels and vital signs based on sensor fusion was successfully designed and realized in ac- cordance with the expected functions and specifications.
The device can determine the stress level based on the vital signs read by sensors using the sensor fusion method. This device can also be connected to mobile applications via the Internet.
The sensors used in this device achieved relatively high lev- els of precision and accuracy. The precision levels achieved by the sensors used to obtain body temperature, oxygen saturation, and GSR readings were 99.926%, 99.7%, and 99.302%, respectively. The accuracy levels of body tempera- ture, oxygen saturation, and GSR readings were 97.227%, 99.4%, and 98.6%, respectively.
To display the stress level and vital sign status results, this device must be connected to the Internet. From the trial results, the minimum data transmission time is 1 second, while the average is ±3 to 8 seconds, depending on the speed of the Internet network used.
The classification algorithms developed in this study were not evaluated by consulting experts as a comparison. This research can be extended by consulting experts to verify the decisions made by the proposed device. In addition, the pro- posed device can be improved by utilizing additional sen- sors, such as microwave radar and thermography cameras.
Conflict of Interest
No potential conflict of interest relevant to this article was reported.
ORCID
Noor Cholis Basjaruddin (https://orcid.org/0000-0003-2003-7452) Febian Syahbarudin (https://orcid.org/0000-0003-1224-3205) Ediana Sutjiredjeki (https://orcid.org/0000-0001-5959-0867)
References
1. Yilmaz T, Foster R, Hao Y. Detecting vital signs with wearable wireless sensors. Sensors (Basel) 2010;10(12):
10837-62.
2. Uthayakumar GS, Sivasubramanian A, Kisho AG. A novel technique to monitor human body vital signs. Int J Biomed Res 2013;4(09):642-59.
3. Khan F, Cho SH. A Detailed algorithm for vital sign monitoring of a stationary/non-stationary human through IR-UWB radar. Sensors (Basel) 2017;17(2):290.
4. Satwik K, Ramesh NV, Reshma SK. Estimation and monitoring of vital signs in the human body by using smart device. Int J Innov Technol Explor Eng 2019;8(5):
1035-8.
5. Sun G, Matsui T, Watai Y, Kim S, Kirimoto T, Suzuki S, et al. Vital-SCOPE: design and evaluation of a smart vi- tal sign monitor for simultaneous measurement of pulse rate, respiratory rate, and body temperature for patient monitoring. J Sens 2018;2018:4371872.
6. Dionisi A, Marioli D, Sardini E, Serpelloni M. Autono- mous wearable system for vital signs measurement with energy-harvesting module. IEEE Trans Instrum Meas 2016;65(6):1423-34.
7. American Psychological Association. Stress weakens the immune system [Internet]. Washington (DC): American Psychological Association; 2006 [cited at 2021 Jan 17].
Available from: https://www.apa.org/research/action/
immune.
8. Kupriyanov R, Zhdanov R. The eustress concept: prob- lems and outlooks. World J Med Sci 2014;11(2):179-85.
9. Cho D, Ham J, Oh J, Park J, Kim S, Lee NK, Lee B. De- tection of stress levels from biosignals measured in vir- tual reality environments using a kernel-based extreme learning machine. Sensors (Basel) 2017;17(10):2435.
10. Alberdi A, Aztiria A, Basarab A. Towards an automatic early stress recognition system for office environments based on multimodal measurements: a review. J Biomed Inform 2016;59:49-75.
11. Gjoreski M, Lustrek M, Gams M, Gjoreski H. Monitor- ing stress with a wrist device using context. J Biomed Inform 2017;73:159-70.
12. Akbar F, Mark G, Pavlidis I, Gutierrez-Osuna R. An empirical study comparing unobtrusive physiological sensors for stress detection in computer work. Sensors (Basel) 2019;19(17):3766.
13. Greene S, Thapliyal H, Caban-Holt A. A survey of affec- tive computing for stress detection: evaluating technolo- gies in stress detection for better health. IEEE Consum Electron Mag 2016;5(4):44-56.
14. Mozos OM, Sandulescu V, Andrews S, Ellis D, Bellotto N, Dobrescu R, et al. Stress detection using wearable physiological and sociometric sensors. Int J Neural Syst 2017;27(2):1650041.
15. Betti S, Lova RM, Rovini E, Acerbi G, Santarelli L, Cabiati M, et al. Evaluation of an integrated system of wearable physiological sensors for stress monitoring in working environments by using biological markers. IEEE Trans Biomed Eng 2018;65(8):1748-58.
16. Elmenreich W. Sensor fusion in time-triggered systems [dissertation]. Vienna, Austria: Vienna University of Technology; 2002.
17. Berman A, Snyder SJ, Frandsen G. Kozier & Erb’s fun- damentals of nursing. 10th ed. Hoboken (NJ): Pearson;
2016.
18. World Health Organization. Pulse oximetry training manual. Geneva, Switzerland: World Health Organiza- tion; 2011.
19. Hadya PK. Rancang bangun alat pengukur tingkat stres menggunakan metode fuzzy logic [Design and devel- opment of stress level measurement using fuzzy logic method]. Surabaya, Indonesia: Institut Bisnis dan Infor- matika Stikom Surabaya; 2014.