Guidelines for Cardiovascular Magnetic Resonance Imaging from the Korean Society of Cardiovascular Imaging (KOSCI) - Part 3: Perfusion, Delayed Enhancement, and T1- and T2 Mapping
This is an Open Access article distributed under the terms of the Creative Commons Attribution Non-Commercial License (http://creativecommons.org/licenses/
by-nc/4.0/) which permits unrestricted non-commercial use, distribution, and reproduction in any medium, provided the original work is properly cited.
Received: October 23, 2019 Revised: October 23, 2019 Accepted: October 29, 2019 Correspondence to:
Eun-Ah Park, M.D., Ph.D.
Department of Radiology, Seoul National University Hospital, 101 Daehak-ro, Jongno-gu, Seoul, 03080, Korea.
Tel. +82-2-3010-3950 Fax. +82-2-476-0090 E-mail: [email protected]
Copyright © 2020 Korean Society of Magnetic Resonance in Medicine (KSMRM)
Review Article
This document is the third part of the guidelines for the interpretation and post-processing of cardiac magnetic resonance (CMR) studies. These consensus recommendations have been developed by a Consensus Committee of the Korean Society of Cardiovascular Imaging (KOSCI) to standardize the requirements for image interpretation and post-processing of CMR. This third part of the recommendations describes tissue characterization modules, including perfusion, late gadolinium enhancement, and T1- and T2 mapping. Additionally, this document provides guidance for visual and quantitative assessment, consisting of “What-to-See,”
“How-To,” and common pitfalls for the analysis of each module. The Consensus Committee hopes that this document will contribute to the standardization of image interpretation and post-processing of CMR studies.
Keywords: Cardiac magnetic resonance; Interpretation; Post processing Dong Jin Im1, Su Jin Hong2, Eun-Ah Park3*, Eun Young Kim4*, Yeseul Jo5, Jeong Jae Kim6, Chul Hwan Park7, Hwan Seok Yong8, Jae Wook Lee9, Jee Hye Hur10, Dong Hyun Yang4, Bae-Young Lee11
1Department of Radiology and Research Institute of Radiological Science, Severance Hospital, Yonsei University College of Medicine, Seoul, Korea
2Department of Radiology, Hanyang University Guri Hospital, Hanyang University College of Medicine, Guri, Korea
3Department of Radiology, Seoul National University Hospital, Seoul, Korea
4Department of Radiology and Research Institute of Radiology, Asan Medical Center, University of Ulsan College of Medicine, Seoul, Korea
5Department of Radiology, Incheon St. Mary's Hospital, College of Medicine, The Catholic University of Korea, Incheon, Korea
6Department of Radiology, Jeju National University Hospital, Jeju, Korea
7Department of Radiology and Research Institute of Radiological Science, Gangnam Severance Hospital, Yonsei University College of Medicine, Seoul, Korea
8Department of Radiology, Korea University Guro Hospital, Seoul, Korea
9Department of Radiology, Soonchunhyang University Bucheon Hospital, Bucheon, Korea
10Department of Radiology, Hanil General Hospital, Seoul, Korea
11Department of Radiology, Eunpyeong St. Mary's Hospital, College of Medicine, The Catholic University of Korea, Seoul, Korea
INTRODUCTION
This document is the third part of the guidelines for the protocol, the interpretation and post-processing of cardiac magnetic resonance (CMR) studies. These recommendations have been developed by the Consensus Committee of the Korean Society of Cardiovascular Imaging (KOSCI) to meet the need for the standardization of image interpretation and post-processing of CMR. They not only provide guidance
to a novice reader about how to interpret CMR images but also ensure consistent quality and reproducibility of CMR reports.
This third part of the recommendations focuses on tissue characterization modules, including perfusion, late gadolinium enhancement (LGE), and T1- and T2 mapping.
Each module offers visual, and quantitative assessment that consist of “What-to-See,” “How-To,” and common pitfalls. Quantitative assessment of perfusion imaging that
Table 1. Comparison between True Inducible Perfusion Defect and Dark Banding Artifacts Adapted from Reference (2) True Inducible Perfusion Defect Dark Banding Artifacts
Timing of appearance Occurs first when contrast reaches LV myocardium Typically occur first and are most prominent when contrast arrives in the LV blood pool
Present at stress but not at rest Present at stress and at rest with no corresponding scar
Signal Shows increase in signal compared with baseline, even if it is small
Show reduction in signal compared with baseline myocardial signal
Duration Persists after peak myocardial enhancement and usually for more than 4 heart beats
Persist only transiently before peak myocardial contrast enhancement and often for less than 6 heart beats
Size More than one pixel wide Approximately one pixel wide
Location and changes
Most noticeable in subendocardial portion of myocardium. Often exhibits as transmural defect.
Over time, defect regresses from epicardium toward subendocardium
Appear in subendocardial portion of myocardium and in phase-encoding direction
Conformation to coronary vascular territory
Corresponds to distribution territory of coronary
arteries No
LV = left ventricular
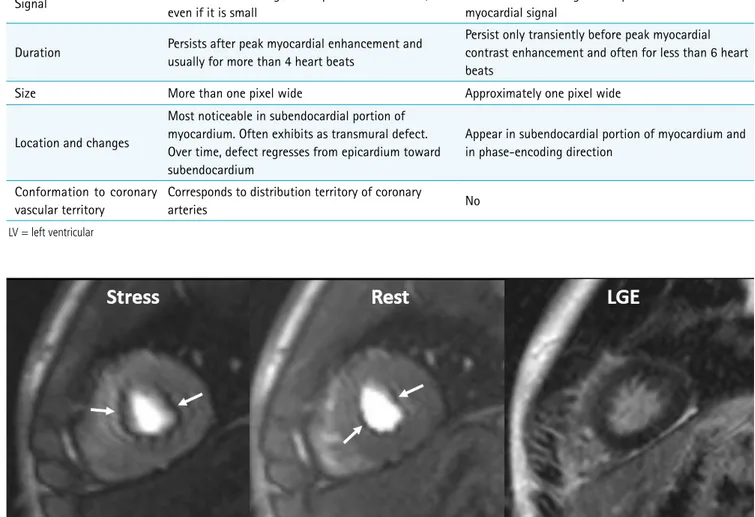
Fig. 1. Dark banding artifact in 18-year-old man. Defect (arrows) is approximately one pixel wide, prominent in phase- encoding direction (right-left in this case), and already appears before contrast reaches myocardium. Even though this defect is seen on both stress and rest perfusion images, there is no delayed enhancement in corresponding region on LGE image. LGE = late gadolinium enhancement
is being conducted for research purposes is not included, as these recommendations are designed for the application of CMR in clinical daily practice. Visual assessment of T1- and T2 mapping was not included because of limited use.
Additionally, example reports for representative cases with common disease entities are included to offer practical assistance for a beginner.
These guidelines are not mandatory. It is anticipated that they will be properly used and adopted according to individual hospital situations and clinical scenarios.
The Consensus Committee hopes that this document can contribute to the standardization of image interpretation and post-processing in CMR studies.
MYOCARDIAL PERFUSION IMAGING
Visual Assessment I. What-to-See
1. Evaluate the presence or absence of inducible perfusion
defects (Table 1).
2. If perfusion defects exist, describe location based on a 17-segment model, transmural extent, and extent of perfusion defects relative to scar on LGE.
3. Estimate the number of involved segments.
II. How-To
1. Display both rest and stress perfusion images side by-side, using a stack or cine mode. If possible, also display corresponding LGE images.
2. Adjust window width and level. Avoid “overspilling”
of the left ventricular (LV) cavity signal into the myocardium.
3. Apply the same window setting to all images.
4. Compare rest and stress images to identify relative hypoperfusion.
III. Pitfalls
1. Dark banding (rim) artifacts: Subendocardial dark banding artifacts are common sources of false-positive interpretation (Fig. 1, Supplementary Movie 1). Table 1
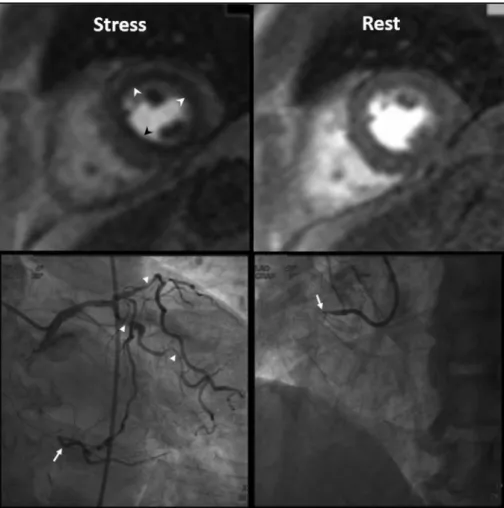
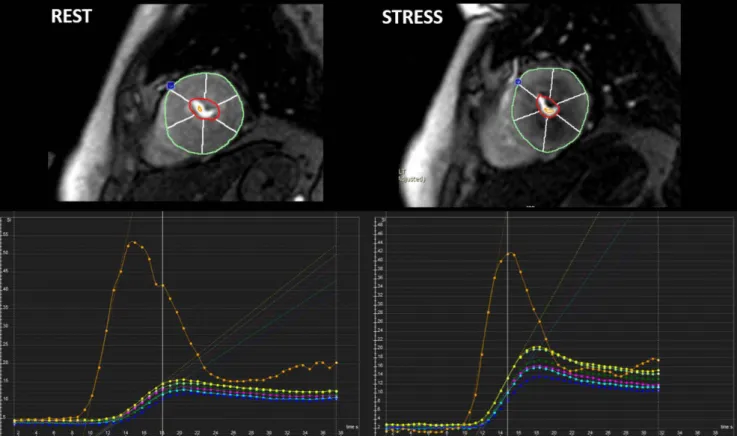
Fig. 2. Three-vessel disease in 70-year-old man. Ring-like subendocardial perfusion defect (arrowheads) is seen on stress, and disappears on rest images (upper row). Differentiation from microvascular disease may be challenging. Patient had multifocal severe stenosis (arrowheads) at left anterior descending and left circumflex coronary arteries. Right coronary artery angiogram (on right lower) shows total occlusion (arrow) at proximal segment, and distal segment (arrow) reconstituted via big septal branch is seen on left coronary angiogram (on left lower) (Courtesy of Sung-A Chang, Samsung Medical Center).
summarizes differential points (1, 2).
2. Multi-vessel disease: Balanced multi-vessel disease can result in subendocardial hypoperfusion in most, or all segments (Fig. 2, Supplementary Movie 2), which can lead to false-negative interpretation, or misdiagnosis of microvascular disease, as visual analysis reflects a relative myocardial perfusion (3). On visual analysis, a discernible signal gradient between subendocardial and subepicardial myocardium may be seen in multi-vessel disease. Quantitative analysis of absolute coronary blood flow can help to further reveal diminished myocardial perfusion reserve in multi-vessel disease (2, 4).
3. Microvascular disease: Diseases that affect the myocardial microvasculature, such as diabetes mellitus or systemic hypertension (also called “syndrome X”), may result in subendocardial concentric reduction in perfusion, traversing coronary territories (5) (Fig.
3, Supplementary Movie 3). Differentiation from multi-vessel disease or dark banding artifacts can be challenging.
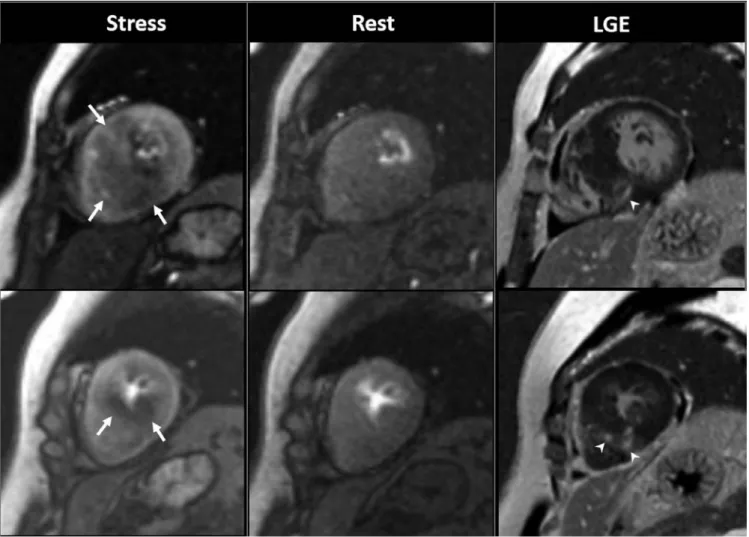
4. Hypertrophic cardiomyopathy (HCM): Patchy or subendocardial inducible ischemia can be seen in
HCM (Fig. 4, Supplementary Movie 4). Intramural coronary artery disease (CAD), which is pathologically characterized by smooth muscle thickening and luminal narrowing, may be attributable to an ischemia in HCM (6). The fact that fibrosis is present within the area of an ischemia, and is smaller than the area of an ischemia, supports this speculation (7).
5. Delayed perfusion in a patient who is post bypass graft:
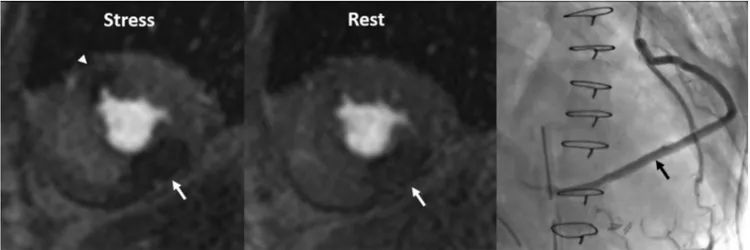
A delayed perfusion due to long graft pathway in a post bypass graft can mimic a true perfusion defect on myocardial stress MRI (8). The differential points are extent and duration: delayed perfusion from a long bypass graft pathway is transmural, while in true perfusion defects, hypoenhancement is non-transmural in most cases, and true perfusion defects tend to last longer. Additionally, a delayed perfusion from a long bypass graft pathway appears on both stress and rest images. Semi-quantitative and quantitative measurements are helpful to differentiate between them, because perfusion parameters of a delayed perfusion from a long graft are not deteriorated, and like those of the normal myocardium (Fig. 5, Fig. 3. Microvascular disease in 73-year-old man with 20-year history of diabetes mellitus. Patient complains of chest pain. Invasive coronary angiography shows insignificant findings. Note global subendocardial perfusion defect (arrowheads), which is more than one pixel wide on stress perfusion images.
Supplementary Movie 5).
6. Overcalling of inducible ischemia: Certain conditions, such as microvascular obstruction (MVO) in acute myocardial infarction, infarcted tissue, thrombus, and tumor, can appear as a hypo-signal on stress perfusion imaging. Evaluating them with LGE images is important to prevent misinterpretation as inducible ischemia.
7. Inadequate effect of vasodilator stress: Caffeine is a nonspecific competitive antagonist of all adenosine receptor subtypes; therefore, it may hamper the coronary vasodilatory effects of adenosine agonists (9). Despite the conflicting and limited published data, current guidelines recommend that caffeine be withheld for 12 hours prior to vasodilator stress myocardial perfusion imaging (10).
Semi-Quantitative Assessment I. What-to-See
1. Analysis methods of the signal intensity (SI) profile of myocardial dynamic perfusion CMR data, without estimating the absolute myocardial blood flow (11) (Fig.
6).
2. Maximal up-slope (12): May be normalized to LV up- slope.
3. Time to peak SI of the myocardial SI profile (13).
4. The up-slope integral (14): Area under the SI-time curve until arterial input function (AIF) peak, also normalized to the up-slope integral of LV.
5. Myocardial perfusion reserve index (15): Ratios of stress value divided by the rest value of each above parameter.
Fig. 4. Inducible ischemia in 52-year-old woman with septal-type HCM. Inducible, global, subendocardial perfusion defects (arrows) are present in mid to apical segments, and extent of defects is greater in hypertrophied septum of left ventricle on stress images. Compared to LGE images, fibrosis (arrowheads) exists within area of ischemia and is smaller than perfusion defects. HCM = hypertrophic cardiomyopathy
II. How-To
01. Select an image from the dynamic series with good contrast.
02. Draw LV endocardial and epicardial contours on this image manually or automatically.
03. Propagate contours to all other dynamic images.
04. Place a separate region of interest (ROI) in the LV blood pool. Preferably, the basal slice is used without including papillary muscles.
05. Select a reference point in the LV myocardium for segmentation (usually the right ventricular [RV]
insertion point).
06. Generate time-intensity curve from myocardial segments and LV blood pool.
07. Make sure to substrate baseline signal in the time- intensity curve.
08. Time window for calculation starts from the contrast arrival in the LV.
09. Some MR vendors provide inline post-processing of up-slope mapping after automatic motion correction and registration at each perfusion imaging.
10. Dedicated software provides regional values for myocardial segments, and LV blood pool, according to American Heart Association classification (Fig. 7).
11. Consider separate calculation of endocardial and epicardial layers, and repeat analysis.
III. Pitfalls
1. SI may vary according to the distance from coil.
2. No absolute measurement of myocardial blood flow derived.
3. Confounding effect of the quantity in the denominator,
which serves the role of normalization, causes unreliable results. For example, in patients with hypertension, resting blood flow may be abnormally elevated in proportion to the rate-pressure product (10). Evaluating the myocardial perfusion reserve from a ratio in this situation would be inaccurate.
Quantitative Assessment I. What-to-See
1. Estimation of absolute myocardial blood flow (unit:
mL/min/g) by analyzing the SI profile of myocardial dynamic perfusion CMR data (11).
Fig. 5. Inducible ischemia and delayed perfusion in 50-year-old man who underwe saphenous venous Y graft (arrow) to posterior descending coronary artery (Adapted from Kim et al. Korean J Radiol 2014;15:188-194 (8)).
Fig. 6. Simple diagram exhibiting semi-quantitative perfusion parameters. AIF = arterial input function; SI = signal intensity
II. How-To
1. Quantitative analysis is performed in the same manner as the semi-quantitative analysis.
2. AIF to analyze absolute myocardial blood flow is required, and can be derived from the ROI in the LV blood pool.
3. Generally, there are two approaches that can be used to quantify myocardial blood flow using contrast- enhanced CMR perfusion data: model-based (16) and model-independent methods (17).
III. Pitfalls
1. Use of an adequate pulse sequence and contrast regime is the prerequisite for reliable quantification.
2. Correction of the AIF for saturation effects, resulting in the nonlinearity of the relationship between SI and contrast concentration.
3. Dual-bolus injection method that uses diluted contrast agent as pre-bolus before the main bolus (18, 19): an initial minibolus (i.e., 0.0025 mmol/kg) to maintain blood pool linearity followed by a high dose (i.e., 0.05
or 0.10 mmol/kg) to maximize myocardial signal-to- noise ratio (SNR) 10 or 20 seconds later. Low doses of contrast to minimize saturation effects: 0.025-0.050 mmol/kg for quantification is usually used, strictly less than 0.03 mmol/kg.
4. Dual-T1 sensitivity method with high dose, single injection (20): This method uses a low-resolution sequence with a short saturation-recovery time to measure AIF and a high-resolution sequence with a long saturation-recovery time to assess myocardial output within each R-R interval.
5. The optimal solution to the nonlinearity of the myocardium has not been defined yet because of more complex challenges.
6. Use of an intravascular contrast agent instead of an extracellular agent can simplify the estimation of blood flow, due to absence of leakage into the interstitial space (zero permeability surface area product), and it can improve the accuracy of blood flow estimates (21).
7. Baseline correction: Background signal should be subtracted before contrast enhancement.
Fig. 7. Example of semi-quantitative perfusion analysis using dedicated software. Regional maximal up-slope values are demonstrated based on 17-segment model on time-SI profile. Blue dot in anterior junction of right ventricular insertion point indicates reference point in left ventricular myocardium for segmentation.
8. At least 10 minutes interval after contrast injection to minimize the influence of the first perfusion scans.
LATE GADOLINIUM ENHANCEMENT IMAGING
Visual Assessment I. What-to-See
1. Identify irreversibly injured myocardial tissue.
2. If delayed enhancement exists, describe the location based on a 17-segment model, pattern of LGE (subepicardial, intramural, subendocardial, or transmural), transmural extent, viability, and the presence of MVO or thrombus.
3. Estimate number of segments involved.
II. How-To
1. Determine the optimal inversion time (TI) using initial TI scout imaging, to obtain a good-quality LGE image. The optimal TI differs depending on the contrast material clearance from the normal myocardium. In general, a slightly too long TI is preferred over a slightly too short TI (22) (Fig. 8).
2. Use phase-sensitive inversion recovery (PSIR) imaging.
PSIR imaging is less sensitive to TI, and shows infarct tissue as bright, and always shows the normal myocardium as dark, regardless of the TI.
3. Adjust window width and level to avoid noise, and to prevent the LGE regions to be cut-off.
4. Determine the presence of LGE. If high SI is as bright as the LV blood pool, it is considered as LGE.
5. Assess the pattern of LGE (23, 24). CAD type is typically seen as subendocardial involvement that corresponds
to a coronary artery perfusion territory (Fig. 9). Non- CAD type is usually described as subendocardial sparing and myocardial enhancement restricted to the mid-wall or epicardium (Fig. 10).
6. Evaluate the average transmural extent of LGE. In each of 17 standardized myocardial segments, LGE region is scored with a five-point scale (0%, 1-25%, 26-50%, 51-75%, 76-100%) (25).
7. Compare LGE image with cine and perfusion images to categorize ischemia and viability (26).
a b
Fig. 8. Role of TI in LGE imaging. Left image (a) shows wrong nulling of normal myocardium that is shown to be darkest at border with higher SI centrally. These findings signify that degree of LGE may be underestimated if TI is too short. Right image (b) shows optimal nulling of myocardium with repeated image taken at longer TI and demonstrates larger LGE area in inferior wall (arrows). TI = inversion time
Fig. 9. Pattern assessment in LGE image in patient with coronary artery disease. Most important finding of ischemic pattern is that LGE lesion follows coronary artery distribution. This patient shows delayed enhancement (arrows) at mid inferolateral wall of left ventricular myocardium, indicating left circumflex artery territory.
Lesion of ischemic pattern starts at endocardium extending toward epicardium, according to concept of wave front phenomenon of myocardial death.
8. Identify MVO or thrombus, and distinguish it from viable myocardium.
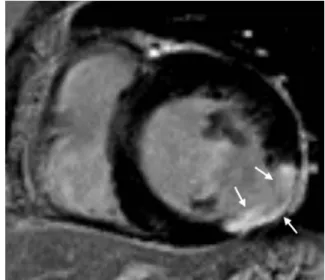
A. MVO is shown as a central hypo-enhanced region within an avidly hyper-enhanced region of infarcted myocardium on LGE image (Fig. 11). Although the appearance of MVO on first-pass perfusion and early and LGE sequences is similar, LGE is a more accurate predictor of adverse ventricular remodeling and future major adverse cardiovascular events (27).
B. LV thrombus occurs at the endocardial surface area covering the site of myocardial infarction. In patients with MVO, the low SI on LGE is localized within the myocardium. However, in patients with thrombus, the low SI on LGE is observed within the cavity adjacent to the wall of the myocardium (28).
III. Pitfalls
1. Bright ghosting artifacts can occur in areas within the field-of-view that have long T1 species (cerebrospinal fluid, pericardial or pleural effusion, and gastric fluid), poor electrocardiography gating, and poor breath- holding (29). Decreasing scan time (single shot technique), or increasing the average factor is helpful in reducing bright ghosting artifacts.
Fig. 10. Short-axis MR images demonstrate LGE pattern in various types of non-ischemic cardiomyopathy. There is mid- wall enhancement in basal, interventricular, septal wall of myocardium in patient with DCM (black arrows), epicardial enhancement in patient with sarcoidosis (white arrows), patchy enhancement at junction of both ventricles in patient with HCM (white arrows), and global subendocardial enhancement in patient with amyloidosis (white arrows). DCM = dilated cardiomyopathy
Fig. 11. Short-axis LGE image in 49-year-old man with exertional chest pain performed 5 days after primary percutaneous coronary intervention to left anterior descending artery. Full-thickness infarct within anterior and anteroseptal left ventricular mid-wall with microvascular obstruction (arrows) is shown as central hypo-enhanced region within avidly hyper-enhanced region of infarcted myocardium on LGE image.
2. On non-PSIR images, tissues with long T1 value may appear to be enhanced (30).
3. It can be difficult to discriminate no-reflow zones or LV thrombus from viable myocardium. Adding postcontrast cine imaging with LGE may be helpful in the evaluation.
4. If the contrast enhancement is reduced, interpretation of additional sequences may be required. The contrast between the infarcted myocardium, and blood in the inversion recovery image relies on variables such as blood velocity, dosage of contrast material, time from gadolinium administration, clearance rate of contrast media, and imaging parameters. The solution to these problems includes using multiple contrasts, such as T1 and T2, or using blood suppression techniques (31, 32).
Semi-Quantitative Assessment I. What-to-See
1. Semi-automated analyses that measure the LGE extent and/or “gray-zone” extent under the premise of subjective visual assessment that is still needed to identify poor nulling, no-reflow zones, artifacts, etc.
and to delineate endocardial and epicardial borders.
II. How-To
1. Several different methods of describing LGE extents are documented in the literature, including manual planimetry, the “n”-standard deviation (SD) technique, and full width at half maximum (FWHM) technique.
2. Manual planimetry: It is considered as a subjective technique, because all the measurements depend on a human decision.
A. Outline endocardial and epicardial borders.
B. Perform manual planimetry of the LGE in each short-axis slice.
C. Obtain a sum of LGE areas multiplied by slice thickness plus inter-slice gap, corresponding to the volume of scar/fibrosis.
D. Multiplying this total LGE area by the specific gravity of myocardium supplies the approximate LGE weight, and the ratio of LGE to normal myocardium can be calculated.
3. The “n”-SD technique: The rule of thumb is to select the reference myocardium and an appropriate threshold method that produces the results matched to “radiologist’s eye.”
A. Outline endocardial and epicardial borders to draw
the myocardial ROI.
B. Select a normal “remote” (dark) ROI in the myocardium for the reference SI (mean and SD).
C. The software will distinguish the areas within the myocardial ROI with a SI greater than a certain mean ± SD threshold, which is defined by the operator.
D. Select a threshold between the normal myocardium and the area of LGE.
1) The relative SNR between scar tissue and normal myocardium varies according to the type and dose of contrast agent, time after injection, type of sequence, field strength, and the underlying injury itself.
2) There is no fixed cut-off value. Recommended semi-automatic thresholding: n + 5 SD in infarction and n + 3 SD in myocarditis (33, 34) (Fig.
12).
3) The LGE area within the myocardium is determined automatically.
4) Automated thresholding may provide better reproducibility after appropriate standardization.
5) Manually modify to include no-reflow zones, except for artifacts and LV blood pool, which are caused by an error in drawing the endocardial contour.
6) It is receptive to spatial variations of the radio- frequency (RF) field, generated by the surface coil.
4. The FWHM technique: The rule of thumb is to appropriately determine both, the reference and LGE myocardium, so that the results match with those of the “radiologist’s eye.” The location and size of ROI for the reference and LGE myocardium can be adjusted to match the results with those of the “radiologist’s eye.”
A. Outline the endocardial and epicardial borders to draw the myocardial ROI.
B. Evaluate whether the LGE is present. If there is an LGE lesion, choose an ROI that contains the
“maximum” signal.
1) Threshold is set at half of the maximal SI within the scar.
2) The FWHM technique is less receptive to spatial variations of the RF field generated by the surface coil than the “n”-SD technique (35).
3) The FWHM technique is more reproducible compared to the “n”-SD technique (36, 37).
4) The accuracy of the FWHM technique may be reduced compared to the “n”-SD technique if LGE
is patchy or gray, because the technique presumes a bright LGE core.
C. Manually modify to include no-reflow zones except for artifacts and LV blood pool, which are caused by an error in drawing the endocardial contour.
T1-WEIGHTED IMAGING
Quantitative Assessment I. What-to-See
1. Native T1
A. ‘Native T1’ means tissue longitudinal relaxation time (T1) values, without using contrast agent (38).
B. T1 is affected by water (edema), proteins, and other T1-altering substances (lipid, iron) (39-42). T1 is sensitive to change of composition, and structure of myocardial tissue.
C. It may also be used with terms such as “native myocardial T1,” “pre-contrast T1,” or “non-contrast
T1.” “Native T1” or simply “T1” is used in this paper.
D. Native T1 mapping is one of the CMR techniques that provides a parametric map in which each pixel is encoded with a native T1 value (43).
2. Post-contrast T1
A. “Post-contrast T1” means tissue longitudinal relaxation time values with the use of a contrast agent.
B. Post-contrast T1 mapping is a CMR technique that provides a parametric map in which each pixel is encoded with a post-contrast T1 value (40).
3. Extracellular volume (ECV) fraction or myocardial ECV A. ECV reflects the fraction of the volume occupied by
extracellular space of heart tissues (38). It can be altered by diseases involving the myocardium.
B. Measurements of ECV are obtained by measuring the native and post-contrast T1 of the myocardium and blood.
C. Using the relationship between the fraction of plasma and the change in T1 relaxation rate of blood before and after contrast agent administration, the Fig. 12. “n”-SD technique for quantifying LGE extent. LGE image in 57-year-old man with chest pain shows subendocardial infarction at basal inferior wall of myocardium (arrows). Endocardial and epicardial borders are outlined and region of interest within remote dark myocardium as reference is drawn.
According to threshold between e n h a n c e d a n d u n e n h a n c e d myocardium selected, extent of LGE varies significantly as shown in these color maps. SD = standard deviation
change in T1 relaxation rate in myocardial tissue can be used to estimate ECV (44, 45). This can be expressed as follows:
ECV=(1-hematocrit)
1 - 1
Postcontrast T1 myocardium Native T1 myocardium
1 - 1
Postcontrast T1 blood Native T1 blood
D. ECV map can be formed by encoding the ECV value at each pixel (46).
E. ECV measures and predicts the space occupied by the extracellular matrix, which is also associated with the collagen volume fraction (47-49).
F. Unless there is infiltrative disease or myocardial edema, it is associated with myocardial fibrosis, and myocardial remodeling.
II. How-To 1. Preparation
A. Because normal values may vary due to various causes (sex/age, vendor, field strength, sequence contrast, etc.), normal values should be measured in advance on each MR equipment, with more than 10 healthy volunteers (38).
B. Hematocrit is essential for measuring ECV. A process that can perform the blood test near the time of CMR is needed. As a noninvasive test, the method of obtaining the synthetic ECV using the longitudinal relaxation rate of blood may be used; however,
further research is needed (50-52).
2. Visual check
A. T1 and ECV maps should be displayed with the appropriate color or grayscale, so that the difference from normal is clearly visible, and kept the same within the study.
B. It is necessary to check whether the slices obtained before and after contrast are matched with each other. An error may occur in ECV measurement if they do not match.
3. Measurement; drawing ROI
A. ROI should be drawn to minimize partial volume effects.
B. When drawing the ROI, a sufficient distance should be secured from the unclear tissue interface, such as between myocardium and blood.
C. It is necessary to decide whether to include LGE in the drawing area and record whether it is included in the reading. For example, patients with non-ischemic myocardial disease can be drawn to include non-ischemic LGE except for those considered as old infarction.
D. Measurement technique
1) Singular measurement: Either measure once in the septum or measure the total myocardium on the short axis and, then, find the mean value.
However, if the ROI does not match the pathologic lesion, the disease may be missed (Fig. 13).
2) The 16 segments approach: This measures the total myocardium. However, there can be
Fig. 13. T1 mapping images of 60-year-old woman with HCM.
After obtaining native T1 and post- contrast T1 values in myocardium and blood, values and HCT are inserted into ECV formula. HCM is usually characterized by high T1 value and high ECV. This patient also had high T1 value of 1419 ms and high ECV value of 32.7%.
ECV = extracellular volume; HCT = hematocrit
problems with off resonance or partial volume error (53) (Fig. 14).
T2-WEIGHTED IMAGING
Visual Assessment I. What-to-See
1. The aim is to detect the increased SI area, indicating increased free water content.
2. Indications are acute coronary syndromes, including myocardial infarction (Fig. 15), acute myocarditis (Fig.
16), sarcoidosis, tako-tsubo cardiomyopathy, and heart transplantation rejection.
3. Cleary-detectable high SI area following anatomical borders, and expected regional distribution pattern is suggestive of myocardial edema.
II. How-To
1. Identify appropriate images.
2. Modify image contrast and brightness to minimize SI in the background, and reduce maximal SI in the highest SI area, to remove the “over-shining” effect.
3. Check for artifacts, such as surface coil reception field inhomogeneity, low SI artifacts due to arrhythmia or myocardial motion, and high SI artifacts due to slow flowing blood, especially in dark-blood triple-inversion recovery spine echo (short tau inversion recovery, turbo inversion recovery magnitude) images.
Fig. 14. T1 mapping images of 43-year-old male with Fabry disease. After drawing endocardial contour and epicardial contour in native T1- and post T1 mapping images, T1 value and ECV are calculated. Fabry disease has special characteristics of low T1 value and normal ECV. This patient also had low T1 value of 1089.3 ms and normal ECV value of 23%.
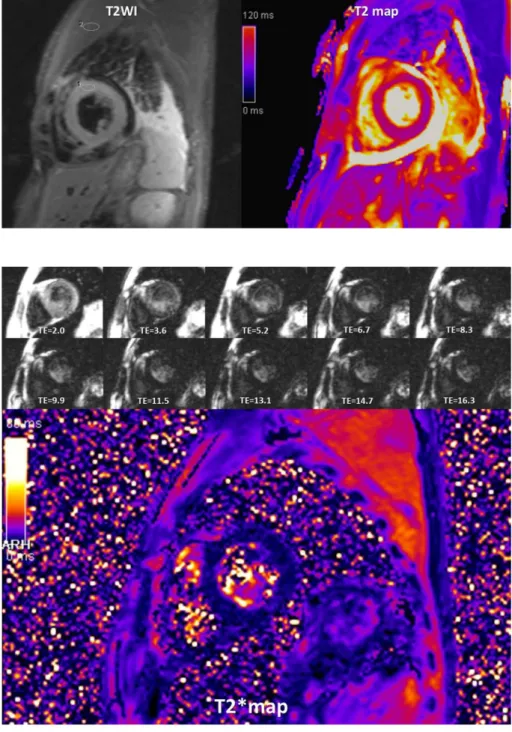
Fig. 15. Acute myocardial infarction in 51-year-old man with chest pain. Area of increased SI on T2WI was correlated with area of delayed enhancement on LGE image. T2WI = T2-weighted image
Semi-Quantitative Assessment I. What-to-See
1. It is a method of SI quantification with reference region that can reduce the impact of artifacts.
II. How-To
1. Draw the largest ROI for short-axis views in the serratus anterior muscle (global SI), and the ROI in the affected myocardial area (regional SI).
2. Divide the regional SI by global SI.
3. Cut-off value of SI ratio is 1.9 in dark-blood triple- inversion recovery spine echo images (54).
Quantitative Assessment I. What-to-See
1. It is a parametric map, in which each pixel is encoded with a T2 value.
Fig. 17. Beta-thalassemia in 35-year-old man. Substantial signal loss occurred at TE of 8.3 ms, and measured T2* value was 3.8 ms. TE
= echo time
Fig. 16. Acute myocarditis in 40-year-old man with fever.
Increased SI observed in global myocardium on T2WI, and SI ratio of myocardium to serratus anterior muscle was increased to 2.0.
II. How-To
1. Work flows are the same as T1 mapping.
T2* IMAGING
Quantitative Assessment I. What-to-See
1. The aim is to detect myocardial hemorrhage or iron deposition (Fig. 17).
2. If iron burden is increasing, rapid signal loss develops along with increasing echo time (TE).
II. How-To
1. Draw the ROI of the ventricular septum with avoidance of blood pool, and proximal blood vessels (full-thickness ROI).
2. Calculate mean myocardial SI from the ROI.
3. Check SI with changes of TE, and get a mono- exponential curve.
4. Truncate the curve by removing later TEs, to avoid underestimating T2* in patients with heavy iron overload (55).
5. Cut-off value of T2* at 1.5 tesla is 40 ms (56).
6. T2* < 20 ms indicates cardiac iron overload, and T2*
< 10 ms indicates increased risk of developing heart failure (57, 58).
7. T2* evaluation at 3 tesla is not recommended.
SAMPLE REPORT
These sample reports are written from examples of diseases that are often clinically encountered. Each report was written by committee members in consensus. These reports are just an example, not a guideline. It can be applied differently depending on the clinical situation of hospital, patients and diseases.
Example 1: HCM
History: 45-years-old, male, palpitation
Body weight, 73 kg; height, 180 cm; body surface area (BSA), 1.91 m2; hematocrit, 44.7%
Imaging protocol:
Scout, cine MRI (4-chamber, 2-chamber, left ventricular outflow tract [LVOT], and short-axis), delayed enhancement MRI (4-chamber, 2-chamber, and short-axis), T1 mapping
Fig. 18. Images for HCM sample report.
pre/post-contrast (short axis), and T2 mapping (short axis) on 3T MRI.
I. Imaging findings (Fig. 18)
1. Morphological evaluation on cine MRI
A. Thickening of LV myocardium at the anterior and anteroseptal wall of basal to mid cavity level B. Maximal thickness: 2.5 cm at the anteroseptum of
mid LV
C. No evidence of LVOT obstruction 2. Delayed enhancement
A. Ill-defined patchy delayed enhancement in hypertrophied segments
3. T1 mapping
A. Increased native T1 value (1273.7), and increased ECV fraction (31.6%) in thickened LV myocardium 4. Ventricular function on cine MRI
A. LV quantitative assessment
1) Papillary muscle as ventricular cavity
2) Ejection fraction (EF), 77.2%; end-diastolic volume (EDV), 124.9 mL (65.4 mL/m2*); end- systolic volume (ESV), 28.5 mL (14.9 mL/m2*);
stroke volume (SV), 96.4 mL *BSA indexed value
B. RV quantitative assessment 1) Short axis method
2) RV EF 67.1%, EDV 106.6 mL (55.8 mL/m2*), ESV 35.1 mL (18.4 mL/m2*), SV 71.5 mL
*BSA indexed value
Example 2: Ischemic Heart Disease History: 64-years-old, male
Body weight, 76 kg; height, 180 cm; BSA, 1.95 m2 Imaging protocol:
Scout, cine MRI (4-chamber, 2-chamber, LVOT, and short- axis), delayed enhancement MRI (4-chamber, 2-chamber, and short-axis) on 3T MRI
I. Imaging findings 1. Conclusion
A. Impaired LV global systolic function (EF, 45.9%) Normal LV cavity size (left ventricular end-diastolic
volume index, 79.1 mL/m2) B. Delayed enhancement (Fig. 19)
75-100% transmural infarct at LV mid anterior and septal wall, apical anterior, septal, and inferior wall, and apex
Associated with large amount of no reflow zone → suggesting acute myocardial infarction of left
anterior descending artery territory
C. Regional wall motion abnormality (+) - see findings D. Pericardial effusion
2. Findings
A. Delayed enhanced segments 01) Basal anterior (-) 02) Basal anteroseptal (-) 03) Basal inferoseptal (-) 04) Basal inferior (-) 05) Basal inferolateral (-) 06) Basal anterolateral (-)
07) Mid anterior (+): 100% transmurality, 4/4 of area 08) Mid anteroseptal (+): 100% transmurality, 4/4 of
area
09) Mid inferoseptal (+): 75% transmurality, 2/4 of area
10) Mid inferior (-) 11) Mid inferolateral (-) 12) Mid anterolateral (-)
13) Apical anterior (+): 75% transmurality, 4/4 of area
14) Apical septal (+): 75% transmurality, 4/4 of area 15) Apical inferior (+): 75% transmurality, 4/4 of
area
16) Apical lateral (+): 75% transmurality, 4/4 of area 17) Apex (+)
B. Motion (1, normokinesia; 2, hypokinesia; 3, akinesia;
4, dyskinesia; 5, aneurysm) 01) Basal anterior: 1 02) Basal anteroseptal: 1 03) Basal inferoseptal: 1 04) Basal inferior: 1 05) Basal inferolateral: 1 06) Basal anterolateral: 1 07) Mid anterior: 3 08) Mid anteroseptal: 3 09) Mid inferoseptal: 2 10) Mid inferior: 1 11) Mid inferolateral: 1 12) Mid anterolateral: 1 13) Apical anterior: 3 14) Apical septal: 3 15) Apical inferior: 3 16) Apical lateral: 2
17) Sum of cardiac motion index = 28
C. LV function measurement (absolute [normalized])
1) EF: 45.9%
2) EDV: 154.5 (79.1) mL 3) ESV: 83.6 (42.8) mL 4) SV: 70.9 (36.3) mL
5) Cardiac output: 5.18 (2.73) L/min 6) Average myocardial mass: 184.3 (94.4) g 7) BSA: 1.95 m2
8) Heart rate: 73 bpm
D. Forward volume/reverse volume/net forward volume (mL)
1) Ascending aorta: 61.31/1.77/59.54
2) Descending thoracic aorta (dTA): 43.36/1.09/
42.27
3) Superior vena cava (SVC): 25.05/2.31/22.74 4) dTA + SVC: 68.41/3.40/65.01
Notes
Conflicts of Interest Statement and Funding: This study was supported by the Guideline Development Fund of the Korean Society of Radiology and Korean Society of Cardiovascular Imaging.
This guideline has been published jointly with consent in the Cardiovascular Imaging Asia, Korean Journal of Radiology, and Investigative Magnetic Resonance Imaging.
Supplementary Movie Legends
Movie 1. Dark banding artifact on stress (a) and rest (b) perfusion images in an 18-year-old man.
Movie 2. Three-vessel disease in a 70-year-old man.
Fig. 19. Images for ischemic cardiomyopathy sample report.
Ring-like subendocardial perfusion defect is seen on stress (a) and disappears on rest images (b). Differentiation from microvascular disease may be challenging (Courtesy of Sung-A Chang, Samsung Medical Center).
Movie 3. Microvascular disease in a 73-year-old man who has 20-year history of diabetes mellitus on stress (a) and rest (b) images.
Movie 4. An inducible ischemia in a 52-year-old woman with septal-type HCM on stress (a, b) and rest (c, d) images.
Movie 5. An inducible ischemia and delayed perfusion in a 50-year-old man who underwent coronary bypass graft surgery on stress (a) and rest (b) images (Adapted from Kim et al. Korean J Radiol 2014;15:188-194 (8)).
REFERENCES
1. Coelho-Filho OR, Rickers C, Kwong RY, Jerosch-Herold M. MR myocardial perfusion imaging. Radiology 2013;266:701-715
2. Schulz-Menger J, Bluemke DA, Bremerich J, et al.
Standardized image interpretation and post processing in cardiovascular magnetic resonance: Society for Cardiovascular Magnetic Resonance (SCMR) board of trustees task force on standardized post processing. J Cardiovasc Magn Reson 2013;15:35
3. Min JY, Ko SM, Song IY, Yi JG, Hwang HK, Shin JK.
Comparison of the diagnostic accuracies of 1.5T and 3T stress myocardial perfusion cardiovascular magnetic resonance for detecting significant coronary artery disease.
Korean J Radiol 2018;19:1007-1020
4. Chung SY, Lee KY, Chun EJ, et al. Comparison of stress perfusion MRI and SPECT for detection of myocardial ischemia in patients with angiographically proven three- vessel coronary artery disease. AJR Am J Roentgenol 2010;195:356-362
5. Panting JR, Gatehouse PD, Yang GZ, et al. Abnormal subendocardial perfusion in cardiac syndrome X detected by cardiovascular magnetic resonance imaging. N Engl J Med 2002;346:1948-1953
6. Maron BJ, Wolfson JK, Epstein SE, Roberts WC. Intramural ("small vessel") coronary artery disease in hypertrophic cardiomyopathy. J Am Coll Cardiol 1986;8:545-557
7. Maron MS, Olivotto I, Maron BJ, et al. The case for myocardial ischemia in hypertrophic cardiomyopathy. J Am Coll Cardiol 2009;54:866-875
8. Kim YK, Park EA, Park SJ, et al. Non-ischemic perfusion defects due to delayed arrival of contrast material on stress perfusion cardiac magnetic resonance imaging after coronary artery bypass graft surgery. Korean J Radiol 2014;15:188-194
9. Tejani FH, Thompson RC, Kristy R, Bukofzer S. Effect of caffeine on SPECT myocardial perfusion imaging during regadenoson pharmacologic stress: a prospective, randomized, multicenter study. Int J Cardiovasc Imaging 2014;30:979-989
10. Kovacs D, Pivonka R, Khosla PG, Khosla S. Effect of caffeine on myocardial perfusion imaging using single photon emission computed tomography during adenosine pharmacologic stress. Am J Ther 2008;15:431-434
11. Jerosch-Herold M. Quantification of myocardial perfusion by cardiovascular magnetic resonance. J Cardiovasc Magn Reson 2010;12:57
12. Schwitter J, DeMarco T, Kneifel S, et al. Magnetic resonance-based assessment of global coronary flow and flow reserve and its relation to left ventricular functional parameters: a comparison with positron emission tomography. Circulation 2000;101:2696-2702
13. Kelle S, Graf K, Dreysse S, Schnackenburg B, Fleck E, Klein C.
Evaluation of contrast wash-in and peak enhancement in adenosine first pass perfusion CMR in patients post bypass surgery. J Cardiovasc Magn Reson 2010;12:28
14. Keelan PC, Bielak LF, Ashai K, et al. Long-term prognostic value of coronary calcification detected by electron-beam computed tomography in patients undergoing coronary angiography. Circulation 2001;104:412-417
15. Rieber J, Huber A, Erhard I, et al. Cardiac magnetic resonance perfusion imaging for the functional assessment of coronary artery disease: a comparison with coronary angiography and fractional flow reserve. Eur Heart J 2006;27:1465-1471
16. Kroll K, Wilke N, Jerosch-Herold M, et al. Modeling regional myocardial flows from residue functions of an intravascular indicator. Am J Physiol 1996;271:H1643-1655
17. Jerosch-Herold M, Swingen C, Seethamraju RT. Myocardial blood flow quantification with MRI by model-independent deconvolution. Med Phys 2002;29:886-897
18. Ishida M, Schuster A, Morton G, et al. Development of a universal dual-bolus injection scheme for the quantitative assessment of myocardial perfusion cardiovascular magnetic resonance. J Cardiovasc Magn Reson 2011;13:28 19. Christian TF, Aletras AH, Arai AE. Estimation of absolute
myocardial blood flow during first-pass MR perfusion imaging using a dual-bolus injection technique:
comparison to single-bolus injection method. J Magn Reson Imaging 2008;27:1271-1277
20. Gatehouse PD, Elkington AG, Ablitt NA, Yang GZ, Pennell DJ, Firmin DN. Accurate assessment of the arterial input function during high-dose myocardial perfusion cardiovascular magnetic resonance. J Magn Reson Imaging 2004;20:39-45
21. Jerosch-Herold M, Wilke N, Wang Y, et al. Direct comparison of an intravascular and an extracellular contrast agent for quantification of myocardial perfusion.
Cardiac MRI Group. Int J Card Imaging 1999;15:453-464 22. Kim RJ, Shah DJ, Judd RM. How we perform delayed
enhancement imaging. J Cardiovasc Magn Reson 2003;5:505-514
23. Mahrholdt H, Wagner A, Judd RM, Sechtem U, Kim RJ.
Delayed enhancement cardiovascular magnetic resonance assessment of non-ischaemic cardiomyopathies. Eur Heart J 2005;26:1461-1474
24. Lee JW, Jeong YJ, Lee G, et al. Predictive value of cardiac magnetic resonance imaging-derived myocardial strain for poor outcomes in patients with acute myocarditis. Korean J Radiol 2017;18:643-654
25. Kim RJ, Wu E, Rafael A, et al. The use of contrast-enhanced magnetic resonance imaging to identify reversible myocardial dysfunction. N Engl J Med 2000;343:1445- 1453
26. Klem I, Heitner JF, Shah DJ, et al. Improved detection of coronary artery disease by stress perfusion cardiovascular magnetic resonance with the use of delayed enhancement infarction imaging. J Am Coll Cardiol 2006;47:1630-1638 27. Abbas A, Matthews GH, Brown IW, Shambrook JS, Peebles
CR, Harden SP. Cardiac MR assessment of microvascular obstruction. Br J Radiol 2015;88:20140470
28. Rajiah P, Desai MY, Kwon D, Flamm SD. MR imaging of myocardial infarction. Radiographics 2013;33:1383-1412 29. Saremi F, Grizzard JD, Kim RJ. Optimizing cardiac MR
imaging: practical remedies for artifacts. Radiographics 2008;28:1161-1187
30. Kellman P, Arai AE, McVeigh ER, Aletras AH. Phase-sensitive inversion recovery for detecting myocardial infarction using gadolinium-delayed hyperenhancement. Magn Reson Med 2002;47:372-383
31. Kellman P, Arai AE. Cardiac imaging techniques for physicians: late enhancement. J Magn Reson Imaging 2012;36:529-542
32. Farrelly C, Rehwald W, Salerno M, et al. Improved detection of subendocardial hyperenhancement in myocardial infarction using dark blood-pool delayed enhancement MRI. AJR Am J Roentgenol 2011;196:339-348
33. Bondarenko O, Beek AM, Hofman MB, et al. Standardizing the definition of hyperenhancement in the quantitative assessment of infarct size and myocardial viability using
delayed contrast-enhanced CMR. J Cardiovasc Magn Reson 2005;7:481-485
34. Lim J, Park EA, Song YS, Lee W. Single-dose gadoterate meglumine for 3T late gadolinium enhancement mri for the assessment of chronic myocardial infarction: intra- individual comparison with conventional double-dose 1.5T MRI. Korean J Radiol 2018;19:372-380
35. Amado LC, Gerber BL, Gupta SN, et al. Accurate and objective infarct sizing by contrast-enhanced magnetic resonance imaging in a canine myocardial infarction model. J Am Coll Cardiol 2004;44:2383-2389
36. Flett AS, Hasleton J, Cook C, et al. Evaluation of techniques for the quantification of myocardial scar of differing etiology using cardiac magnetic resonance. JACC Cardiovasc Imaging 2011;4:150-156
37. Aljaroudi WA, Flamm SD, Saliba W, Wilkoff BL, Kwon D.
Role of CMR imaging in risk stratification for sudden cardiac death. JACC Cardiovasc Imaging 2013;6:392-406 38. Moon JC, Messroghli DR, Kellman P, et al. Myocardial T1
mapping and extracellular volume quantification: a Society for Cardiovascular Magnetic Resonance (SCMR) and CMR Working Group of the European Society of Cardiology consensus statement. J Cardiovasc Magn Reson 2013;15:92 39. Ugander M, Bagi PS, Oki AJ, et al. Myocardial edema as
detected by pre-contrast T1 and T2 CMR delineates area at risk associated with acute myocardial infarction. JACC Cardiovasc Imaging 2012;5:596-603
40. Karamitsos TD, Piechnik SK, Banypersad SM, et al.
Noncontrast T1 mapping for the diagnosis of cardiac amyloidosis. JACC Cardiovasc Imaging 2013;6:488-497 41. Sado DM, White SK, Piechnik SK, et al. Identification and
assessment of Anderson-Fabry disease by cardiovascular magnetic resonance noncontrast myocardial T1 mapping.
Circ Cardiovasc Imaging 2013;6:392-398
42. Pedersen SF, Thrysøe SA, Robich MP, et al. Assessment of intramyocardial hemorrhage by T1-weighted cardiovascular magnetic resonance in reperfused acute myocardial infarction. J Cardiovasc Magn Reson 2012;14:59
43. Messroghli DR, Radjenovic A, Kozerke S, Higgins DM, Sivananthan MU, Ridgway JP. Modified Look-Locker inversion recovery (MOLLI) for high-resolution T1 mapping of the heart. Magn Reson Med 2004;52:141-146
44. Arheden H, Saeed M, Higgins CB, et al. Measurement of the distribution volume of gadopentetate dimeglumine at echo-planar MR imaging to quantify myocardial infarction:
comparison with 99mTc-DTPA autoradiography in rats.
Radiology 1999;211:698-708
45. Taylor AJ, Salerno M, Dharmakumar R, Jerosch-Herold M.
T1 mapping: basic techniques and clinical applications.
JACC Cardiovasc Imaging 2016;9:67-81
46. Kellman P, Wilson JR, Xue H, Ugander M, Arai AE.
Extracellular volume fraction mapping in the myocardium, part 1: evaluation of an automated method. J Cardiovasc Magn Reson 2012;14:63
47. Miller CA, Naish JH, Bishop P, et al. Comprehensive validation of cardiovascular magnetic resonance techniques for the assessment of myocardial extracellular volume. Circ Cardiovasc Imaging 2013;6:373-383
48. Chen Y, Zheng X, Jin H, et al. Role of myocardial extracellular volume fraction measured with magnetic resonance imaging in the prediction of left ventricular functional outcome after revascularization of chronic total occlusion of coronary arteries. Korean J Radiol 2019;20:83- 93
49. Lee HG, Shim J, Choi JI, Kim YH, Oh YW, Hwang SH. Use of cardiac computed tomography and magnetic resonance imaging in case management of atrial fibrillation with catheter ablation. Korean J Radiol 2019;20:695-708 50. Treibel TA, Fontana M, Maestrini V, et al. Automatic
measurement of the myocardial interstitium: synthetic extracellular volume quantification without hematocrit sampling. JACC Cardiovasc Imaging 2016;9:54-63
51. Shang Y, Zhang X, Zhou X, Wang J. Extracellular volume fraction measurements derived from the longitudinal relaxation of blood-based synthetic hematocrit may lead to clinical errors in 3 T cardiovascular magnetic resonance.
J Cardiovasc Magn Reson 2018;20:56
52. Kammerlander AA, Duca F, Binder C, et al. Extracellular volume quantification by cardiac magnetic resonance imaging without hematocrit sampling: ready for prime time? Wien Klin Wochenschr 2018;130:190-196
53. Robson MD, Piechnik SK, Tunnicliffe EM, Neubauer S. T1 measurements in the human myocardium: the effects of magnetization transfer on the SASHA and MOLLI sequences. Magn Reson Med 2013;70:664-670
54. Friedrich MG, Sechtem U, Schulz-Menger J, et al.
Cardiovascular magnetic resonance in myocarditis: a JACC white paper. J Am Coll Cardiol 2009;53:1475-1487
55. He T, Gatehouse PD, Smith GC, Mohiaddin RH, Pennell DJ, Firmin DN. Myocardial T2* measurements in iron- overloaded thalassemia: an in vivo study to investigate optimal methods of quantification. Magn Reson Med 2008;60:1082-1089
56. Anderson LJ, Holden S, Davis B, et al. Cardiovascular T2- star (T2*) magnetic resonance for the early diagnosis of myocardial iron overload. Eur Heart J 2001;22:2171-2179 57. Carpenter JP, He T, Kirk P, et al. On T2* magnetic resonance
and cardiac iron. Circulation 2011;123:1519-1528
58. Kirk P, Roughton M, Porter JB, et al. Cardiac T2* magnetic resonance for prediction of cardiac complications in thalassemia major. Circulation 2009;120:1961-1968