D I A B E T E S & M E T A B O L I S M J O U R N A L
This is an Open Access article distributed under the terms of the Creative Commons At- tribution Non-Commercial License (http://creativecommons.org/licenses/by-nc/3.0/) which permits unrestricted non-commercial use, distribution, and reproduction in any medium, provided the original work is properly cited.
Predictive Clinical Parameters and Glycemic Efficacy of Vildagliptin Treatment in Korean Subjects with Type 2 Diabetes
Jin-Sun Chang, Juyoung Shin, Hun-Sung Kim, Kyung-Hee Kim, Jeong-Ah Shin, Kun-Ho Yoon, Bong-Yun Cha, Ho-Young Son, Jae-Hyoung Cho
Division of Endocrinology and Metabolism, Department of Internal Medicine, Seoul St. Mary’s Hospital, The Catholic University of Korea College of Medicine, Seoul, Korea
Background: The aims of this study are to investigate the glycemic efficacy and predictive parameters of vildagliptin therapy in Korean subjects with type 2 diabetes.
Methods: In this retrospective study, we retrieved data for subjects who were on twice-daily 50 mg vildagliptin for at least 6 months, and classified the subjects into five treatment groups. In three of the groups, we added vildagliptin to their existing medication regi- men; in the other two groups, we replaced one of their existing medications with vildagliptin. We then analyzed the changes in glu- cose parameters and clinical characteristics.
Results: Ultimately, 327 subjects were analyzed in this study. Vildagliptin significantly improved hemoglobin A1c (HbA1c) levels over 6 months. The changes in HbA1c levels (ΔHbA1c) at month 6 were -2.24% (P=0.000), -0.77% (P=0.000), -0.80% (P=0.001), -0.61% (P=0.000), and -0.34% (P=0.025) for groups 1, 2, 3, 4, and 5, respectively, with significance. We also found significant decrements in fasting plasma glucose levels in groups 1, 2, 3, and 4 (P<0.05). Of the variables, initial HbA1c levels (P=0.032) and history of sulfonylurea use (P=0.026) were independently associated with responsiveness to vildagliptin treatment.
Conclusion: Vildagliptin was effective when it was used in subjects with poor glycemic control. It controlled fasting plasma glu- cose levels as well as sulfonylurea treatment in Korean type 2 diabetic subjects.
Keywords: Diabetes mellitus; Dipeptidyl peptidase 4; Dipeptidyl peptidase 4 inhibitor; Vildagliptin
Corresponding author: Jae-Hyoung Cho
Division of Endocrinology and Metabolism, Department of Internal Medicine, Seoul St. Mary’s Hospital, The Catholic University of Korea College of Medicine, 222 Banpo-daero, Seocho-gu, Seoul 137-701, Korea
E-mail: [email protected]
Co-Corresponding author: Ho-Young Son
INTRODUCTION
Recent studies have explored the incidence of complications in diabetic populations and emphasized the need for strict glucose control to reduce the incidence of these complications [1,2]. However, tight glycemic control is associated with hypo- glycemic events and is an especially big burden in patients with type 2 diabetes mellitus (T2DM) who are at risk for car- diovascular disease [2]. Although many patients with T2DM require treatment with a combination of oral hypoglycemic
agents to achieve the goal of glycemic control, clinicians must consider choosing a hypoglycemic agent in individual patients carefully, and should be aware of the complex pathophysiolog- ical defects associated with diabetes.
Vildagliptin is an orally administered dipeptidyl peptidase-4 (DPP-4) inhibitor that increases active glucagon-like peptide-1 (GLP-1) by inactivating the DPP-4 enzyme. Vildagliptin im- proves glycemic control in type 2 diabetic subjects by increas- ing both α- and β-cell sensitivity to glucose [3-6] and decreas- es the risk of weight gain and hypoglycemia. Because the vilda- http://dx.doi.org/10.4093/dmj.2013.37.1.72
pISSN 2233-6079 · eISSN 2233-6087
gliptin/DPP-4 interaction has slow kinetics, vildagliptin con- tinues to raise intact incretin levels beyond detectable plasma drug levels [7]. A regimen of 50 mg twice daily increases intact GLP-1 fasting plasma levels by more than 2-fold [4]. The eleva- tion of intact GLP-1 plasma levels in patients on vildagliptin treatment can have several favorable metabolic effects. There are many randomized controlled clinical trials that showed the efficacy of vildagliptin [8-10] and compared it to other oral an- tidiabetic drugs. Vildagliptin is effective when used as an add- on to metformin [11-13], thiazolidinediones [14,15], sulfonyl- ureas [16], and insulin [17,18]. However, only a few studies have shown the efficacy of vildagliptin in Asian type 2 diabetic subjects [19-21]. Here, we address not only the efficacy of vilda- gliptin, but also the factors affecting the effectiveness of vilda- gliptin in real practice with type 2 diabetic subjects in Korea.
METHODS
Subjects
In this retrospective study, we recruited subjects with T2DM who were initially prescribed vildagliptin in Seoul St. Mary’s Hospital between August 2009 and February 2011. Subjects aged 18 to 85 years were included. Subjects either had a history of using 1 or 2 oral hypoglycemic agents, including metfor-
min, with a stable dosage for more than 3 months, or had nev- er used any antidiabetic medications. Subjects who had taken vildagliptin for less than 6 months, or combined with insulin during the observational period, were excluded from the anal- ysis. We also excluded subjects who had received drugs that may affect blood glucose status during the study period, such as systemic glucocorticoids, or who had a serious medical ill- ness, such as liver cirrhosis, end-stage renal disease, or any kind of cancer.
Assessments
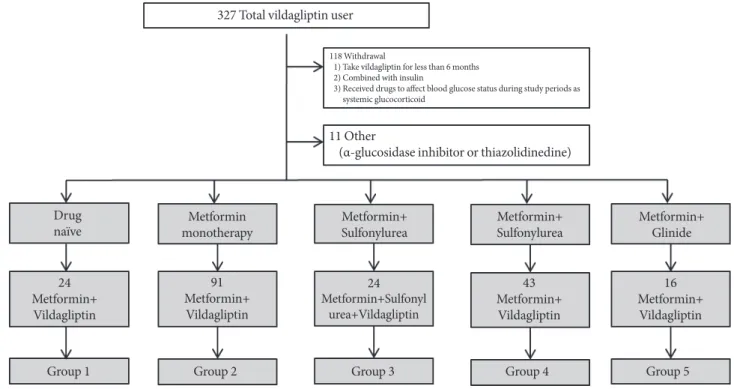
Based on previous medication use, the subjects were divided into the following five treatment groups: group 1, drug naïve subjects treated with a combination of metformin and vilda- gliptin; group 2, vildagliptin added to existing metformin treat- ment; group 3, vildagliptin added to existing metformin and sulfonylurea treatment; group 4, sulfonylurea replaced with vildagliptin in existing metformin and sulfonylurea treated group; and group 5, glinide replaced with vildagliptin in exist- ing metformin and glinide treated group (Fig. 1). We have thus called groups 1, 2, and 3 “add-on” vildagliptin groups (since vildagliptin was added to their treatment), and groups 4 and 5
“switch-over” vildagliptin groups (since these subjects were switched to vildagliptin from sulfonylurea or glinide treat-
Fig. 1. Subject profiles.
327 Total vildagliptin user
Drugnaïve
Group 1 Group 2 Group 3 Group 4 Group 5
Metformin+ 24 Vildagliptin
Metformin+ 91 Vildagliptin
Metformin monotherapy
Metformin+Sulfonyl24 urea+Vildagliptin
Metformin+
Sulfonylurea Metformin+
Sulfonylurea Metformin+
Glinide
Metformin+ 43 Vildagl iptin
Metformin+ 16 Vildagl iptin 11 Other
(α-glucosidase inhibitor or thiazolidinedine)
118 Withdrawal
1) Take vildagliptin for less than 6 months 2) Combined with insulin
3) Received drugs to affect blood glucose status during study periods as systemic glucocorticoid
ment). The following parameters were recorded and analyzed:
anthropometric parameters at baseline for each group; changes in prescription dosage of metformin and other oral hypoglyce- mic agents at baseline and after 6 months; and changes in glu- cose parameters (fasting plasma glucose [FPG], postprandial glucose [PPG], and hemoglobin A1c [HbA1c]) at baseline and after 6 months. To examine the characteristics that affect re- sponse to vildagliptin administration, we defined nonre- sponders as subjects who did not achieve an HbA1c reduction
from baseline after 6 months of treatment. We calculated body mass index (BMI) as weight/height2 (in kilograms per square meter). Total cholesterol, high density lipoprotein cholesterol, triglyceride, and low density lipoprotein cholesterol levels were measured by an enzymatic method using the 7150 Autoanalyz- er (Hitachi Ltd., Tokyo, Japan), and insulin and C-peptide were determined by radioimmunoassay. Insulin resistance (IR) was assessed using the homeostasis model assessment (HOMA) formula [HOMA-IR (mg/dL×μU/mL)=fasting glucose (mg/
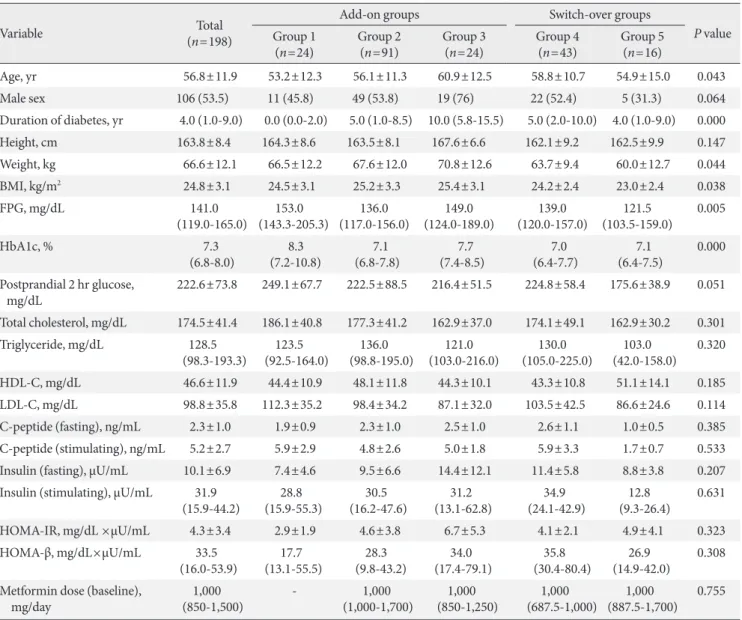
Table 1. Baseline characteristics of the subjects
Variable Total
(n=198)
Add-on groups Switch-over groups
P value Group 1
(n=24) Group 2
(n=91) Group 3
(n=24) Group 4
(n=43) Group 5
(n=16)
Age, yr 56.8±11.9 53.2±12.3 56.1±11.3 60.9±12.5 58.8±10.7 54.9±15.0 0.043
Male sex 106 (53.5) 11 (45.8) 49 (53.8) 19 (76) 22 (52.4) 5 (31.3) 0.064
Duration of diabetes, yr 4.0 (1.0-9.0) 0.0 (0.0-2.0) 5.0 (1.0-8.5) 10.0 (5.8-15.5) 5.0 (2.0-10.0) 4.0 (1.0-9.0) 0.000
Height, cm 163.8±8.4 164.3±8.6 163.5±8.1 167.6±6.6 162.1±9.2 162.5±9.9 0.147
Weight, kg 66.6±12.1 66.5±12.2 67.6±12.0 70.8±12.6 63.7±9.4 60.0±12.7 0.044
BMI, kg/m2 24.8±3.1 24.5±3.1 25.2±3.3 25.4±3.1 24.2±2.4 23.0±2.4 0.038
FPG, mg/dL 141.0
(119.0-165.0) 153.0
(143.3-205.3) 136.0
(117.0-156.0) 149.0
(124.0-189.0) 139.0
(120.0-157.0) 121.5
(103.5-159.0) 0.005 HbA1c, % 7.3
(6.8-8.0) 8.3
(7.2-10.8) 7.1
(6.8-7.8) 7.7
(7.4-8.5) 7.0
(6.4-7.7) 7.1
(6.4-7.5) 0.000 P ostprandial 2 hr glucose,
mg/dL 222.6±73.8 249.1±67.7 222.5±88.5 216.4±51.5 224.8±58.4 175.6±38.9 0.051
Total cholesterol, mg/dL 174.5±41.4 186.1±40.8 177.3±41.2 162.9±37.0 174.1±49.1 162.9±30.2 0.301 Triglyceride, mg/dL 128.5
(98.3-193.3) 123.5
(92.5-164.0) 136.0
(98.8-195.0) 121.0
(103.0-216.0) 130.0
(105.0-225.0) 103.0
(42.0-158.0) 0.320
HDL-C, mg/dL 46.6±11.9 44.4±10.9 48.1±11.8 44.3±10.1 43.3±10.8 51.1±14.1 0.185
LDL-C, mg/dL 98.8±35.8 112.3±35.2 98.4±34.2 87.1±32.0 103.5±42.5 86.6±24.6 0.114
C-peptide (fasting), ng/mL 2.3±1.0 1.9±0.9 2.3±1.0 2.5±1.0 2.6±1.1 1.0±0.5 0.385
C-peptide (stimulating), ng/mL 5.2±2.7 5.9±2.9 4.8±2.6 5.0±1.8 5.9±3.3 1.7±0.7 0.533
Insulin (fasting), μU/mL 10.1±6.9 7.4±4.6 9.5±6.6 14.4±12.1 11.4±5.8 8.8±3.8 0.207
Insulin (stimulating), μU/mL 31.9
(15.9-44.2) 28.8
(15.9-55.3) 30.5
(16.2-47.6) 31.2
(13.1-62.8) 34.9
(24.1-42.9) 12.8
(9.3-26.4) 0.631
HOMA-IR, mg/dL ×μU/mL 4.3±3.4 2.9±1.9 4.6±3.8 6.7±5.3 4.1±2.1 4.9±4.1 0.323
HOMA-β, mg/dL×μU/mL 33.5
(16.0-53.9) 17.7
(13.1-55.5) 28.3
(9.8-43.2) 34.0
(17.4-79.1) 35.8
(30.4-80.4) 26.9
(14.9-42.0) 0.308 M etformin dose (baseline),
mg/day 1,000
(850-1,500) - 1,000
(1,000-1,700) 1,000
(850-1,250) 1,000
(687.5-1,000) 1,000
(887.5-1,700) 0.755 Values are presented as mean±standard deviation or number (%). Duration of diabetes, FPG, HbA1c, triglyceride, insulin (stimulating), HOMA-β, and metformin dose are presented as median (interquartile range).
BMI, body mass index; FPG, fasting plasma glucose; HbA1c, hemoglobin A1c; HDL-C, high density lipoprotein cholesterol; LDL-C, low den- sity lipoprotein cholesterol; HOMA-IR, homeostasis model assessment of insulin resistance; HOMA-β, homeostasis model assessment of β-cell function.
dL)×fasting insulin (μU/mL)/405] and β-cell function was as- sessed using the HOMA-β formula [HOMA-β (%)=fasting in- sulin (μU/mL)×360/fasting glucose (mg/dL)-63].
Statistical analysis
All statistical analyses were performed with PASW statistics software version 18.0 (SPSS Inc., Chicago, IL, USA). We per- formed the Kolmogorov-Smirnov test to determine whether the data were normally distributed. Continuous variables with normal distribution were expressed as mean±standard devia- tion, or as medians (interquartile range [IQR]) if they were not normally distributed. Discrete variables were expressed as per- centages. Wilcoxon signed rank tests were used to compare values before and after vildagliptin use. For more than three groups, analysis was performed using the Kruskall-Wallis test.
Statistical comparisons between groups with responder and nonresponders were performed using the Mann-Whitney U test and chi-square test, which is nonparametric statistical method. Spearman’s correlation coefficient (a nonparametric correlation analysis) was used to determine the relationships between glycemic efficacy and the continuous variables. Mul- tivariate logistic regression analysis was used to estimate mul- tiple correlations between predictive parameters of vildagliptin efficacy and clinical and laboratory variables. Data with a P value of less than 0.05 were considered significant.
RESULTS
Baseline clinical characteristics of subjects
We reviewed 327 subjects with diabetes who visited Seoul St.
Mary’s Hospital between August 2009 and February 2011. Fig.
1 shows subjects’ profile. We did not evaluate a group of sub- jects who took an α-glucosidase inhibitor or a thiazolidinedi- one because of the small sample size (n=11) and excluded subjects with a short duration of administration of vildagliptin or those using insulin (n=118). Of the 198 type 2 diabetic sub- jects, 106 were men and 92 were women. Table 1 summarizes the baseline characteristics of the subjects by group. The mean age of the subjects was 56.8±11.9 years and the median dura- tion was 4.0 (IQR, 1.0 to 9.0) years. Group 3 had an especially long duration (median duration, 10.0 years; IQR, 5.8 to 15.5 years). The mean BMI of all subjects was 24.8±3.1 kg/m2. At baseline, the median HbA1c level was 7.3% (IQR, 6.8% to 8.0%), the median FPG level was 141.0 mg/dL (IQR, 119.0 to 165.0 mg/dL), and the mean postprandial 2-hour blood glu-
cose (PP2) level was 222.6±73.8 mg/dL.
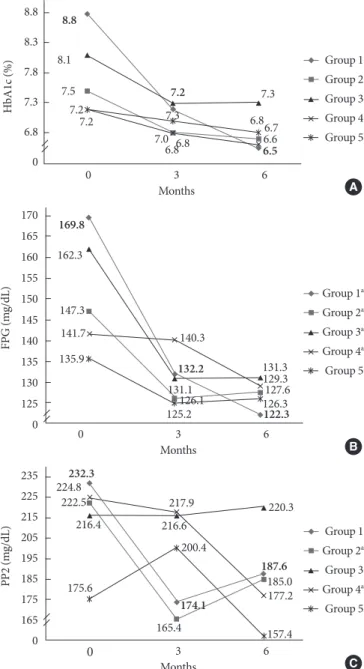
Effect of vildagliptin on plasma glucose and HbA1c levels Fig. 2 displays mean changes from baseline to 6 months in HbA1c, FPG, and PPG levels. After 6 months, the mean change from baseline for HbA1c was -2.24% (P=0.000) for group 1, -0.77% (P=0.000) for group 2, -0.80% (P=0.001) for group 3, -0.61% (P=0.000) for group 4, and -0.34% (P=0.025) for group
Fig. 2. Mean change from baseline in (A) hemoglobin A1c (HbA1c), (B) fasting plasma glucose (FPG), and (C) postpran- dial glucose 2 hours (PP2) values by group. (A) All at 6 month:
P<0.05. (B, C) At 6 month: aP<0.05.
A Group 1 Group 2 Group 3 Group 4 Group 5
0 3
Months
7.3 7.3
7.2
6.8 6.86.8
6.66.7 6.5 7.27.2
7.0 7.5
8.1 8.8
6
HbA1c (%)
8.8 8.3 7.8 7.3 6.8 0
B Group 1a Group 2a Group 3a Group 4a Group 5
0 3
Months
131.3 122.3 125.2
135.9 141.7 147.3 162.3 169.8
132.2 140.3
126.3127.6 129.3
6
FPG (mg/dL)
170 165 160 155 150 145 140 135 130 125 0
131.1 126.1
C Group 1 Group 2a Group 3 Group 4a Group 5
0 3
Months
187.6 232.3
174.1
220.3
185.0 177.2 157.4 165.4
175.6 216.4 222.5 224.8
200.4 216.6
217.9
6
PP2 (mg/dL)
235 225 215 205 195 185 175 165 0
5. There were significant decrements in FPG levels in group 1, group 2, group 3, and group 4 (-48.4 mg/dL, P=0.000 in group 1; -18.9 mg/dL, P=0.000 in group 2; -33.1 mg/dL, P=0.002 in group 3; -11.6 mg/dL, P=0.020 in group 4). There were also decrements in FPG levels in group 5; however, they were not significant (P=0.629) because of the small number of subjects in this group. PP2 levels in groups 2 and 4 decreased signifi- cantly compared to those of groups 1, 3, and 5 (-49.9 mg/dL, P=0.110 in group 1; -31.5 mg/dL, P=0.013 in group 2; -14.2 mg/dL, P=0.570 in group 3; -44.7 mg/dL, P=0.005 in group 4;
and -5.4 mg/dL, P=0.611 in group 5).
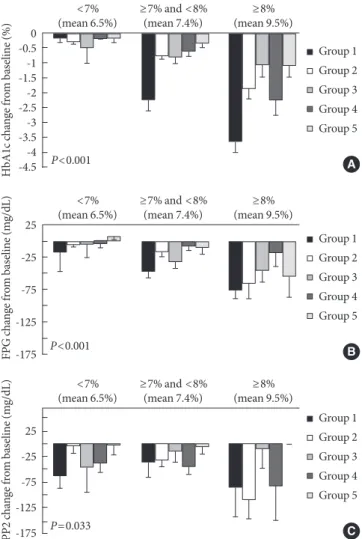
Fig. 3. Mean changes (SEM) from baseline in hemoglobin A1c (HbA1c), fasting plasma glucose (FPG), and postprandial glu- cose 2 hours (PP2) values according to baseline HbA1c sub- group were significant. (A) Change in HbA1c level according to baseline HbA1c level. (B) Changes in FPG level according to baseline HbA1c level. (C) Changes in PP2 level according to baseline HbA1c level.
A Group 1 Group 2 Group 3 Group 4 Group 5
<7%
(mean 6.5%)
P<0.001
≥7% and <8%
(mean 7.4%) ≥8%
(mean 9.5%)
HbA1c change from baseline (%)
-0.50 -1.5-1 -2.5-2 -3.5-3 -4.5-4
B Group 1 Group 2 Group 3 Group 4 Group 5
<7%
(mean 6.5%)
P<0.001
≥7% and <8%
(mean 7.4%) ≥8%
(mean 9.5%)
FPG change from baseline (mg/dL)
25 -25 -75 -125 -175
C Group 1 Group 2 Group 3 Group 4 Group 5
<7%
(mean 6.5%)
P=0.033
≥7% and <8%
(mean 7.4%) ≥8%
(mean 9.5%)
PP2 change from baseline (mg/dL)
25 -25 -75 -125 -175
Table 2. Characteristics of responders and nonresponders to vildagliptin (n=154)
Characteristic Responder
(n=123) Nonresponder (n=31) P value
Male sex 67 (54.47) 18 (58.06) 0.719
Age, yr 56.46±12.20 58.55±9.79 0.435
DM duration, yr 6.70±6.69 7.37±6.70 0.384
BMI, kg/m2 25.07±3.20 24.43±2.74 0.314
C-peptide, ng/mL 2.38±1.08 2.37±0.63 0.656 Fasting insulin, μIU/mL 10.47±7.67 13.04±6.40 0.115
FPG, mg/dL 152.11±51.00 133±25.03 0.071
HbA1c, % 7.68±1.18 7.03±0.67 0.004
HOMA-β, mg/dL×μU/mL 42.71±35.83 57.75±39.14 0.284 HOMA-IR, mg/dL×μU/mL 5.41±4.05 3.77±1.88 0.509 SU user 42 (34.17) 16 (51.61) 0.076 Values are presented as number (%) or mean±standard deviation.
DM, diabetes mellitus; BMI, body mass index; FPG, fasting plasma glucose; HbA1c, hemoglobin A1c; HOMA-β, homeostasis model as- sessment of β-cell function; HOMA-IR, homeostasis model assess- ment of insulin resistance; SU, sulfonylurea.
Predictive clinical characteristics of the vildagliptin response group
We performed a subgroup analysis to determine the character- istics influencing the response to drug administration accord- ing to baseline HbA1c level. Greater reductions in HbA1c levels from baseline were observed in a subgroup with initial HbA1c levels of more than 8% (mean HbA1c level, 9.5±1.3%) in all subjects (P<0.001). In addition, FPG increased from baseline according to increases in the initial HbA1c level in all groups (P<0.001) and PP2 increased from baseline according to in- creases in the initial HbA1c level (P=0.007) (Fig. 3). Cases where lower HbA1c levels were detected after 24 weeks of vildagliptin administration were classified as vildagliptin re- sponders. Subjects who did not show any reduction in HbA1c level were classified as nonresponders. In this analysis, we ex- cluded group 1 as their significant hyperglycemic status could disturb the results. Among the 154 subjects eligible for this analysis, 123 (79.9%) were classified as responders. Biochemi- cal and clinical factors that affected response to vildagliptin were evaluated between the response group and the nonre- sponder group. As shown in Table 2, we carried out the Mann- Whitney U test and chi-square test for several factors (sex, age, diabetes mellitus duration, BMI, C-peptide, fasting insu- lin, FPG, HbA1c, HOMA-IR, and HOMA-β values, and sulfo-
nylurea use) to evaluate the characteristics of responders to vildagliptin treatment. We found that HbA1c levels differed significantly between the responders and nonresponders. We used logistic regression analysis to identify the independent factor affecting the glucose lowering effect of vildagliptin.
HbA1c level at baseline and history of sulfonylurea use were factors that correlated with responsiveness to vildagliptin treatment upon logistic regression analysis (P=0.032 and P=
0.026) (Table 3).
DISCUSSION
Only limited data are available on T2DM patients treated with vildagliptin in Asia [22], especially in actual clinical practice.
In the present study, we analyzed data for 198 type 2 diabetes patients who were administered vildagliptin and evaluated the factors influencing their response to vildagliptin administra- tion. The subjects were divided into groups based on treat- ment regimens and their data were retrospectively reviewed.
Vildagliptin was shown to decrease mean HbA1c levels by 0.9% (P<0.001). A decrement in PPG levels was also observed, as expected; indeed, the decrements in FPG levels were signifi- cant and somewhat dominant. Overall reductions in FPG lev- els in all groups were noticeable. Although results on the effi- cacy of vildagliptin treatment were recently published [23,24], we did not expect more exceptional reductions in FPG levels than reductions in PPG levels at the start of vildagliptin ad- ministration. In a recent study, vildagliptin decreased FPG levels [24]; its effect was inferior to that of thiazolidinediones,
metformin, and sulfonylureas, and this observation may be at- tributed to the specific activities of vildagliptin on postprandi- al sugars, such as acarbose and glinides. However, in this study, even though decrements in PPG levels were insignificant in the group that received a combination treatment with sulfo- nylureas and in the drug-naïve group, decrements in FPG and HbA1c levels were significant. The pharmacokinetics of vilda- gliptin differs from that of sitagliptin. Even though the time to reach peak serum concentration and the half-life of vilda- gliptin are short, the duration of DPP-4 inhibition is long last- ing, owing to the powerful interaction of vildagliptin with DPP-4. Vildagliptin inhibits DPP-4 activity by more than 80%
for 15.5 hours postdose, and increases active GLP-1 levels [25]. It has also been shown that less fluctuation in glucose concentrations occurs with vildagliptin treatment than with sitagliptin treatment, when using a continuous glucose-moni- toring system [26]. This finding could also support the phar- macokinetic characteristics of vildagliptin. Vildagliptin im- proves β-cell function, augments plasma insulin levels and reduces plasma glucagon concentrations, and decreases over- night plasma glucose levels, which are correlated with a signif- icant reduction in endogenous glucose production [27].
In terms of our retrospective study method, it has both strengths and limitations, and we would like to see it comple- mented by further study. The present retrospective observa- tional design covered a wide range of subject populations and data on the use of vildagliptin in real clinical practice. Prospec- tive randomized trials, however, have strengths in statistical significance and reliance on data [28]. The vildagliptin-treated subjects were not randomized, and the endocrinologists’ pref- erences and ideas affected who was treated with vildagliptin and when, which reflects real clinical practice. We analyzed the predictive parameters of vildagliptin treatment, and found that the factors correlated with the efficacy of vildagliptin were baseline HbA1c and history of sulfonylurea use (Table 3). From the results of studies in animal models, it is generally accepted that DPP-4 inhibitors are more beneficial in subjects with shorter disease duration [29,30]. Vildagliptin is an efficacious add-on therapy to insulin in subjects with renal impairment and long-standing T2DM [17,31,32]. In a recent study, the im- pact of T2DM duration, insulin resistance, duration of metfor- min use, and BMI on the efficacy of vildagliptin with metfor- min treatment was evaluated. That study showed that vilda- gliptin with metformin treatment was effectual independent of these factors [33]. When considering an add-on therapy to Table 3. Logistic regression analysis for predictive parameters
of clinical efficacy of vildaglipitin as dependent variables and its component as independent variables
OR 95% CI P value
Age 0.967 0.893-1.046 0.404
Sex 0.891 0.208-3.810 0.876
DM duration 0.843 0.300-2.367 0.746
BMI 0.800 0.602-1.063 0.123
HbA1c 0.176 0.036-0.862 0.032
FPG 1.015 0.984-1.046 0.350
SU user 0.143 0.026-0.789 0.026
Adjusted for age, sex, DM duration.
OR, odds ratio; CI, confidence interval; DM, diabetes mellitus; BMI, body mass index; HbA1c, hemoglobin A1c; FPG, fasting plasma glu- cose; SU, sulfonylurea.
metformin or the initiation of combination therapy, vilda- gliptin can be chosen, regardless of diabetic duration, BMI, and insulin resistance.
This study has several limitations. First, because of the sin- gle university hospital and retrospective nature of the study, the impacts and powers of the results may be weakened. We did not assess the potential benefits or side effects, including weight change and hypoglycemic events, in detail in this retro- spective study. Second, because of the inclusion criteria and classification, the number of eligible participants in each group was small. Third, because this was not a randomized and con- trolled study, some confounders may have influenced the re- sults. We found that the doctors tended to increase the dose of metformin when they prescribed vildagliptin. In our analyses, the increase in metformin dose was approximately 100 mg/
day (initial dose, 1,124.4±442.5 mg/day; dose 6 months later, 1,234.0±436.5 mg/day). In a previous study, there was no sig- nificant difference in the percentage of glycated hemoglobin, despite a 13% increase in metformin daily dose in type 2 dia- betes subjects [34]. In another study in Japan, the efficacy of metformin monotherapy at 500 and 750 mg/day was com- pared, and no significant differences in HbA1c and FPG levels were found 6 months later [35]. Therefore, we postulate that the change in metformin dose in the current study was not a definite confounder. Also, the response level after vildagliptin treatment could be different for each underlying management condition. However, we confirmed that there were no signifi- cant correlations between response to vildagliptin and under- lying management conditions (P=0.057). Finally, the preser- vation of pancreatic β-cell function with vildagliptin adminis- tration could not be confirmed clinically because fasting insu- lin levels were not usually measured after administration of vildagliptin. We can presume that vildagliptin could preserve β-cell function by reducing insulin resistance owing to reduced lipotoxicity [4,36].
In conclusion, vildagliptin was efficacious for glycemic con- trol, especially for lowering FPG and HbA1c levels, in drug naïve diabetes subjects where it was combined with metfor- min treatment, where it was added to existing metformin or sulfonylurea treatment, and where it replaced sulfonylureas.
The glucose-lowering effect of vildagliptin was independent of T2DM duration, BMI, and insulin resistance. However, well- designed, prospective, and long-term studies need to be per- formed to obtain relevant information on the use of vildagliptin in clinical practice.
CONFLICTS OF INTEREST
No potential conflict of interest relevant to this article was re- ported.
REFERENCES
1. Holman RR, Paul SK, Bethel MA, Matthews DR, Neil HA. 10- year follow-up of intensive glucose control in type 2 diabetes.
N Engl J Med 2008;359:1577-89.
2. ADVANCE Collaborative Group, Patel A, MacMahon S, Chal- mers J, Neal B, Billot L, Woodward M, Marre M, Cooper M, Glasziou P, Grobbee D, Hamet P, Harrap S, Heller S, Liu L, Mancia G, Mogensen CE, Pan C, Poulter N, Rodgers A, Wil- liams B, Bompoint S, de Galan BE, Joshi R, Travert F. Intensive blood glucose control and vascular outcomes in patients with type 2 diabetes. N Engl J Med 2008;358:2560-72.
3. Rosenstock J, Foley JE, Rendell M, Landin-Olsson M, Holst JJ, Deacon CF, Rochotte E, Baron MA. Effects of the dipeptidyl peptidase-IV inhibitor vildagliptin on incretin hormones, islet function, and postprandial glycemia in subjects with impaired glucose tolerance. Diabetes Care 2008;31:30-5.
4. Azuma K, Radikova Z, Mancino J, Toledo FG, Thomas E, Kan- gani C, Dalla Man C, Cobelli C, Holst JJ, Deacon CF, He Y, Ligueros-Saylan M, Serra D, Foley JE, Kelley DE. Measure- ments of islet function and glucose metabolism with the dipep- tidyl peptidase 4 inhibitor vildagliptin in patients with type 2 diabetes. J Clin Endocrinol Metab 2008;93:459-64.
5. D’Alessio DA, Denney AM, Hermiller LM, Prigeon RL, Mar- tin JM, Tharp WG, Saylan ML, He Y, Dunning BE, Foley JE, Pratley RE. Treatment with the dipeptidyl peptidase-4 inhibi- tor vildagliptin improves fasting islet-cell function in subjects with type 2 diabetes. J Clin Endocrinol Metab 2009;94:81-8.
6. Ahren B, Schweizer A, Dejager S, Dunning BE, Nilsson PM, Persson M, Foley JE. Vildagliptin enhances islet responsive- ness to both hyper- and hypoglycemia in patients with type 2 diabetes. J Clin Endocrinol Metab 2009;94:1236-43.
7. He YL, Serra D, Wang Y, Campestrini J, Riviere GJ, Deacon CF, Holst JJ, Schwartz S, Nielsen JC, Ligueros-Saylan M. Phar- macokinetics and pharmacodynamics of vildagliptin in pa- tients with type 2 diabetes mellitus. Clin Pharmacokinet 2007;
46:577-88.
8. Dejager S, Razac S, Foley JE, Schweizer A. Vildagliptin in drug- naive patients with type 2 diabetes: a 24-week, double-blind, randomized, placebo-controlled, multiple-dose study. Horm
Metab Res 2007;39:218-23.
9. Pi-Sunyer FX, Schweizer A, Mills D, Dejager S. Efficacy and tolerability of vildagliptin monotherapy in drug-naive patients with type 2 diabetes. Diabetes Res Clin Pract 2007;76:132-8.
10. Schweizer A, Couturier A, Foley JE, Dejager S. Comparison between vildagliptin and metformin to sustain reductions in HbA(1c) over 1 year in drug-naive patients with type 2 diabe- tes. Diabet Med 2007;24:955-61.
11. Bosi E, Camisasca RP, Collober C, Rochotte E, Garber AJ. Ef- fects of vildagliptin on glucose control over 24 weeks in pa- tients with type 2 diabetes inadequately controlled with met- formin. Diabetes Care 2007;30:890-5.
12. Blonde L, Dagogo-Jack S, Banerji MA, Pratley RE, Marcellari A, Braceras R, Purkayastha D, Baron M. Comparison of vilda- gliptin and thiazolidinedione as add-on therapy in patients in- adequately controlled with metformin: results of the GALIANT trial: a primary care, type 2 diabetes study. Diabetes Obes Metab 2009;11:978-86.
13. Bolli G, Dotta F, Rochotte E, Cohen SE. Efficacy and tolerabili- ty of vildagliptin vs. pioglitazone when added to metformin:
a 24-week, randomized, double-blind study. Diabetes Obes Metab 2008;10:82-90.
14. Garber AJ, Schweizer A, Baron MA, Rochotte E, Dejager S.
Vildagliptin in combination with pioglitazone improves gly- caemic control in patients with type 2 diabetes failing thiazoli- dinedione monotherapy: a randomized, placebo-controlled study. Diabetes Obes Metab 2007;9:166-74.
15. Rosenstock J, Kim SW, Baron MA, Camisasca RP, Cressier F, Couturier A, Dejager S. Efficacy and tolerability of initial com- bination therapy with vildagliptin and pioglitazone compared with component monotherapy in patients with type 2 diabetes.
Diabetes Obes Metab 2007;9:175-85.
16. Garber AJ, Foley JE, Banerji MA, Ebeling P, Gudbjornsdottir S, Camisasca RP, Couturier A, Baron MA. Effects of vildagliptin on glucose control in patients with type 2 diabetes inadequate- ly controlled with a sulphonylurea. Diabetes Obes Metab 2008;
10:1047-56.
17. Fonseca V, Schweizer A, Albrecht D, Baron MA, Chang I, De- jager S. Addition of vildagliptin to insulin improves glycaemic control in type 2 diabetes. Diabetologia 2007;50:1148-55.
18. Fonseca V, Baron M, Shao Q, Dejager S. Sustained efficacy and reduced hypoglycemia during one year of treatment with vildagliptin added to insulin in patients with type 2 diabetes mellitus. Horm Metab Res 2008;40:427-30.
19. Kikuchi M, Abe N, Kato M, Terao S, Mimori N, Tachibana H.
Vildagliptin dose-dependently improves glycemic control in Japanese patients with type 2 diabetes mellitus. Diabetes Res Clin Pract 2009;83:233-40.
20. Iwamoto Y, Kashiwagi A, Yamada N, Terao S, Mimori N, Su- zuki M, Tachibana H. Efficacy and safety of vildagliptin and voglibose in Japanese patients with type 2 diabetes: a 12-week, randomized, double-blind, active-controlled study. Diabetes Obes Metab 2010;12:700-8.
21. Kikuchi M, Haneda M, Koya D, Tobe K, Onishi Y, Couturier A, Mimori N, Inaba Y, Goodman M. Efficacy and tolerability of vildagliptin as an add-on to glimepiride in Japanese patients with type 2 diabetes mellitus. Diabetes Res Clin Pract 2010;89:
216-23.
22. Pan C, Xing X, Han P, Zheng S, Ma J, Liu J, Lv X, Lu J, Bader G;
Institution Investigators. Efficacy and tolerability of vilda- gliptin as add-on therapy to metformin in Chinese patients with type 2 diabetes mellitus. Diabetes Obes Metab 2012;14:
737-44.
23. Jeon HJ, Oh TK. Comparison of vildagliptin-metformin and glimepiride-metformin treatments in type 2 diabetic patients.
Diabetes Metab J 2011;35:529-35.
24. Cai L, Cai Y, Lu ZJ, Zhang Y, Liu P. The efficacy and safety of vildagliptin in patients with type 2 diabetes: a meta-analysis of randomized clinical trials. J Clin Pharm Ther 2012;37:386-98.
25. He YL, Valencia J, Zhang Y, Schwartz SL, Ligueros-Saylan M, Foley J, Dole WP. Hormonal and metabolic effects of morning or evening dosing of the dipeptidyl peptidase IV inhibitor vil- dagliptin in patients with type 2 diabetes. Br J Clin Pharmacol 2010;70:34-42.
26. Marfella R, Barbieri M, Grella R, Rizzo MR, Nicoletti GF, Paolis- so G. Effects of vildagliptin twice daily vs. sitagliptin once daily on 24-hour acute glucose fluctuations. J Diabetes Complications 2010;24:79-83.
27. Balas B, Baig MR, Watson C, Dunning BE, Ligueros-Saylan M, Wang Y, He YL, Darland C, Holst JJ, Deacon CF, Cusi K, Mari A, Foley JE, DeFronzo RA. The dipeptidyl peptidase IV inhibi- tor vildagliptin suppresses endogenous glucose production and enhances islet function after single-dose administration in type 2 diabetic patients. J Clin Endocrinol Metab 2007;92:
1249-55.
28. Lee YH, Lee BW, Kwon HJ, Kang ES, Cha BS, Lee HC. Higher morning to evening ratio in total dose of twice-daily biphasic insulin analog might be effective in achieving glucose control in patients with poorly controlled type 2 diabetes. Diabetes Technol Ther 2012;14:508-14.
29. Perfetti R, Hui H. The role of GLP-1 in the life and death of pancreatic beta cells. Horm Metab Res 2004;36:804-10.
30. Duttaroy A, Voelker F, Merriam K, Zhang X, Ren X, Subrama- nian K, Hughes TE, Burkey BF. The DPP-4 inhibitor vilda- gliptin increases pancreatic beta cell mass in neonatal rats. Eur J Pharmacol 2011;650:703-7.
31. Lukashevich V, Schweizer A, Shao Q, Groop PH, Kothny W.
Safety and efficacy of vildagliptin versus placebo in patients with type 2 diabetes and moderate or severe renal impairment:
a prospective 24-week randomized placebo-controlled trial.
Diabetes Obes Metab 2011;13:947-54.
32. Dejager S, Schweizer A. Incretin therapies in the management of patients with type 2 diabetes mellitus and renal impairment.
Hosp Pract (Minneap) 2012;40:7-21.
33. Schweizer A, Dejager S, Foley JE. Impact of insulin resistance,
body mass index, disease duration, and duration of metformin use on the efficacy of vildagliptin. Diabetes Ther 2012;3:8.
34. Menzies DG, Campbell IW, McBain A, Brown IR. Metformin efficacy and tolerance in obese non-insulin dependent diabet- ics: a comparison of two dosage schedules. Curr Med Res Opin 1989;11:273-8.
35. Ito H, Ohno Y, Yamauchi T, Kawabata Y, Ikegami H. Efficacy and safety of metformin for treatment of type 2 diabetes in el- derly Japanese patients. Geriatr Gerontol Int 2011;11:55-62.
36. Boschmann M, Engeli S, Dobberstein K, Budziarek P, Strauss A, Boehnke J, Sweep FC, Luft FC, He Y, Foley JE, Jordan J. Di- peptidyl-peptidase-IV inhibition augments postprandial lipid mobilization and oxidation in type 2 diabetic patients. J Clin Endocrinol Metab 2009;94:846-52.