INTRODUCTION
Education and nurture have been postulated to affect devel- opment of brain structures in the human.1 In 1960, Krech et al.2 found that an enriched environment during development potentiates the growth of total brain weight and cortical thick- ness. Cellular-level analyses of the cerebral cortices of cats showed that development in an enriched environment in- creases cortical synapse-to-neuron ratios,3 numerical densities of neurons, and sizes of neuronal nuclei.4,5 Whether the bene-
fits of environmental enrichment during development have lifelong effects was an open question. In 1988, Katzman et al.6 introduced the cognitive reserve theory to explain the poor correlation between the neuropathological deficit and clinical severity of Alzheimer’s disease (AD). AD patients with higher premorbid educational levels showed more severe neuro- pathologic changes than those with lower premorbid educa- tional levels, even though the two groups were able to main- tain the same clinical status.7 In other words, greater brain damage was required to reduce educated patients to the same level of function as uneducated patients. This theory was sup- ported by the finding that years of education influenced the relation between senile plaques and level of cognitive func- tion.8 The increased prevalence of late-onset AD7-9 and rapid memory decline10,11 in people with less education are further
Effect of Illiteracy on Cognition and Cerebral Morphology in Later Life
Oh Dae Kwon,1 Uicheul Yoon,2 Duk L. Na3
1Department of Neurology, School of Medicine, Catholic University of Daegu, Daegu, Korea
2Department of Biomedical Engineering, Catholic University of Daegu, Daegu, Korea
3Department of Neurology, Sungkyunkwan University School of Medicine, Seoul, Korea
Background and Purpose A better developmental environment has positive effects on brain development. The acquisition of literacy during childhood may affect brain functional organization. The present study aimed to evaluate the effects of illiteracy on neuropsychological test results and cerebral morphology in later life.
Methods We recruited 7 illiterate elderly farmers who had never attended school and had no reading or writing knowledge. These subjects were compared with 9 literate subjects in terms of neuropsychological performance and brain volume. All subjects were over 65-years-old and had the same regional and occupational background.
Results Neuropsychological tests indicated that the performance of the illiterate subjects was worse than that of literate subjects in all cog- nitive domains except forward digit span, tool-use and tool-free gestures, verbal word recognition, and verbal generation of animals and gro- cery items. The illiterate group also showed significantly decreased cortical volume and surface area in both parietal lobes. However, the illit- erate group showed increased cortical thickness in the left cuneus.
Conclusions Literacy acquired in childhood may increase the volume of the parietal lobe and improve neuropsychological performance through the process of brain plasticity. The effects can be lifelong.
Key Words learning, cognition, magnetic resonance imaging, voxel-based morphometry.
Received: September 10, 2015 Revised: December 19, 2015 Accepted: December 19, 2015
Correspondence: Oh Dae Kwon, MD, PhD, Department of Neurology, School of Medicine, Catholic University of Daegu, 33 Duryugongwon-ro 17-gil, Nam- gu, Daegu 42472, Korea
Tel: +82-53-650-4298, Fax: +82-53-654-9786, E-mail: [email protected]
cc This is an Open Access article distributed under the terms of the Cre- ative Commons Attribution Non-Commercial License (http://creative- commons.org/licenses/by-nc/3.0) which permits unrestricted non-com- mercial use, distribution, and reproduction in any medium, provided the ori- ginal work is properly cited.
DND
ORIGINAL ARTICLE
Oh Dae Kwon et al.
Brain Volume of Illiterate versus Literate
evidence for the theory.
The cognitive reserve theory is based on findings concern- ing neuropsychological and pathological changes in patients with dementia. However, there are only a few computed to- mography and magnetic resonance imaging (MRI) studies re- vealing effects of education in cognitively normal persons.
One of these studies found that during sustained attention the metabolic rates of the cortical areas: bilateral lingual, left poste- rior cingulate gyri, and left precuneus, are related to education- al level.12 Coffey et al.13 revealed a significant independent ef- fect of education on sulcal cerebrospinal fluid volume, a marker of cortical atrophy in normal aging.
We hypothesize that neural structure and function in people of lower educational attainments are different from those of more highly educated people. In accordance with that theory, we have previously performed a study using fluoro-deoxyglu- cose positron emission tomography (PET), which showed that illiterate subjects have cerebral hypometabolism relative to lit- erate subjects in many cerebral areas, predominantly frontal lobe and cerebellum.14 Because we found cerebral functional differences between educational levels,14 we then searched for structural differences between the brains of literate and illiter- ate persons. We hypothesized that illiterate subjects will have a smaller brain volume and thinner cerebral cortex in all lobes when compared with literate individuals, which might explain the observed lower performance in neuropsychological tests.
To our knowledge, no previous studies have addressed this issue and the relative predictive value of brain volume data compared with neuropsychological tests is not known. For this purpose, we compared the results of neuropsychological tests and calculated cerebral cortical volumes and cortical thick- nesses, using MRI volumetry, between normally functioning elderly illiterate and literate individuals.
METHODS
Subjects
We recruited 7 illiterate and 9 literate subjects, aged 65 and over as of January 2008. All subjects were raised in Goryung County in the southern part of South Korea and had lived as farmers throughout their lives. All were right-handed. Subjects were classified as illiterate if they had never received formal public or private education in reading and writing and also lacked an informal knowledge of reading or writing, including the inability to read or write their own names. These partici- pants had remained illiterate for cultural reasons. In contrast, the literate participants had more than 6 years of public educa- tion. All of the literate subjects could read and write their names and addresses, as well as read newspapers and books.
Subjects were classified as cognitively normal on the basis of extensive neurological and neuropsychological test interviews.
We excluded subjects with neurological or psychiatric illnesses, low visual or auditory acuity, motor weakness, severe systemic illnesses, or lack of motivation. We also excluded secondary causes of cognitive decline with the aid of extensive laboratory tests including complete blood count, thyroid function tests, se- rum electrolytes, liver function tests, renal function tests, serum calcium, fasting blood sugar, syphilis serology, lipid battery, electrocardiography and chest X-ray. In addition, subjects with cerebral infarction, brain tumor, demyelinating disease, or oth- er significant pathological findings in brain MRI were excluded.
The demographic characteristics of the 16 subjects are shown in Table 1. This study was approved by the Institutional Review Board of Daegu Catholic University Medical Center. Informed consent was obtained from all subjects.
Neuropsychological tests
We performed a standardized neuropsychological battery, the Seoul Neuropsychological Screening Battery,15 on all sub- jects. The battery contains tests for attention, language, praxis, four elements of Gerstmann syndrome, visuoconstructive function, verbal and visual memory, and frontal/executive function. Among these tests, the components that could be scored were: digit span (forward and backward); the Korean version of the Boston Naming Test; written calculations (three problems each in addition, subtraction, multiplication, and di- vision; one point for each correct answer); the Rey-Osterrieth Complex Figure Test, comprising copying, immediate and 20-minute delayed recall as well as recognition; the Seoul Ver- bal Learning Test (SVLT), comprising three learning-free re- call trials of 12 words, a 20-minute delayed recall trial for these
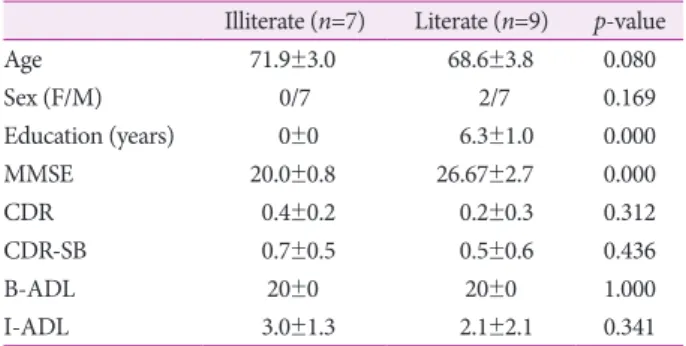
Table 1. Demographic and general clinical characteristics of illit- erate and literate elderly participants
Illiterate (n=7) Literate (n=9) p-value
Age 71.9±3.0 68.6±3.8 0.080
Sex (F/M) 0/7 2/7 0.169
Education (years) 0±0 6.3±1.0 0.000
MMSE 20.0±0.8 26.67±2.7 0.000
CDR 0.4±0.2 0.2±0.3 0.312
CDR-SB 0.7±0.5 0.5±0.6 0.436
B-ADL 20±0 20±0 1.000
I-ADL 3.0±1.3 2.1±2.1 0.341
Values are mean±SD. p-values are obtained using independent t-tests and Pearson’s chi-square test for continuous and categorical variables.
B-ADL: Barthel activities of daily living, CDR: Clinical Dementia Rat- ing, CDR-SB: Clinical Dementia Rating-Sum of Boxes, I-ADL: Instru- mental activities of daily living, MMSE: Mini-Mental Status Examina- tion.
DND
12 items, and a recognition test; the phonemic and semantic Controlled Oral Word Association Test (COWAT); the Stroop Test, comprising word and color reading of 112 items in two minutes; and the Barthel-activities of daily living (ADL), on which only a perfect score was considered normal. The instru- mental ADL was also done, using a cut-off point of less than 8.16 The Stroop test was not applied to the illiterate group due to their inability to read.
Brain MRI
MRI data were obtained on a 1.5-T system (MR Excite; GE Medical Systems, Milwaukee, WI, USA). A three-dimensional T1-weighted, spoiled gradient-recalled echo of the whole head, designed to optimally discriminate between brain tissues (echo time=min Full, flip angle=20 degrees, 224 contiguous slices, matrix size=224×320, 1.07×0.75×1.00 mm3 voxels), was ac- quired. To ensure high quality, all of the raw data underwent a series of visual quality control checks that included the level of intensity homogeneity within/between slices, the amount of movement artifact, and the amount of geometric distortion.17 Native MR images were normalized into a standardized ste- reotaxic space using a linear transformation and corrected for intensity nonuniformity.18,19 The registered and corrected vol- umes were classified into white mater, gray matter, cerebrospi- nal fluid, and background using an advanced neural-net clas- sifier.20 The hemispheric surfaces of the inner and outer cortex, which consisted of 40962 vertices, were automatically extracted using the Constrained Laplacian-Based Automated Segmenta- tion with Proximities algorithm.21 Then we employed an itera- tive surface registration algorithm with an unbiased iterative group template showing enhanced anatomic detail to ensure be- tween-individual correspondence at each vertex of the cortical surface model.22 For regional analysis, automatic lobar parcel- lation, which had been validated and performed efficiently in previous studies, was applied for dividing individual cortical surfaces into frontal, temporal, parietal, and occipital lobes.23,24 The surface-based parcellation was performed using CIVET pipeline (http://www.bic.mni.mcgill.ca/ServicesSoftware/CIV- ET).
Cortical volume
Extracted inner and outer cortical surfaces in native space were masked to original images. We isolated the voxels of the cerebral cortex that were located between two surfaces. The cortical volume was calculated by measuring the volume of the voxels in the whole cortex and in each lobar region.
Cortical surface area
Cortical surface area, a number which suggests the overall
degree of folding, was measured.25-27 The middle cortical sur- face lies at the geometric midpoint between the inner and out- er cortical surfaces. It provides a relatively unbiased represen- tation of sulcal versus gyral regions. In contrast, the inner cortical surface model over-represents gyral regions.28 We used the middle cortical surface to calculate the surface area of the whole cortex and of each lobar region, which was the straight- forward sum of the areas of the triangles making up the sur- face model.
Cortical thickness
The inner and outer surfaces had the same number of verti- ces, and there was a close correspondence between the coun- terpart vertices of the inner and outer surfaces. Cortical thick- ness was defined as the Euclidean distance between these linked vertices.29 We measured the averaged value of the thick- ness in the whole cortex and in each lobar region.
Gyrification index measurement and cortical complexity The middle cortical surface was divided into sulcal and gyral regions by thresholding the depth map, i.e., the three-dimen- sional Euclidean distance from each vertex to the nearest voxel on the convex hull volume.23,30 The threshold of the depth map was determined from the fact that the human cerebral cortex is a highly folded sheet with 60–70% of its surface area buried within folds.31,32 The mean gyrification index was defined as the ratio between the total surface area and the superficially exposed surface area, the latter being the gyral regions in each hemisphere and lobe.33 Cortical complexity reflects the frequen- cy of sulcal and gyral convolutions, which was calculated from a spherical surface mesh deformed hierarchically onto the cor- tex. The surface inflation technique was applied to the middle cortical surface, and then the rate of decreasing cortical areas with increasing inflation frequency (n=2–256) was estimated as the complexity by least-squares fitting of a linear model.34 Intuitively, a complexity value larger than 2 indicates an in- crease in the cortical surface detail and cortical folding degree.
Statistical methods and analyses
For group analysis, independent t-test (Mann-Whitney U test) and Pearson’s chi-square test for continuous and categori- cal variables were used to identify differences between the illit- erate and literate groups (Table 1 and 2).
The mean value for cortical thickness obtained from each vertex in native space was calculated to provide a map of aver- age cortical thickness across the hemisphere. Localized region- al differences in cortical thickness between illiterate and literate subjects was analyzed using an independent two-sample t-test (Table 3). The statistical analysis of regional cortical thickness
Oh Dae Kwon et al.
Brain Volume of Illiterate versus Literate
was performed on each vertex and a statistical map of differ- ences in cortical thickness between illiterate and literate sub- jects was constructed on a surface model. There were 40962 vertices in the cortical surface model in all vertex-wise analy- ses, so a control for the false-positive rate for multiple compar- isons was included. Correction for multiple comparisons was performed using the false discovery rate calculation at a q-val- ue of 0.05.35 Corrected probability values (p<0.05) from these tests were mapped directly onto the cortical surface template, providing maps of local thickness differences between groups.
The statistical significance of group differences in lobar mea- sures such as cortical volume, cortical thickness, surface area, gyrification index, and complexity was assessed with t-tests.
SPSS for Windows version 19.0 (SPSS Inc., Chicago, IL, USA) was used for all statistical analyses and p-values<0.05 were re- garded as statistically significant.
RESULTS
Neuropsychological tests
Table 1 presents the general cognitive indices and Table 2 summarizes the results of detailed neuropsychological testing.
The mean Mini-Mental Status Examination score of the illiter- ate group was lower than that of the literate group. In contrast, the mean global Clinical Dementia Rating score of the illiterate group did not show significant differences compared with that of literate group. The physical ADL scores were perfect in both groups and the instrumental ADL did not show significant dif- ferences between the two groups (Table 1). Illiterate subjects scored lower in most cognitive domains compared with edu- cated subjects. Specifically, although no difference was noted in forward digit span (p=0.067), illiterate subjects were poorer at backward digit span (p=0.020). They also had lower scores than literate subjects in the Boston naming test (p=0.006), calcula-
Table 2. Results of neuropsychological tests of illiterate and literate participants
Neuropsychological tests (maximum possible score) Illiterate (n) Literate (n) p-value
Attention Digit span
Forward 4.0±1.0 (7) 5.0±1.0 (9) 0.067
Backward 1.4±1.5 (7) 3.2±0.7 (9) 0.020
Language & related disorders
K-BNT (60) 24.1±7.6 (7) 37.1±8.1 (9) 0.006
Calculation (12) 3.1±2.7 (7) 8.6±2.4 (9) 0.001
Ideomotor limb apraxia (5) 4.6±0.8 (7) 4.6±0.7 (9) 0.967
SVLT
Sum of three free recall (36) 14.4±3.6 (7) 21.6±3.4 (9) 0.001
Delayed recall (12) 4.1±1.1 (7) 7.1±2.8 (9) 0.013
Recognition* 7.9±2.7 (7) 9.7±1.7 (9) 0.123
Visuospatial function
RCFT (36) 7.3±3.2 (7) 27.1±2.5 (9) 0.000
RCFT
Immediate recall (36) 3.8±1.7 (7) 9.8±5.1 (9) 0.008
Delayed recall (36) 3.3±1.3 (7) 10.0±4.6 (9) 0.005
Recognition* 2.7±1.5 (7) 7.3±1.7 (9) 0.000
Frontal/executive function COWAT
Semantic: animal items 11.4±3.8 (7) 13.6±2.7 (9) 0.215
Semantic: supermarket items 11.4±5.2 (7) 15.0±6.2 (9) 0.240
Phonemic: sum of three letters 3.8±5.5 (7) 19.2±5.6 (9) 0.000
Stroop test
Letter reading (112) Unavailable 109.9±4.0 (9) Unavailable
Color reading (112) Unavailable 76.3±22.0 (9) Unavailable
Values shown are mean±SD.
*True positive-false positive, p-values are obtained using independent t-tests (Mann-Whitney U test).
COWAT: Controlled Oral Word Association Test, K-BNT: Korean version of the Boston Naming Test, n: number of participants available for analysis, RCFT: Rey-Osterrieth Complex Figure Test, SVLT: Seoul Verbal Learning Test.
DND
tions (p=0.001), the Rey figure copy test (p=0.000), free recall (p=0.008), delayed recall (p=0.005), and the recognition test (p=0.000). The SVLT test of free recall (p=0.001) and delayed recall (p=0.013), and the phonemic COWAT (p=0.000) also showed lower scores in the illiterate subjects (Table 2). There was no significant difference in tool-use and tool-free gestures.
Regional tissue volume
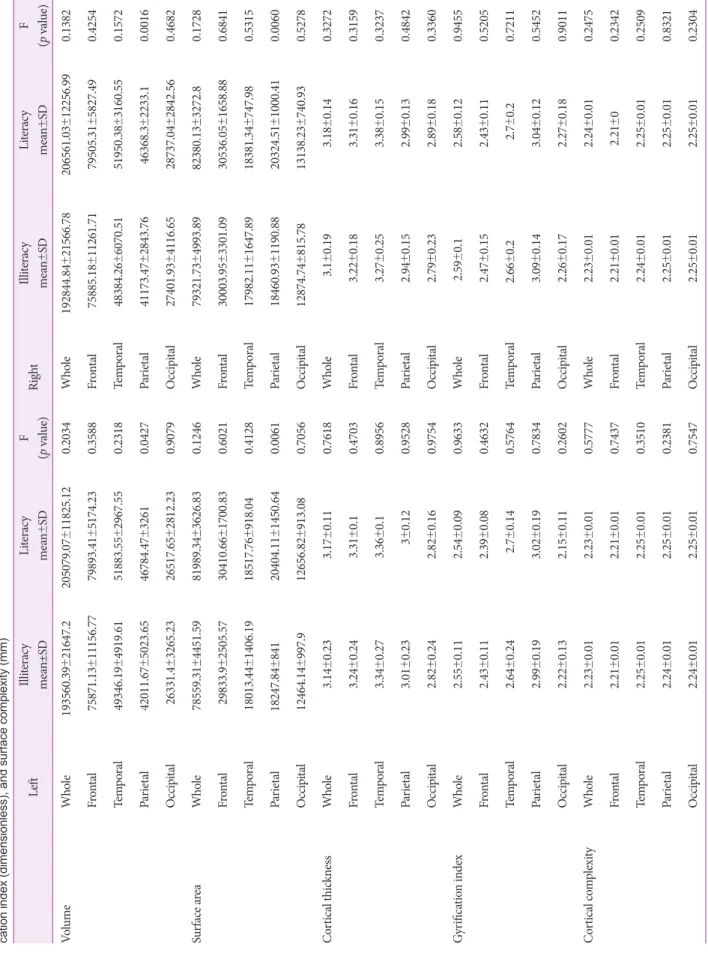
Table 3 shows the cortical volume data for illiterate and liter- ate groups. Parietal lobe volume was smaller in illiterate than literate groups in both hemispheres and the difference between illiterate and literate was greater in the right hemisphere (p=0.0016 vs. 0.0427). All the other lobes also showed smaller volumes in the illiterate group, but without reaching statistical significance.
Regional surface area
Table 3 shows the illiterate and literate results for cortical surface area. Parietal lobe surface area was smaller in illiterate than literate groups in both hemispheres. All other lobes also showed smaller surface areas in the illiterate group, but with- out reaching statistical significance.
Cortical thickness
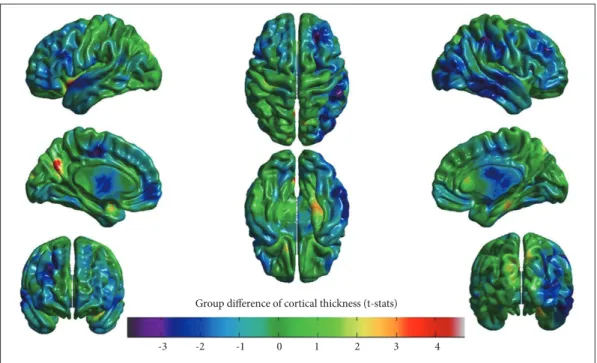
Table 3 shows the cortical thicknesses data for illiterate and literate groups; no lobes showed significant interhemispheric differences. However, there seemed to be a tendency toward smaller cortical thicknesses in the illiterate brain, especially in the right hemisphere and frontal lobe. Fig. 1 shows the vertex- based estimation of the effect of illiteracy on cortical thickness and shows a larger difference in cortical thickness in right hemisphere. Interestingly, the left cuneus showed a greater cortical thickness (mean difference, 3.5 mm) in illiterate than literate groups (Fig. 1).
Gyrification index
Table 3 shows the illiterate and literate group results for gyri- fication index. No lobes showed significant differences be- tween hemispheres.
Cortical complexity
Table 3 shows the illiterate and literate group results for cor- tical complexity. No lobes showed significant differences be- tween hemispheres.
DISCUSSION
This study sought to assess whether illiteracy is related to smaller regional brain volume, thinner cortical thickness, and
poorer neuropsychological function in elderly normal individ- uals. The illiterate group showed poorer performance in all cognitive areas, with a few exceptions. Analysis of brain MRI data showed that relative to the literate group, the illiterate group had decreased cortical volume and surface area in both parietal lobes significantly. Interestingly, the illiterate group showed a relatively greater cortical thickness in the left cuneus.
The illiterate group in our cohort was unique in some re- spects. They lacked formal education only because of their cultural backgrounds and had lived more than 65 years with- out knowledge of letters. The literate group also was unique.
Every literate individual had more than 6 years of education;
this period of education confers perceptual expertise regarding letters.36 Moreover, they had the same regional and occupa- tional background as the illiterate group. Therefore, the effects of literacy and formal education in a non-demented elderly population may easily be isolated by comparison of our two groups.
In accordance with our hypothesis, neuropsychological tests showed that the illiterate participants had significantly lower scores in most cognitive tests than literate participants. Inter- estingly, there were several cognitive tests that did not show significant differences between the two groups. These items were forward digit span, tool-use and tool-free gestures, verbal word recognition, and verbal generation of animals and gro- cery items. The reason why forward digit span did not show a statistical difference between groups may be explained by the fact that forward digit span measures basic attentional ability, which is unaffected by literacy. In contrast, there was a signifi- cant difference in backward digit span between the two groups.
Backward digit span demands memorization, reorganization, and articulation of the numbers. Therefore this task may exer- cise association cortex as well as frontal cortex, which have im- portant roles in working memory.37 The tests of praxis in limb use likewise did not show any differences between the two groups. There are several possible reasons. This kind of praxis is relatively simple and mainly dependent on spatial cognition, analogously to posture, spatial orientation, and skilled move- ment.38,39 An alternative explanation would be that acquisition of motor skills is not highly associated with language function, with the result that literacy does not affect it.40,41 The recogni- tion part of the verbal learning test did not show significant differences between the two groups. However, the raw test scores showed better performance in the literate group and we suspect that the small number of recruits caused the insignifi- cant result. Tests of word generation for a specified letter and category showed interesting results. For word generation for specified letters, there was significantly lower performance in the illiterate group, which was expected because of the group’s
Oh Dae Kwon et al.
Brain Volume of Illiterate versus Literate
Table 3. Summary of differences between the illiterate and literate groups in whole-hemisphere and lobe-wise surface area (mm2), cortical volume (mm3), cortical thickness (mm), gyrifi- cation index (dimensionless), and surface complexity (mm) LeftIlliteracy mean±SDLiteracy mean±SDF (p value)RightIlliteracy mean±SDLiteracy mean±SDF (p value) VolumeWhole193560.39±21647.2205079.07±11825.120.2034 Whole192844.84±21566.78206561.03±12256.990.1382 Frontal75871.13±11156.7779893.41±5174.230.3588 Frontal75885.18±11261.7179505.31±5827.490.4254 Temporal49346.19±4919.6151883.55±2967.550.2318 Temporal48384.26±6070.5151950.38±3160.550.1572 Parietal42011.67±5023.6546784.47±32610.0427 Parietal41173.47±2843.7646368.3±2233.10.0016 Occipital26331.4±3265.2326517.65±2812.230.9079 Occipital27401.93±4116.6528737.04±2842.560.4682 Surface areaWhole78559.31±4451.5981989.34±3626.830.1246 Whole79321.73±4993.8982380.13±3272.80.1728 Frontal29833.9±2505.5730410.66±1700.830.6021 Frontal30003.95±3301.0930536.05±1658.880.6841 Temporal18013.44±1406.1918517.76±918.040.4128 Temporal17982.11±1647.8918381.34±747.980.5315 Parietal18247.84±84120404.11±1450.640.0061 Parietal18460.93±1190.8820324.51±1000.410.0060 Occipital12464.14±997.912656.82±913.080.7056 Occipital12874.74±815.7813138.23±740.930.5278 Cortical thicknessWhole3.14±0.233.17±0.110.7618 Whole3.1±0.193.18±0.140.3272 Frontal3.24±0.243.31±0.10.4703 Frontal3.22±0.183.31±0.160.3159 Temporal3.34±0.273.36±0.10.8956 Temporal3.27±0.253.38±0.150.3237 Parietal3.01±0.233±0.120.9528 Parietal2.94±0.152.99±0.130.4842 Occipital2.82±0.242.82±0.160.9754 Occipital2.79±0.232.89±0.180.3360 Gyrification indexWhole2.55±0.112.54±0.090.9633 Whole2.59±0.12.58±0.120.9455 Frontal2.43±0.112.39±0.080.4632 Frontal2.47±0.152.43±0.110.5205 Temporal2.64±0.242.7±0.140.5764 Temporal2.66±0.22.7±0.20.7211 Parietal2.99±0.193.02±0.190.7834 Parietal3.09±0.143.04±0.120.5452 Occipital2.22±0.132.15±0.110.2602 Occipital2.26±0.172.27±0.180.9011 Cortical complexityWhole2.23±0.012.23±0.010.5777 Whole2.23±0.012.24±0.010.2475 Frontal2.21±0.012.21±0.010.7437 Frontal2.21±0.012.21±00.2342 Temporal2.25±0.012.25±0.010.3510 Temporal2.24±0.012.25±0.010.2509 Parietal2.24±0.012.25±0.010.2381 Parietal2.25±0.012.25±0.010.8321 Occipital2.24±0.012.25±0.010.7547 Occipital2.25±0.012.25±0.010.2304
DND
lack of lexical experience. This result may also reflect difficulty with sustained output, concentration, and retrieval.42 In con- trast, the word generation test for certain specified categories, namely animal and supermarket items, showed no difference between the two groups. Most studies with AD patients show that category fluency is more severely affected by the disease than letter fluency.43-45 Only one study has shown results simi- lar to ours,46 whereas another has shown a relatively high rate of AD patients with severe letter fluency impairment.47 The re- sult of our study may be explained by the fact that the items of these categorical tests were less related to literal stimulation, and by the fact that our illiterate group was especially devoid of literacy, being unable to read or write their own names.
Recent developments in functional brain imaging have re- vealed two posterior brain systems, the parietotemporal and the occipitotemporal, with lesions of the former system being associated with reading problems.48 A functional MRI study of developmental dyslexia showed that the left parietotemporal cortex is where reading difficulty is localized.49 The left angular gyrus in particular is known to be an important cortical locus of reading.50 Other areas associated with reading ability in the brain include middle temporal gyrus, superior temporal gyrus, inferior frontal gyrus, and middle frontal gyrus.51 The left an- gular gyrus has also been mentioned as a cortical locus of writ- ing.50 The other areas associated with writing are left superior parietal lobe,52 left posterior inferior temporal cortex,53 bilateral ventral occipitotemporal cortex,54 and thalamus.52 These stud-
ies indicate that the parietal lobe is the most important lobe for reading and writing.
We hypothesized that cerebral cortical volume in the illiter- ate group would be decreased in accordance with the group’s low scores on neuropsychological tests, at least in areas associ- ated with reading and writing. Furthermore, since the illiterate individuals in our sample had never received formal educa- tion, we also hypothesized that areas of association cortices mediating cognition would show reduced cortical thickness.
The distribution of relative reductions in cortical volume was quite comparable to our expectations, with illiterate subjects showing reduced cortical volume and reduced cortical surface area mainly in the parietal lobe. The parietal lobe contains large association areas such as the angular gyrus and supra- marginal gyrus. It also is close to Wernicke’s area and the pri- mary visual cortex, and performs various roles in interpreting verbal and visual language stimuli. In previous studies, lesions of the left inferior parietal lobule were shown to result in the development of dysgraphia, dyscalculia, right-left disorienta- tion, and finger agnosia, deficits known collectively as Gerst- mann syndrome.55 Presently, both parietal lobes showed de- creased volume and surface area in the illiterate group. This may indicate that the right parietal lobe also has important roles in literacy and life, functioning as a higher perceptual area for lexical information flowing out of the occipital lobe.
The frontal lobe, the main area of difference between illiter- ate and literate groups in our previous study with fluorodeoxy-
Fig. 1. Decreased cortical thickness (cold scale: blue-green) and increased cortical thickness (hot scale: red-yellow) across brain regions in illiterate vs. literate subjects. Left cuneus shows greater cortical thickness in the illiterate group than in the literate group.
Group difference of cortical thickness (t-stats) -3 -2 -1 0 1 2 3 4
Oh Dae Kwon et al.
Brain Volume of Illiterate versus Literate
glucose PET,14 did not show any volume differences in this study. We do not know the exact answer to this discrepancy.
Possible explanations are as follows. Frontal cortex and insular areas are prominent in showing rapid age-related volume loss.56 Therefore, the expected illiteracy effect on frontal corti- cal volume could have been attenuated by normal aging ef- fects. The small number of subjects also can be the reason of statistical insignificance.
Interestingly, the left cuneus showed a greater cortical thick- ness in the illiterate compared to the literate group. This is somewhat consistent with the increased glucose metabolism in the left precuneus found in the illiterate group in a previous study.14 Cuneus and precuneus are higher visual areas57 and are associated with velocity processing and estimation of time.58 The increased metabolism and cortical thickness of these areas could be an adaptive response compensating illit- eracy. However, the exact reason for this result is not clear from this study and needs further investigation.
This study has limitations. The number of each group is small and there is discrepancy of lesions found between this study and previous study using fluorodeoxyglucose PET.
Our volumetric MRI results are consistent with the results of neuropsychological tests and have identified the posterior part of the cerebrum as a language-associated area.50-53 We as- sumed that most cerebral cortical areas would show relatively decreased volume and surface area in illiterate subjects because of the weaker neuropsychological performances in this group;
in fact, our results revealed decreased volume and surface area only in the parietal lobe. However, in all the lobes of both hemispheres, the illiterate group showed smaller volumes than those of literate, although these effects were not significant.
The small number of participants could be the reason for the partial consistency of the results. This study indicated that the neuropsychological performances of normal elderly illiterate individuals are weaker in most aspects than those of literate individuals. Furthermore, this study affirms that the parietal lobe plays an important role in reading and writing acquired during the first several years of life. Overall, literacy acquired in childhood may increase brain volume as well as increasing cognitive performance through the process of brain plasticity and have lifelong effects. The literacy-related differences found here may affect the activities of daily living of individuals and be determining for adoption of life styles that require relatively more cognitive resources.
Conflicts of Interest
The authors have no financial conflicts of interest.
Acknowledgements
This study was supported by a grant from Janssen Korea. We wish to express
gratitude to the staff of the regional public health center of Goryung County, especially Dr. Soon-ki Ahn, Mrs. Hyang-Suk Jang, Mrs. Tae-Bun Sim, Ms.
Byeong-Nam Park, and Mrs. Gyeong-Ok Lee of Unsu Health Centre, for their administrative support of the recruitment of subjects for this study.
REFERENCES
1. Bornstein MH. On the development of color naming in young chil- dren: data and theory. Brain Lang 1985;26:72-93.
2. Krech D, Rosenzweig MR, Bennett EL. Effects of environmental complexity and training on brain chemistry. J Comp Physiol Psychol 1960;53:509-519.
3. Diamond MC. Enriching heredity: The impact of the environment on the anatomy of the brain. New York: The Free Press, 1988.
4. Beaulieu C, Cynader M. Effect of the richness of the environment on neurons in cat visual cortex. I. Receptive field properties. Brain Res Dev Brain Res 1990;53:71-81.
5. Beaulieu C, Colonnier M. Number and size of neurons and synapses in the motor cortex of cats raised in different environmental com- plexities. J Comp Neurol 1989;289:178-181.
6. Katzman R, Terry R, DeTeresa R, Brown T, Davies P, Fuld P, et al.
Clinical, pathological, and neurochemical changes in dementia: a sub- group with preserved mental status and numerous neocortical plaques.
Ann Neurol 1988;23:138-144.
7. Katzman R. Education and the prevalence of dementia and Alzheim- er’s disease. Neurology 1993;43:13-20.
8. Bennett DA, Wilson RS, Schneider JA, Evans DA, Mendes de Leon CF, Arnold SE, et al. Education modifies the relation of AD pathology to level of cognitive function in older persons. Neurology 2003;60:
1909-1915.
9. Brayne C, Calloway P. The association of education and socioeco- nomic status with the Mini Mental State Examination and the clinical diagnosis of dementia in elderly people. Age Ageing 1990;19:91-96.
10. Zhou DF, Wu CS, Qi H, Fan JH, Sun XD, Como P, et al. Prevalence of dementia in rural China: impact of age, gender and education. Acta Neurol Scand 2006;114:273-280.
11. Schmand B, Smit J, Lindeboom J, Smits C, Hooijer C, Jonker C, et al.
Low education is a genuine risk factor for accelerated memory de- cline and dementia. J Clin Epidemiol 1997;50:1025-1033.
12. Eisenberg DP, London ED, Matochik JA, Derbyshire S, Cohen LJ, Steinfeld M, et al. Education-associated cortical glucose metabolism during sustained attention. Neuroreport 2005;16:1473-1476.
13. Coffey CE, Saxton JA, Ratcliff G, Bryan RN, Lucke JF. Relation of education to brain size in normal aging: implications for the reserve hypothesis. Neurology 1999;53:189-196.
14. Kwon OD, Cho SS, Seo SW, Na DL. Effect of illiteracy on neuro- psychological tests and glucose metabolism of brain in later life. J Neuroimaging 2012;22:292-298.
15. Kang Y, Na DL. Seoul neuropsychological screening battery. Incheon:
Human Brain Research & Consulting Co., 2003.
16. Gu HM, Kim JH, Gwon UJ, Kim SH, Lee HS, Go HJ, et al. A study on the reliability and validity of Seoul-instrumental activities of daily living (S-IADL). J Korean Neuropsychiatr Assoc 2004;43:189-199.
17. Evans AC; Brain Development Cooperative Group. The NIH MRI study of normal brain development. Neuroimage 2006;30:184-202.
18. Collins DL, Neelin P, Peters TM, Evans AC. Automatic 3D intersub- ject registration of MR volumetric data in standardized Talairach space. J Comput Assist Tomogr 1994;18:192-205.
19. Sled JG, Zijdenbos AP, Evans AC. A nonparametric method for auto- matic correction of intensity nonuniformity in MRI data. IEEE Trans Med Imaging 1998;17:87-97.
20. Zijdenbos AP, Forghani R, Evans AC. Automatic “pipeline” analysis of 3-D MRI data for clinical trials: application to multiple sclerosis.
DND
IEEE Trans Med Imaging 2002;21:1280-1291.
21. Kim JS, Singh V, Lee JK, Lerch J, Ad-Dab’bagh Y, MacDonald D, et al. Automated 3-D extraction and evaluation of the inner and outer cortical surfaces using a Laplacian map and partial volume effect clas- sification. Neuroimage 2005;27:210-221.
22. Lyttelton O, Boucher M, Robbins S, Evans A. An unbiased iterative group registration template for cortical surface analysis. Neuroimage 2007;34:1535-1544.
23. Im K, Lee JM, Lyttelton O, Kim SH, Evans AC, Kim SI. Brain size and cortical structure in the adult human brain. Cereb Cortex 2008;18:
2181-2191.
24. Yoon U, Lee JM, Im K, Shin YW, Cho BH, Kim IY, et al. Pattern classification using principal components of cortical thickness and its discriminative pattern in schizophrenia. Neuroimage 2007;34:1405- 1415.
25. Luders E, Narr KL, Zaidel E, Thompson PM, Toga AW. Gender ef- fects on callosal thickness in scaled and unscaled space. Neuroreport 2006;17:1103-1106.
26. Luders E, Thompson PM, Narr KL, Toga AW, Jancke L, Gaser C. A curvature-based approach to estimate local gyrification on the corti- cal surface. Neuroimage 2006;29:1224-1230.
27. Wiegand LC, Warfield SK, Levitt JJ, Hirayasu Y, Salisbury DF, Heck- ers S, et al. An in vivo MRI study of prefrontal cortical complexity in first-episode psychosis. Am J Psychiatry 2005;162:65-70.
28. Van Essen DC. A Population-Average, Landmark- and Surface-based (PALS) atlas of human cerebral cortex. Neuroimage 2005;28:635-662.
29. Lerch JP, Evans AC. Cortical thickness analysis examined through power analysis and a population simulation. Neuroimage 2005;24:163- 30. Im K, Lee JM, Seo SW, Yoon U, Kim ST, Kim YH, et al. Variations 173.
in cortical thickness with dementia severity in Alzheimer’s disease.
Neurosci Lett 2008;436:227-231.
31. Van Essen DC, Drury HA. Structural and functional analyses of hu- man cerebral cortex using a surface-based atlas. J Neurosci 1997;17:
7079-7102.
32. Zilles K, Armstrong E, Schleicher A, Kretschmann HJ. The human pattern of gyrification in the cerebral cortex. Anat Embryol (Berl) 1988;
179:173-179.
33. Zilles K, Schleicher A, Rath M, Bauer A. Quantitative receptor auto- radiography in the human brain. Methodical aspects. Histochemistry 1988;90:129-137.
34. Yoon U, Fonov VS, Perusse D, Evans AC; Brain Development Coop- erative Group. The effect of template choice on morphometric analy- sis of pediatric brain data. Neuroimage 2009;45:769-777.
35. Genovese CR, Lazar NA, Nichols T. Thresholding of statistical maps in functional neuroimaging using the false discovery rate. Neuroimage 2002;15:870-878.
36. Aghababian V, Nazir TA. Developing normal reading skills: aspects of the visual processes underlying word recognition. J Exp Child Psy- chol 2000;76:123-150.
37. Hornberger M, Piguet O, Kipps C, Hodges JR. Executive function in progressive and nonprogressive behavioral variant frontotemporal de- mentia. Neurology 2008;71:1481-1488.
38. Foundas AL, Macauley BL, Raymer AM, Maher LM, Rothi LJ, Hei- lman KM. Ideomotor apraxia in Alzheimer disease and left hemi- sphere stroke: limb transitive and intransitive movements. Neuropsy- chiatry Neuropsychol Behav Neurol 1999;12:161-166.
39. Poizner H, Mack L, Verfaellie M, Rothi LJ, Heilman KM. Three-di- mensional computergraphic analysis of apraxia. Neural representa- tions of learned movement. Brain 1990;113(Pt 1):85-101.
40. Meador KJ, Loring DW, Lee K, Hughes M, Lee G, Nichols M, et al.
Cerebral lateralization: relationship of language and ideomotor prax- is. Neurology 1999;53:2028-2031.
41. Heilman KM. Apraxia. Continuum (Minneap Minn) 2010;16(4 Behav- ioral Neurology):86-98.
42. Abrahams S, Leigh PN, Harvey A, Vythelingum GN, Grisé D, Gold- stein LH. Verbal fluency and executive dysfunction in amyotrophic lat- eral sclerosis (ALS). Neuropsychologia 2000;38:734-747.
43. Butters N, Granholm E, Salmon DP, Grant I, Wolfe J. Episodic and semantic memory: a comparison of amnesic and demented patients.
J Clin Exp Neuropsychol 1987;9:479-497.
44. Kaplan EF, Goodglass H, Weintraub S. The Boston Naming Test. 2nd ed. Philadelphia: Lippincott Williams & Wilkins, 2001.
45. Margolin DI, Pate DS, Friedrich FJ, Elia E. Dysnomia in dementia and in stroke patients: different underlying cognitive deficits. J Clin Exp Neuropsychol 1990;12:597-612.
46. Hart S, Smith CM, Swash M. Word fluency in patients with early de- mentia of Alzheimer type. Br J Clin Psychol 1988;27(Pt 2):115-124.
47. Sherman AM, Massman PJ. Prevalence and correlates of category ver- sus letter fluency discrepancies in Alzheimer’s disease. Arch Clin Neu- ropsychol 1999;14:411-418.
48. Shaywitz SE, Shaywitz BA. Dyslexia (specific reading disability). Biol Psychiatry 2005;57:1301-1309.
49. Hoeft F, Hernandez A, McMillon G, Taylor-Hill H, Martindale JL, Meyler A, et al. Neural basis of dyslexia: a comparison between dys- lexic and nondyslexic children equated for reading ability. J Neurosci 2006;26:10700-10708.
50. Kawamura M, Midorikawa A, Kezuka M. Cerebral localization of the center for reading and writing music. Neuroreport 2000;11:3299-3303.
51. Gaillard WD, Pugliese M, Grandin CB, Braniecki SH, Kondapaneni P, Hunter K, et al. Cortical localization of reading in normal children:
an fMRI language study. Neurology 2001;57:47-54.
52. Otsuki M, Soma Y, Arai T, Otsuka A, Tsuji S. Pure apraxic agraphia with abnormal writing stroke sequences: report of a Japanese patient with a left superior parietal haemorrhage. J Neurol Neurosurg Psy- chiatry 1999;66:233-237.
53. Nakamura K, Honda M, Okada T, Hanakawa T, Toma K, Fukuyama H, et al. Participation of the left posterior inferior temporal cortex in writing and mental recall of kanji orthography: A functional MRI study. Brain 2000;123(Pt 5):954-967.
54. Nelson JR, Liu Y, Fiez J, Perfetti CA. Assimilation and accommoda- tion patterns in ventral occipitotemporal cortex in learning a second writing system. Hum Brain Mapp 2009;30:810-820.
55. Gerstmann J. Some notes on the Gerstmann syndrome. Neurology 1957;
7:866-869.
56. Good CD, Johnsrude IS, Ashburner J, Henson RN, Friston KJ, Frack- owiak RS. A voxel-based morphometric study of ageing in 465 nor- mal adult human brains. Neuroimage 2001;14(1 Pt 1):21-36.
57. Burton H, Snyder AZ, Conturo TE, Akbudak E, Ollinger JM, Raichle ME. Adaptive changes in early and late blind: a fMRI study of Braille reading. J Neurophysiol 2002;87:589-607.
58. Hurwitz M, Valadao D, Danckert J. Functional MRI of dynamic judg- ments of spatial extent. Exp Brain Res 2011;214:61-72.