Introduction
Gadolinium ethoxybenzyl diethylenetriaminepenta-
acetic acid (Gd-EOB-DTPA, gadoxetic acid; Primovist, Bayer Schering Pharma, Berlin, Germany) is a relatively new hepatobiliary magnetic resonance (MR) contrast agent with a unique capacity as an
JKSMRM 15:226-233(2011)
1Department of Diagnostic Radiology and Institution of Radiological Science, Severance Hospital, Yonsei University College of Medicine, Seoul, South Korea
2Department of Diagnostic Radiology, Gangnam Severance Hospital, Yonsei University College of Medicine, Seoul, South Korea Received; October 24, 2011, revised; November 17, 2011, accepted; November 24, 2011
Corresponding author : Myeong-Jin Kim, M.D., Department of Diagnostic Radiology, Severance Hospital, 134 Shinchon-dong, Seodaemun-gu, Seoul 120-752, Korea.
Tel. 82-2-2228-7400 Fax. 82-2-393-3035 E-mail: [email protected]
Focal Liver Lesion Detection in Gadoxetic
Acid-enhanced Liver MRI: Effects of Scan Delay, Hepatic Function, and Magnetic Field Strength
Hua Sun Kim1, Myeong-Jin Kim1, Jae-Joon Chung2, Joon Suk Lim1, Yong Eun Chung1, Mi-Suk Park1, Ki Whang Kim1
Purpose : To determine the effects of scan delay, hepatic function, and magnetic field strength on the performance of gadoxetic acid enhanced magnetic resonance imaging.
Materials and Methods : Gadoxetic acid enhanced MRI conducted in 72 patients with 10 minutes and 20 minutes delay were reviewed retrospectively. For quantitative analysis, liver-to-lesion signal difference ratio (SDR) was measured and compared according to scan delay time, hepatic function and magnetic field strength. For qualitative analysis, two board-certificated radiologists reviewed 10-minute delay and 20-minute delay images. The sensitivity and specificity of each reader was compared.
Results : The SDR of 20-minute images in non-cirrhotic patients was significantly higher (p < 0.01) than that of 10-minute delay images. However, in cirrhotic patients, it was comparable (p > 0.05) to 10-min delay images. In comparisons according to the magnetic strength, there was no significant difference between 1.5-T and 3.0-T systems. Comparisons of ROC curves showed no statistically significant differences in sensitivity and specificity between 10-minute and 20-minute delay images.
Conclusion : An increase in the liver-to-lesion signal difference ratio was dependent on the patients’hepatic function but not dependent on the magnetic strength. There was no significant difference in sensitivity or specificity between the 10-minute and 20-minute delay images.
Index words :Magnetic resonace imaging (MRI) Liver
Gadoxetic acid GD-EOB-DTPA
extracellular contrast agent and hepatocyte-specific agent for use in double phase imaging. It requires only a single bolus injection (1, 2) and is actively taken up by hepatocytes with subsequent biliary excretion (3-5).
Previous studies showed that the uptake and biliary excretion of Gd-EOB-DTPA is dependent on liver function (6-8). In case of patients with normal hepatic function, 10 minute delay was sufficient for the diagnosis of metastasis (9). However, previous studies showed that patients with impaired hepatic function show delayed hepatic uptake and biliary excretion of gadoxetic acid (10, 11). This property is of particular interest in practice because many patients suspected of having a focal liver lesion also have impaired liver function and patients with impaired hepatic function may need longer delay time for optimal enhancement.
The purpose of this study was to determine the effect of hepatic function, scan delay time and magnetic field strength on focal lesion detection in gadoxetic acid enhanced MRI.
Materials and Methods
Between May, 2007 and January, 2008, 92 patients suspected of having focal hepatic lesions underwent liver MRI using gadoxetic acid as a contrast agent. MR imaging was performed with a 1.5-T (Intera Achieva;
Philips Medical Systems, Best, Netherlands) in 47 patients and a 3.0-T (TrioTim; Siemens, Erlangen, Germany or Intera Achieva; Philips Medical systems, Best, Netherlands) system in 45 patients with phased- array coils. All of the images were obtained in the transverse plane with a rectangular field of view of 22- 24 × 38 cm, which was adjusted for each patient.
Dynamic T1-weigted MR imaging was performed using a transverse breath-hold three-dimensional T1- weighted fat-suppressed spoiled gradient-recalled-echo sequence with a bolus injection of 10 mL of Gd-EOB- DTPA followed by a 30-mL saline flush.
Hepatobiliary phase images were obtained at 10 minutes and 20 minutes after injection of Gd-EOB- DTPA. Images were obtained using the same pulse sequence for dynamic MR imaging. Imaging parameters for the 1.5-T MRI were as follows:
repetition time msec/echo time msec 4.44/2.17; flip angle, 15�; acquisition matrix size 256 × 256; and interpolated section thickness, 2.2 mm. Imaging
parameters for the 3.0-T MRI were as follows:
repetition time msec/echo time msec 2.54/0.95; flip angle, 13�; acquisition matrix size 192 × 256; and interpolated section thickness, 2 mm.
For quantitative analysis, a region of interest (ROI) was drawn at each of four different locations including the background liver, focal lesion, spleen, and background noise. The ROI on the liver was drawn on the right lobe posterior segment to avoid artifacts from the aorta. The minimum area of ROI for liver was 100 mm2and was drawn to avoid visible ducts or vessels as much as possible. The ROI on the lesion was drawn with a minimum ROI of 50 mm2 and on the largest lesion present in cases with multiple lesions. Focal lesions less than 1 cm were excluded from this study.
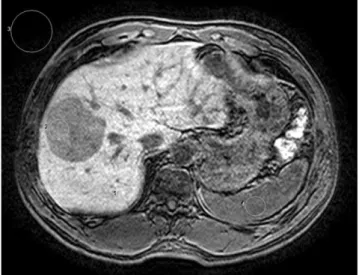
In cases of multiple focal lesions, the largest one was selected for the measurement. In cases with necrotic masses, the ROI was drawn on the solid portion of the lesion. The ROI on the spleen was drawn to avoid visible vessels as much as possible with a minimum ROI of 200 mm2. The background noise signal was measured on the right anterior quadrant in an oval shape with a minimum ROI of 400 mm2(Fig. 1).
For patients with focal lesions, liver-to-lesion signal difference ratio (SDR) was defined as (the signal
Fig. 1. An example of the ROI measurement
1) Liver: ROI on the right lobe posterior segment with minimum area of 100 mm2
2) Lesion: minimum ROI area of 50 mm2, avoiding necrotic areas
3) Background noise signal: ROI on right anterior quadrant in oval shape with minimum ROI of 400 mm2 4) Spleen: minimum ROI area of 200 mm2
intensity of the liver minus the signal intensity of the focal lesion)/the signal intensity of the liver. This ratio was measured and compared between pre-contrast, 10- min delay, and 20-min delay images for each patient.
SDRs were compared between 1.5-T and 3.0-T and also between cirrhotic patients and non-cirrhotic patients.
To assess a patient’s hepatic function, the Child-Pugh score and the Model for End-Stage Liver Disease (MELD) score were calculated and compared, together with the SDR and CER, with the scores and ratios of clinically diagnosed cirrhotic patients and non-cirrhotic patients. For qualitative analysis, two board-certificated radiologists with 1 and 2 years of consecutive experience in abdominal imaging reviewed two sets of blinded image series composed of 10-minute delay and 20-minute delay images for any focal lesion. One set of images contained a mixture of randomly chosen 10- minute and 20-minute delay images from each of the patients and the complementary set had the remaining images. The location and number rating as determined by a four-tiered confidence scale (1: probably not present, 2: possibly present, 3: probably present, 4:
definitely present) of every detected focal lesion was documented by the readers. In cases of potential false- positive or false-negative lesions, a senior reviewer with more than 10 years of experience in liver MR imaging participated as a referee and examined the EOB-delay images as well as other image sequences T2 weighted image and dynamic enhancement image together with the patients’clinical data and past history and follow exam studies. Each detected lesion was categorized into false-negative (FN), false-positive (FP), true-negative (TN), or true-positive (TP) groups.
The sensitivity and specificity of each reader was compared between the 10-minute delay and 20-minute delay images.
Statistical analysis was performed using the MedCalc program (version 6.15.000; MedCalc Software, Mariakerke, Belgium). A p value of less than 0.05 was considered to be indicative of a statistically significant difference. SDRs for the 10-minute delay and 20- minute delay images were compared using the ‘the paired sample t-test’. The diagnostic capability of each reviewer was determined by calculating the area under the receiver operating characteristic (ROC) curve (Az) for each reviewer. Calculations of statistical significance for the differences between the areas
under the ROC curves of the 10-minute delay and 20- minute delay images were performed using the univariate z score test using the same software. To analyze the relationship between liver function and SDR, Pearson correlation analysis was also performed using the MedCalc program. Sensitivity of analysis was calculated as the number of true-positive lesions/ (the number of true-positive lesions + the number of false- negative lesions) and specificity was calculated as the number of true-negative lesions/ (number of true- negative lesions + the number of false-positive lesions).
Results
Among the 92 patients enrolled in the study, 18 patients were excluded from the comparison of SDR because they had no focal lesion in the liver or had focal lesions of less than 1 cm. Therefore, a total of 72 patients were included in this study. There were fifty- two male patients and twenty female patients with an average age of 56 years (maximum 83, minimum 20, and standard deviation of 12). MRI was performed on a 3-T system in 35 patients, and on a 1.5-T system in the remaining 37 cases. Fifty-three patients had no evidence of chronic liver disease, while the remaining thirty-nine patients had clinically diagnosed cirrhosis.
Among the 39 patients with cirrhosis, 30 patients had hepatocellular carcinoma (HCC), 5 patients had dysplastic nodules, two patients had focal nodular hyperplasia, one patient had hemangioma, and one patient showed no focal lesion of the liver on MRI.
Patients without cirrhosis were diagnosed with various diseases including metastasis, cyst, eosinophilic infiltration, angiomyolipoma, and others. The diagnosis was based on pathology in case the patient underwent
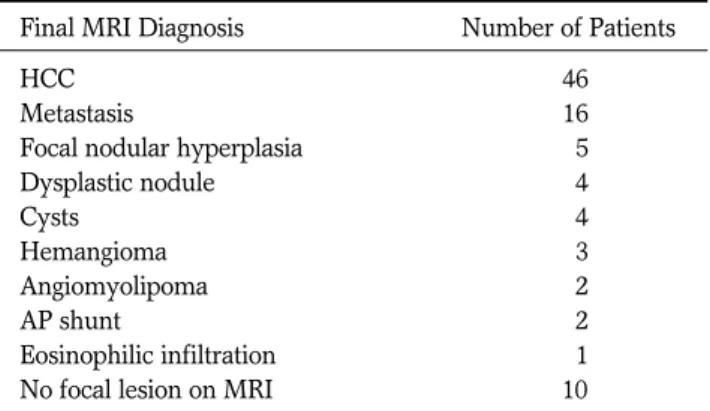
Table 1. Final MRI Diagnosis for Each Patient
Final MRI Diagnosis Number of Patients
HCC 46
Metastasis 16
Focal nodular hyperplasia 5
Dysplastic nodule 4
Cysts 4
Hemangioma 3
Angiomyolipoma 2
AP shunt 2
Eosinophilic infiltration 1
No focal lesion on MRI 10
surgery. In the other cases, diagnosis was based on typical image finding including follow up studies and lab finding.
The final MRI diagnosis for each patient is shown in Table 1.
A total of 195 focal lesions not smaller than 1 cm were detected in the 72 patients by the two reviewers.
Among the identified lesions, 145 were found to be true-positive lesions and 50 were determined to be false-positive lesions. The numbers of false-negative, false-positive, true-positive and true-negative diagnoses when using 10-minute and 20-minute delay images are
shown in Table 2 for reader 1 and Table 3 for reader 2.
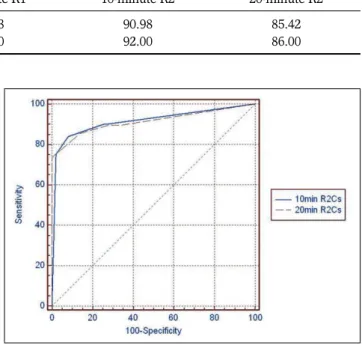
The sensitivity and specificity of each reader with 10- minute and 20-minute delay images are shown in Table 4. Comparisons of ROC curves (Figs. 2, 3) showed no statistically significant differences in Az values between 10-minute and 20-minute delay images for either Reader 1 or Reader 2 (p= 0.117 and 0.936 respectively).
The mean SDRs for 10-min delay images (0.49 ± 0.19 in non-cirrhotic and 0.42 ± 0.18 in cirrhotic patients) were significantly higher compared to precontrast images in both non-cirrhotic (0.34 ± 0.16,
Table 3. Results of Reader 2
20-minute 10-minute Delay Images
Delay Images FN FP TN TP
FN 11 0 00 010 021 (10.8%)
FP 00 0 07 000 007 (3.6%)
TN 00 4 39 000 043 (22.2%)
TP 12 0 00 111 123 (63.4%)
23 4 46 121 194
(11.9%) (2.1%) (23.7%) (62.4%)
Note.─ FN: false-negative, FP: false-positive, TP: true-positive, TN: true-negative
Table 4. Sensitivity and Specificity of Readers 1 and 2
10-minute R1 20-minute R1 10-minute R2 20-minute R2
Sensitivity (%) 84.03 83.33 90.98 85.42
Specificity (%) 84.00 76.00 92.00 86.00
Table 2. Results of Reader 1
20-minute 10-minute Delay Images
Delay Images FN FP TN TP
FN 10 0 00 014 024 (12.4%)
FP 00 1 11 000 012 (6.2%)
TN 00 7 31 000 038 (19.6%)
TP 13 0 00 107 120 (61.9%)
23 8 42 121 194
(11.9%) (4.1%) (21.6%) (62.4%)
Note.─ FN: false-negative, FP: false-positive, TP: true-positive, TN: true-negative
Fig. 2. ROC curve of Reader 1
There is no significant difference in sensitivity and specificity between 10-minute and 20-minute delay images (p= 0.117).
Fig. 3. ROC curve of Reader 2
There is no significant difference in sensitivity and specificity between 10-minute and 20-minute delay images (p= 0.936).
p < 0.01) and cirrhotic (0.20 ± 0.30, p < 0.01) patients. The SDR of 20-min images in non-cirrhotic patients (0.54 ± 0.19) was significantly higher (p <
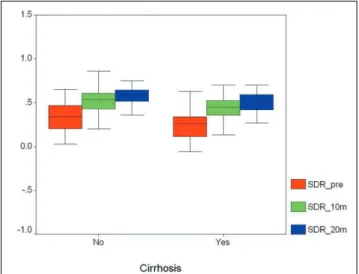
0.01) than that of 10-min delay images. However, in cirrhotic patients, the SDR of 20-min images (0.46 ± 0.21) was comparable (p > 0.05) to the ratio calculated for 10-min delay images. There was no significant difference between non-cirrhotic and cirrhotic patients for each value as shown in Figure 4.
In comparisons according to the magnetic strength of the imaging system, there were significant (p < 0.05) differences in all comparisons between SDRs of precontrast, 10-min, and 20-min delay images on both 1.5-T (0.30 ± 0.21, 0.47 ± 0.16, and 0.50 ± 0.17, respectively) and 3-T (0.24 ± 0.27, 0.46 ± 0.21, 0.50 ± 0.24, respectively) systems. There was no significant difference between 1.5-T and 3T systems for each value as shown in Figure 5.
MELD scores were obtained for 64 patients. Twenty- eight patients did not have the laboratory results necessary to calculate a MELD score including serum bilirubin level, creatinine level, or coagulation test results from within three months of the time of the MRI examination. The average MELD score value was 3.49 with a standard deviation of 3.08 (maximum 10 and minimum -7). The SDRs from both 10-min and 20- min delay images showed statistically significant inverse relationships to the MELD score. (p=0.07 and p<0.01 respectively). We also calculated Child-Pugh scores in 83 patients; 81 patients with class A and 2 patients with class B. We found no statistically significant correlation between SDR and Child-Pugh score.
Discussion
In this study, we used Gd-EOB-DTPA as an MRI contrast agent in 92 patients. We acquired the images at 10 minutes and 20 minutes after injection and compared the SDRs from 10-minute and 20-minute images between cirrhotic and non-cirrhotic patients.
There was no significant difference between the SDRs of 10-minute and 20-minute delay images in cirrhotic patients (Fig. 6). On the other hand, there was a
Fig. 4. Liver-to-Lesion Signal Difference Ratio (SDR):
cirrhosis vs. non-cirrhosis
Shown is a summary plot based on the median, quartiles, and extreme values. The box represents the interquartile range which contains 50% of all values. The whiskers extend from the box to the highest and lowest values, excluding outliers. A line across the box indicates the median.
The SDRs of 20-min images are significantly higher than those of 10-min images in non-cirrhotic patients, but the difference is not significant in cirrhotic patients. There is no significant difference between non-cirrhotic and cirrhotic patients for each value. The mean SDRs for 10- and 20-min delay images are significantly higher compared to those of precontrast images in both non- cirrhotic and cirrhotic patients.
Fig. 5. Liver-to-Lesion Signal Difference Ratio (SDR): 1.5-T vs. 3.0-T
There was a significant difference in all comparisons of SDRs of precontrast, 10-min, and 20-min delay images from both systems. However, there was no significant difference between the 1.5-T and 3-T systems for each variable.
significant increase in the SDR of 20-minute delay images compared to that of 10-minute delay images in non-cirrhotic patients (Fig. 7). The reason for this difference in enhancement is most likely related to hepatic function. In this study, the SDRs on both 10- min delay and 20-min delay images showed a statistically significant inverse relationship with the MELD score suggesting that the more impaired the
liver function, the less the signal difference between the liver and the focal lesion and a 20-minute delay image may not be sufficient for optimal enhancement of the liver in patients with impaired liver function. A recent study of Gd-EOB-DTPA-enhanced magnetic resonance cholangiography showed delayed excretion of Gd-EOB-DTPA in patients with impaired liver function as compared to individuals with normal liver
a b
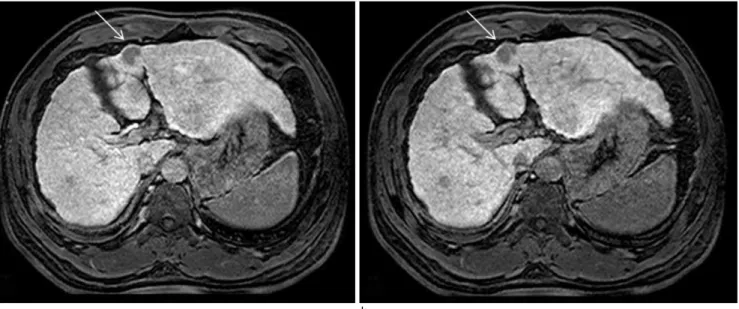
Fig. 6. A 77-year-old male with hepatic dysfunction
The liver shows features of advanced cirrhosis including a nodular liver surface and right lobe atrophy. The patient was diagnosed with hepatocellular carcinoma (white arrows). There was no definite increase in the liver parenchymal enhancement and the SDR measured was 0.43 on a 10-minute delay image (a) and 0.49 on the 20-minute delay image (b).
a b
Fig. 7. A 59-year-old female without hepatic dysfunction
There is a cyst on liver segment 6 (black arrows). The 20-minute delay image (b) shows increased hepatic parenchymal enhancement compared to the 10-minute delay image (a). SDR was calculated to be 0.57 on the 10-minute delay image and 0.68 on the 20-minute delay image.
function and suggested that this discrepancy may result in an inferior or even insufficient enhancement of the biliary tree in cirrhotic patients(7). Since there are fewer functioning hepatocytes in livers with chronic liver disease, the capacity for the excretion of Gd-EOB- DTPA would be reduced and more Gd-EOB-DTPA would be excreted via the kidneys in competition with biliary excretion(12).
Our study found that there was no statistically significant relationship between SDR and Child-Pugh score. The Child-Pugh score includes subjective quantification of ascites and hepatic encephalopathy and is less precise as compared to the MELD score. In this study most of the patients were in class A and only two patients were in class B of the Child-Pugh classification, suggesting a lack of minute differentiation of liver function by the Child-Pugh system. Moreover, recent studies have indicated that the MELD score is superior to the Child-Pugh classification in predicting the 3-month mortality among patients with chronic liver disease (13, 14).
Comparisons of findings according to the magnetic strength of the imaging system revealed that there were significant differences between SDRs on precontrast, 10-min, and 20-min delay images on both 1.5-T and 3-T systems. However, there was no significant difference between 1.5-T and 3-T systems for each value suggesting that hepatic enhancement and tumor-to-liver contrast on Gd-EOB-DTPA-enhanced MR images taken at 3.0 T are not different from those of images taken at 1.5 T.
Quantitative analysis revealed no statistical significance between 10-minute delay images and 20- minute delay images in sensitivity or specificity. The increased tumor-to-liver contrast in 20-minute delay images compared to 10-minute delay images in non- cirrhotic patients may not provide diagnostic accuracy in practice while 10-minute delay image may provide adequate parenchymal enhancement in non-cirrhotic patients. Longer delay images could improve liver parenchymal enhancement in cirrhotic patients.
However, a recent study on Gd-EOB-DTPA-enhanced magnetic resonance cholangiography reported that 16 out of 40 cirrhosis patients (40%) had an overall sufficient MRC image quality within 30 minutes while even after 180 minutes overall visualization of the biliary tree could be obtained in only 21 out of 40
patients (53%)(7). This finding suggests that a longer delay does not necessarily yield increased liver parenchymal enhancement. Since Gd-EOB-DTPA is excreted through renal and biliary pathways in competition, more contrast material may be excreted by glomerular filtration rather than being held for biliary excretion. Hence, a longer delay may be unnecessary even in cirrhotic patients.
Our study has several limitations. First, not all focal lesions were confirmed pathologically and most MR diagnosis was based on image findings and lab findings.
Secondly, this study included various kinds of focal lesions including both malignancy and benign lesions and the result may differ according to the kind of lesions. Further research is necessary for each individual diagnosis. Thirdly, hepatobiliary phase MRI was obtained with 10 and 20 minutes delay in this study, however, further delay may result in different conclusion and this needs further future research.
In conclusion, the liver-to-lesion signal difference ratio was significantly higher on 20-min delay images compared to 10-min delay images in non-cirrhotic patients, but not in cirrhotic patients. An increase in the liver-to-lesion signal difference ratio on 10- and 20- min delay images was not dependent on the magnetic strength of the imaging system. Furthermore, there was no significant difference in sensitivity or specificity between the 10-minute and 20-minute delay images.
References
1.Weinmann HJ, Schuhmann-Giampieri G, Schmitt-Willich H, Vogler H, Frenzel T, Gries H. A new lipophilic gadolinium chelate as a tissue-specific contrast medium for MRI. Magn Reson Med 1991;22:233-237; discussion 242
2.Schuhmann-Giampieri G, Schmitt-Willich H, Press WR, Negishi C, Weinmann HJ, Speck U. Preclinical evaluation of Gd-EOB-DTPA as a contrast agent in MR imaging of the hepatobiliary system. Radiology 1992;183:59-64
3.Schuhmann-Giampieri G, Mahler M, Roll G, Maibauer R, Schmitz S. Pharmacokinetics of the liver-specific contrast agent Gd-EOB-DTPA in relation to contrast-enhanced liver imaging in humans. J Clin Pharmacol 1997;37:587-596 4.Muhler A, Weinmann HJ. Biodistribution and excretion of
153Gd-labeled gadolinium ethoxybenzyl diethylenetriamine pentaacetic acid following repeated intravenous administration to rats. Acad Radiol 1995;2:313-318
5.Clement O, Muhler A, Vexler V, Berthezene Y, Brasch RC.
Gadolinium-ethoxybenzyl-DTPA, a new liver-specific magnetic resonance contrast agent. Kinetic and enhancement
patterns in normal and cholestatic rats. Invest Radiol 1992;27:612-619
6.Ryeom HK, Kim SH, Kim JY, et al. Quantitative evaluation of liver function with MRI Using Gd-EOB-DTPA. Korean J Radiol 2004;5:231-239
7.Tschirch FT, Struwe A, Petrowsky H, Kakales I, Marincek B, Weishaupt D. Contrast-enhanced MR cholangiography with Gd-EOB-DTPA in patients with liver cirrhosis: visualization of the biliary ducts in comparison with patients with normal liver parenchyma. Eur Radiol 2008;18:1577-1586
8.Yamada A, Hara T, Li F, et al. Quantitative evaluation of liver function with use of gadoxetate disodium-enhanced MR imaging. Radiology 2011;260:727-733
9.Sofue K, Tsurusaki M, Tokue H, Arai Y, Sugimura K. Gd- EOB-DTPA-enhanced 3.0 T MR imaging: quantitative and qualitative comparison of hepatocyte-phase images obtained 10 min and 20 min after injection for the detection of liver metastases from colorectal carcinoma. Eur Radiol 2011;21:2336-2343
10.Tamada T, Ito K, Higaki A, et al. Gd-EOB-DTPA-enhanced MR imaging: Evaluation of hepatic enhancement effects in normal and cirrhotic livers. Eur J Radiol 2011;80:e311-316 11.Tamada T, Ito K, Sone T, Kanki A, Sato T, Higashi H. Gd-
EOB-DTPA enhanced MR imaging: Evaluation of biliary and renal excretion in normal and cirrhotic livers. Eur J Radiol 2011;80:e207-211
12.Hamm B, Staks T, Muhler A, et al. Phase I clinical evaluation of Gd-EOB-DTPA as a hepatobiliary MR contrast agent:
safety, pharmacokinetics, and MR imaging. Radiology 1995;195:785-792
13.Abe Y, Fujii K, Nagata N, et al. The Toll-like receptor 3- mediated antiviral response is important for protection against poliovirus infection in poliovirus receptor transgenic mice. J Virol 2011
14.Iwasaki H, Takeuchi O, Teraguchi S, et al. The IkappaB kinase complex regulates the stability of cytokine-encoding mRNA induced by TLR-IL-1R by controlling degradation of regnase-1. Nat Immunol 2011;12(12):1167-1175
통신저자 : 김명진, (120-752) 서울시 서대문구 신촌동 134, 연세대학교 의과대학 세브란스병원 영상의학과교실 Tel. 82-2-2228-7400 Fax. 82-2-393-3035 E-mail: [email protected]
Gadoxetic acid 조영증강 자기공명영상에서 간 국소 병변의 진단:
지연시간, 간기능과 자기장의 영향
1연세대학교 의과대학 세브란스병원 영상의학교실 영상의학연구소
2연세대학교 의과대학 강남세브란스병원 영상의학교실
김화선1∙김명진1∙정재준2∙임준석1∙정용은1∙박미숙1∙김기황1
목적: Gadoxetic acid 조영증강 자기공명영상의 간담도기 영상에서 지연시간, 간 기능, 그리고 자기장의 영향을 평 가함.
대상 및 방법: Gadoxetic acid 조영증강 자기공명영상을 진행한 72명의 환자를 대상으로 후향적 연구를 진행하였 다. 정량적 분석을 위해 간-병변 신호차비를 측정하여 1.5-T and 3.0-T 사이를 비교하고 환자의 간 기능에 따라 비 교하였다. 정성적 분석을 위해 두 명의 영상의학과 전문의가 10분 지연 영상과 20분 지연 영상을 평가하여 국소 병 변을 각각 진단한 다음 각각의 민감도와 특이도를 비교하였다.
결과: 20분 지연영상에서 평균 간-병변 신호차비는 간경화가 없는 환자에서는 10분 지연영상보다 유의하게 높았으 나(p < 0.01) 간경변이 있는 환자에서는 그렇지 않았다. (p > 0.05) 1.5-T and 3.0-T 에서 서로 차이가 없었다.
10분 지연 영상과 20분 지연영상 사이에서 민감도와 특이도에 통계학적으로 유의한 차이는 없었다.
결론: Gadoxetic acid 조영증강 영상에서 간-병변 신호차비는 환자의 간기능의 영향은 받았으나 자기장의 세기는 영향이 없었다. 10분 지연 영상과 20분 지연 영상은 진단에 있어서 민감도와 특이도의 차이는 없었다.
대한자기공명의과학회지 15:226-233(2011)