HIGHLIGHTS
• Cerebral blood volume (CBV) is a hemodynamic correlate of oxygen metabolism.
• CBV can be easily quantified with magnetic resonance imaging (MRI).
• CBV MRI has high resolution.
Brain Neurorehabil. 2018 Sep;11(2):e18 https://doi.org/10.12786/bn.2018.11.e18 pISSN 1976-8753·eISSN 2383-9910
Review
Received: Sep 21, 2018 Accepted: Sep 27, 2018 Correspondence to Suk Hoon Ohn
Department of Physical Medicine and Rehabilitation, Hallym University Sacred Heart Hospital, Hallym University College of Medicine, 22 Gwanpyeong-ro 170-beon-gil, Dongan-gu, Anyang 14068, Korea.
E-mail: [email protected] [email protected]
Suk Hoon Ohn
Cerebral Blood Volume Magnetic Resonance Imaging
Brain & NeuroRehabilitation
Copyright © 2018. Korea Society for Neurorehabilitation i
ABSTRACT
Cerebral blood volume (CBV) is a hemodynamic correlate of oxygen metabolism and changes due to neuronal activity. CBV alteration may precede other hemodynamic correlates and provide an early indication of hemodynamic impairment. CBV can be easily quantified using magnetic resonance imaging (MRI); moreover, CBV MRI has a strong point of high resolution compared to other neuroimaging modalities. The early and accurate assessments of cerebral metabolism and the brain map with the high resolution of CBV MRI enable advanced neurorehabilitation examinations in a neuroimaging study.
Keywords: Cerebral Blood Volume; Magnetic Resonance Imaging; Metabolism
INTRODUCTION
Cerebral blood volume (CBV) plays a crucial role as a physiological indicator of tissue viability and vascular reactivity because CBV changes are directly associated with the regulation of blood flow under conditions of both normal and abnormal physiology [1]. CBV magnetic resonance imaging (MRI) has the advantage of providing early and accurate assessments of cerebral metabolism and brain mapping with high resolution. However, CBV MRI has not been used in the field of neurorehabilitation. This article aimed to review the fundamental principle of CBV, the method of quantifying and mapping CBV, the application of CBV MRI for neurorehabilitation, and the caution of CBV MRI.
FUNDAMENTAL PRINCIPLE OF CBV
Devised as a technique for measuring cardiac output by Adolf Eugen Fick, the Fick principle states that an organ must receive blood at a rate equal to the rate at which the organ metabolizes a constituent of blood divided by the concentration of that constituent [2]. The theory of the Fick principle is that blood flow to an organ can be calculated using a marker substance. The Fick principle can be applied to the brain, enabling measurement of cerebral blood flow (CBF) [3]. An increase in neuronal activity results in arterial dilatation, followed by increased supply of oxygenated blood and increased blood flow and volume.
Review
Received: Sep 21, 2018 Accepted: Sep 27, 2018 Correspondence to Suk Hoon Ohn
Department of Physical Medicine and Rehabilitation, Hallym University Sacred Heart Hospital, Hallym University College of Medicine, 22 Gwanpyeong-ro 170-beon-gil, Dongan-gu, Anyang 14068, Korea.
E-mail: [email protected] [email protected] Copyright © 2018. Korea Society for Neurorehabilitation
This is an Open Access article distributed under the terms of the Creative Commons Attribution Non-Commercial License (https://
creativecommons.org/licenses/by-nc/4.0) which permits unrestricted non-commercial use, distribution, and reproduction in any medium, provided the original work is properly cited.
ORCID iDs Suk Hoon Ohn
https://orcid.org/0000-0002-1139-1946 Conflict of Interest
The author has no potential conflicts of interest to disclose.
Suk Hoon Ohn
Department of Physical Medicine and Rehabilitation, Hallym University Sacred Heart Hospital, Hallym University College of Medicine, Anyang, Korea
Cerebral Blood Volume Magnetic
Resonance Imaging
CBF refers to the instantaneous capillary flow in tissues and is coupled directly to the neuronal activity. CBV refers to the blood volume of the capillaries and venules per cerebral tissue volume at a given point time. CBF and CBV are similar hemodynamic correlates of oxygen metabolism; however, the 2 variables are at autoregulation, which is an ability of the brain to maintain constant CBF that is sufficient for cerebral metabolism. CBF may remain constant despite significant decreases in the intraluminal pressure owing to autoregulation.
Increased autoregulatory in arterial CBV may have a role in maintaining sufficient CBF in patients with reduced cerebral perfusion pressure and early-stage steno-occlusive disease of the internal carotid artery [4]. CBV alterations may precede CBF alterations or oxygen extraction fractions. Therefore, CBV alteration could provide an early indication of hemodynamic impairment and early ischemic change [5].
CBV QUANTIFICATION AND MAPPING
CBV quantification has evolved using single-photon emission computed tomography [6], positron emission tomography [7], computed tomography [8], and MRI [9,10] in chronological order. Furthermore, several MRI techniques for measuring CBV have been introduced. First, arterial spin labeling MRI technique enables CBV quantification by comparing images with and without gradient-induced dephasing of blood [11]. Second, inflow vascular-space-occupancy MRI technique is similar to spin labeling approaches and involves the subtraction of images with and without signal contribution from inflowing blood [12]. Third, dynamic susceptibility contrast (DSC) MRI involves subtraction of image with and without contrast, with gadolinium being most commonly used [13]. DSC CBV MRI has an advantage of having very high resolution. Although CBF and blood oxygenation level dependent MRI have 1-millimeter in-plane resolution at most, DSC CBV MRI is currently the only functional MRI (fMRI) with sub-millimeter resolution.
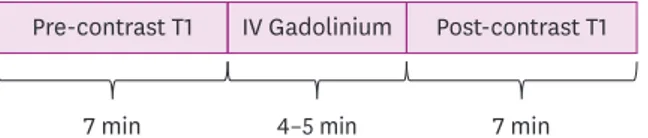
To explain CBV mapping with DSC MRI, I will refer to my previous studies in which CBV was quantified to measure cerebral activity [14,15]. The acquisition of MRI for CBV quantification was based on the previously established steady-state gadolinium-enhanced MRI technique [16,17]. Two high resolution T1-weighted images are acquired before and after injecting a standard intravenous dose of gadolinium contrast agent (0.1 mmol/kg). The “pre” and
“post” contrast scans should be acquired using the exact same head position and same parameters to ensure no scaling differences. There is a small period (usually 4 minutes) after injection before post-contrast scanning to allow the contrast agent to diffuse throughout the circulation (Fig. 1). The scan time should be approximately 7 min/scan; therefore, the total acquisition time should be around 20 minutes.
For the group analysis, 2 structural images from each participant are processed following routines specified in SPM8 (http://www.fil.ion.ucl.ac.uk/spm/). The post-enhanced images are co-registered to the pre-enhanced image, and both images are normalized to a brain
2/5 https://doi.org/10.12786/bn.2018.11.e18
Cerebral Blood Volume Brain & NeuroRehabilitation
https://e-bnr.org
7 min 4–5 min 7 min
Pre-contrast T1 IV Gadolinium Post-contrast T1
Fig. 1. Cerebral blood volume magnetic resonance imaging acquisition. Two high resolution T1-weighted images are acquired before and after injecting a contrast agent. There is a small period after contrast agent injection, prior to post-contrast scanning, to allow the contrast agent to diffuse throughout the circulation.
template. The pre-contrast image is then subtracted from the post-contrast image, and this subtracted image is then divided by the contrast-induced signal difference in the top 4 voxels of the superior sagittal sinus and multiplied by 100 as in the formula below [18]. Image processing ultimately produces a map of relative CBV.
APPLICATION OF CBV MRI FOR NEUROREHABILITATION
The strongest point of CBV MRI is having a high resolution. DSC CBV MRI is currently the only fMRI with sub-millimeter resolution and thus can be used to examine small structures in the brain such as the nucleus of the thalamus, limbic system, hippocampal formation, or brainstem. To observe small changes on the cortex, the cortical unfolding technique is recommended. DSC CBV MRI with the cortical unfolding technique is patronized by an Alzheimer study group that needed a fine structure analysis [17]. This study group distinguished the entorhinal cortex, subiculum, hippocampal subfield, and dentate gyrus in hippocampal formation and showed the detailed differences of CBV in them. Moreover, I previously demonstrated specific CBV changes in patients with phantom limb pain [15]
and mild cognitive impairment following electrical injury [14] with DSC CBV MRI and the cortical unfolding technique. Among patients with phantom limb pain, amputees exhibited significantly higher CBV in the bilateral medial frontal area (orbitofrontal cortex and pregenual anterior cingulate cortex) and significantly lower CBV in the right midcingulate cortex, posterior cingulate cortex, and primary somatosensory cortex. These findings represent increased CBV in regions associated with emotion in the cerebral pain network of patients who underwent unilateral arm amputation after electrical injury. The patients with mild cognitive impairment following electrical injury exhibited a predominant increase in CBV in the cerebellar vermis relative to that of the controls. Correlation analyses revealed a strong association between executive function scores and CBV in the bilateral posterior cingulate cortex and left mammillary body in patients. The CBV maps showed hypermetabolism in the cerebello-limbic system, which reveals a cognitive reserve that protects against deteriorating conditions such as dementia.
CAUTION AND SAFETY
To acquire CBV MRI, we must be careful about the status of the brain-blood barrier and renal function. Extravasation injury after stroke or traumatic brain injury results in the oozing of the contrast out of the injured blood vessel, possibly leading to a miscalculated CBV map.
Gadolinium that is commonly used in CBV MRI is metabolized in the kidney; therefore, blood urea nitrogen, creatinine, and creatinine clearance should be considered before MRI.
CONCLUSION
CBV is a hemodynamic variable that is highly correlated with oxygen metabolism, representing the fraction of cerebral tissue volume occupied by blood at a given time point. CBV MRI has a strong point of providing early and accurate assessments of cerebral
Subtracted image
Difference in the pixel with the highest intensity values measured from sagittal sinus × 100
metabolism and brain mapping with high resolution, and it enables the accurate and advanced study of brain metabolism and plasticity.
REFERENCES
1. Kim SG, Harel N, Jin T, Kim T, Lee P, Zhao F. Cerebral blood volume MRI with intravascular superparamagnetic iron oxide nanoparticles. NMR Biomed 2013;26:949-962.
PUBMED | CROSSREF
2. Selzer A, Sudrann RB. Reliability of the determination of cardiac output in man by means of the Fick principle. Circ Res 1958;6:485-490.
PUBMED | CROSSREF
3. Kety SS, Schmidt CF. The nitrous oxide method for the quantitative determination of cerebral blood flow in man: theory, procedure and normal values. J Clin Invest 1948;27:476-483.
PUBMED | CROSSREF
4. Donahue MJ, Sideso E, MacIntosh BJ, Kennedy J, Handa A, Jezzard P. Absolute arterial cerebral blood volume quantification using inflow vascular-space-occupancy with dynamic subtraction magnetic resonance imaging. J Cereb Blood Flow Metab 2010;30:1329-1342.
PUBMED | CROSSREF
5. Derdeyn CP, Videen TO, Yundt KD, Fritsch SM, Carpenter DA, Grubb RL, Powers WJ. Variability of cerebral blood volume and oxygen extraction: stages of cerebral haemodynamic impairment revisited.
Brain 2002;125:595-607.
PUBMED | CROSSREF
6. Sakai F, Nakazawa K, Tazaki Y, Ishii K, Hino H, Igarashi H, Kanda T. Regional cerebral blood volume and hematocrit measured in normal human volunteers by single-photon emission computed tomography. J Cereb Blood Flow Metab 1985;5:207-213.
PUBMED | CROSSREF
7. Powers WJ, Raichle ME. Positron emission tomography and its application to the study of cerebrovascular disease in man. Stroke 1985;16:361-376.
PUBMED | CROSSREF
8. Steiger HJ, Aaslid R, Stooss R. Dynamic computed tomographic imaging of regional cerebral blood flow and blood volume. A clinical pilot study. Stroke 1993;24:591-597.
PUBMED | CROSSREF
9. Østergaard L, Smith DF, Vestergaard-Poulsen P, Hansen SB, Gee AD, Gjedde A, Gyldensted C. Absolute cerebral blood flow and blood volume measured by magnetic resonance imaging bolus tracking:
comparison with positron emission tomography values. J Cereb Blood Flow Metab 1998;18:425-432.
PUBMED | CROSSREF
10. Villringer A, Rosen BR, Belliveau JW, Ackerman JL, Lauffer RB, Buxton RB, Chao YS, Wedeen VJ, Brady TJ. Dynamic imaging with lanthanide chelates in normal brain: contrast due to magnetic susceptibility effects. Magn Reson Med 1988;6:164-174.
PUBMED | CROSSREF
11. Kim T, Kim SG. Quantification of cerebral arterial blood volume and cerebral blood flow using MRI with modulation of tissue and vessel (MOTIVE) signals. Magn Reson Med 2005;54:333-342.
PUBMED | CROSSREF
12. Donahue MJ, Lu H, Jones CK, Edden RA, Pekar JJ, van Zijl PC. Theoretical and experimental investigation of the VASO contrast mechanism. Magn Reson Med 2006;56:1261-1273.
PUBMED | CROSSREF
13. Gückel F, Brix G, Rempp K, Deimling M, Röther J, Georgi M. Assessment of cerebral blood volume with dynamic susceptibility contrast enhanced gradient-echo imaging. J Comput Assist Tomogr 1994;18:344-351.
PUBMED
14. Park CH, Seo CH, Jung MH, Joo SY, Jang S, Lee HY, Ohn SH. Investigation of cognitive circuits using steady-state cerebral blood volume and diffusion tensor imaging in patients with mild cognitive impairment following electrical injury. Neuroradiology 2017;59:915-921.
PUBMED | CROSSREF
15. Seo CH, Park CH, Jung MH, Jang S, Joo SY, Kang Y, Ohn SH. Preliminary investigation of pain-related changes in cerebral blood volume in patients with phantom limb pain. Arch Phys Med Rehabil 2017;98:2206-2212.
PUBMED | CROSSREF
4/5 https://doi.org/10.12786/bn.2018.11.e18
Cerebral Blood Volume Brain & NeuroRehabilitation
https://e-bnr.org
16. Moreno H, Wu WE, Lee T, Brickman A, Mayeux R, Brown TR, Small SA. Imaging the Aβ-related neurotoxicity of Alzheimer disease. Arch Neurol 2007;64:1467-1477.
PUBMED | CROSSREF
17. Schobel SA, Chaudhury NH, Khan UA, Paniagua B, Styner MA, Asllani I, Inbar BP, Corcoran CM, Lieberman JA, Moore H, Small SA. Imaging patients with psychosis and a mouse model establishes a spreading pattern of hippocampal dysfunction and implicates glutamate as a driver. Neuron 2013;78:81- 93.
PUBMED | CROSSREF
18. Reitz C, Brickman AM, Brown TR, Manly J, DeCarli C, Small SA, Mayeux R. Linking hippocampal structure and function to memory performance in an aging population. Arch Neurol 2009;66:1385-1392.
PUBMED | CROSSREF