Endocrinol Metab 2014;29:418-426
http://dx.doi.org/10.3803/EnM.2014.29.4.418 pISSN 2093-596X · eISSN 2093-5978
Review Article
Optimal Waist Circumference Cutoff Values for the Diagnosis of Abdominal Obesity in Korean Adults
Yeong Sook Yoon1, Sang Woo Oh2
1Department of Family Medicine, Inje University Ilsan Paik Hospital, Inje University College of Medicine; 2Department of Family Medicine, Center for Obesity, Metabolism and Nutrition, Dongguk University Ilsan Hospital, Dongguk University College of Medicine, Goyang, Korea
Abdominal obesity is associated closely with insulin resistance, diabetes, and cardiovascular disease. Waist circumference (WC) is a useful surrogate marker commonly used for abdominal adiposity. The determination of WC cutoff levels is important in the pre- vention and treatment of obesity, type 2 diabetes, and related cardiovascular diseases. Recent epidemiological evidence suggested that appropriate optimal cutoffs for Koreans ranged over 80 to 89.8 cm in males and 76.1 to 86.5 cm in females. We analyzed the data from two large cohorts using receiver operating characteristic curve analysis with the incidences of diabetes, hypertension, dyslipidemia, cerebrovascular disease, myocardial infarct, angina, coronary artery disease, and multiple metabolic risk factors as outcome variables. Optimal WC cutoff points for Koreans were 85 cm in males and 80 cm in females. However, considering the prevalence of abdominal obesity and the health costs for its prevention and management, 90 cm in males and 85 cm in females are probably more appropriate thresholds for abdominal obesity. These values may be modified once better research is performed through prospective studies using representative populations, common health outcomes, and proper analytical approaches.
Keywords: Obesity, abdominal; Waist circumference; Metabolic syndrome; Cohort studies; ROC curve; Sensitivity and specificity
INTRODUCTION
Malignant neoplasms, cerebrovascular disease, heart disease, and diabetes have been the major causes of mortality in Korea over the last 10 years [1]. All of these are closely related to an obesity epidemic. The body mass index (BMI) is the most wide- ly used method for the diagnosis of obesity and is correlated directly with the risk of comorbidities and mortality. Evidence from epidemiological studies has demonstrated the importance of body fat distribution and the strong association of excess ab- dominal fat with insulin resistance, dyslipidemia, hyperten- sion, and diabetes, and their essential roles in the pathogenesis
of cardiovascular disease, metabolic syndrome, and certain cancers. However, BMI has important limitations, because it neither discriminates fat from lean mass nor fully reflects the distribution of body fat. Waist circumference (WC) has been commonly used as a simple and clinically useful surrogate marker for central adiposity. The determination of WC cutoff values is important in the prevention and treatment of obesity, type 2 diabetes, and related cardiovascular diseases.
This review focused on the current WC cutoff levels used in different ethnic groups and Koreans and suggested optimal WC cutoff values to identify abdominal obesity and predict disease risk in Koreans based on the analysis of large cohort data.
Corresponding author: Sang Woo Oh
Department of Family Medicine, Center for Obesity, Metabolism and Nutrition.
Dongguk University Ilsan Hospital, Dongguk University College of Medicine, 27 Dongguk-ro, Ilsandong-gu, Goyang 410-773, Korea
Tel: +82-31-961-7495, Fax: +82-31-961-7496, E-mail: [email protected]
Copyright © 2014 Korean Endocrine Society
This is an Open Access article distributed under the terms of the Creative Com- mons Attribution Non-Commercial License (http://creativecommons.org/
licenses/by-nc/3.0/) which permits unrestricted non-commercial use, distribu- tion, and reproduction in any medium, provided the original work is properly cited.
CURRENT THRESHOLDS FOR
ABDOMINAL OBESITY IN DIFFERENT POPULATIONS/ETHNIC GROUPS
Abdominal obesity is highly correlated to insulin resistance.
Because abdominal obesity was a major component of meta- bolic syndrome in the National Cholesterol Education Program Adult Treatment Panel III (NCEP ATP III) [2], the determina- tion of the WC cutoff level to identify abdominal obesity has been performed by numerous organizations [3-12]. In the 2001 NCEP ATP III guidelines, abdominal obesity was defined as a WC ≥102 cm in males and ≥88 cm in females [3,13]. Howev- er, these cutoffs corresponded to BMI values of 30 kg/m2 based on studies performed in populations of European origin [14].
The International Diabetes Federation consensus proposed ethnicity-specific WC cutoff values, which have been incorpo- rated into the definition of metabolic syndrome [15,16]. Like- wise, the 2005 revised NCEP criteria proposed by the Ameri- can Heart Association/National Heart, Lung, and Blood Insti- tute [4] indicated a minor lowering of the WC cutoff levels to
≥90 and ≥80 cm in males and females, respectively, which appeared to be appropriate for Asian Americans.
WC thresholds for abdominal obesity are not uniformly ap- plicable to all populations and ethnic groups, because varia- tions in disease risk may occur with the same WC in different ethnic groups. The 2009 joint statement harmonizing metabol- ic syndrome recommended the use of ethnicity-specific WC
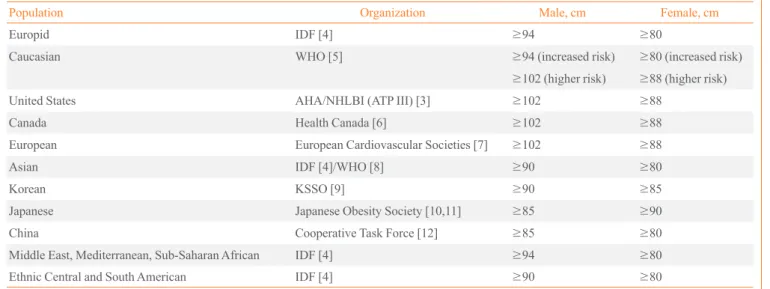
thresholds. Table 1 lists WC thresholds recommended for dif- ferent populations and ethnic groups.
CHANGES IN WC CUTOFF LEVELS FOR ABDOMINAL OBESITY IN THE KOREAN POPULATION
Until 2005, WC thresholds of ≥90 cm (36 inches) in males and
≥80 cm (32 inches) in females were used as the diagnostic cri- teria for abdominal obesity in Korea. These were determined from results that obesity-related disorders may begin to in- crease rapidly from a WC of 90 to 92 cm (36 inches) in males and from 80 to 82 cm (30 inches) in females. These were in ac- cordance with the definition from the 2000 Western Pacific Re- gion of the World Health Organization, International Associa- tion for the Study of Obesity, and International Obesity Task- force guidelines based on epidemiological data from Chinese living in Hong Kong and Singapore [5]. These criteria raised several issues, and re-evaluation of the threshold for abdominal obesity criteria was required. In brief, the cutoff level of 80 cm in females was considered to be low and very near to the mean WC of 78.31 cm according to the 1998 National Health and Nutrition Examination Survey of Korean females. Further- more, the 40.3% prevalence of obesity in females was relative- ly high compared with the 19.9% morbidity in males [17].
In 2006, the Korea Society for the Study of Obesity updated the WC cutoff levels for defining abdominal obesity to 90 cm
Table 1. Current Recommended Waist Circumference Thresholds for Abdominal Obesity
Population Organization Male, cm Female, cm
Europid IDF [4] ≥94 ≥80
Caucasian WHO [5] ≥94 (increased risk) ≥80 (increased risk)
≥102 (higher risk) ≥88 (higher risk)
United States AHA/NHLBI (ATP III) [3] ≥102 ≥88
Canada Health Canada [6] ≥102 ≥88
European European Cardiovascular Societies [7] ≥102 ≥88
Asian IDF [4]/WHO [8] ≥90 ≥80
Korean KSSO [9] ≥90 ≥85
Japanese Japanese Obesity Society [10,11] ≥85 ≥90
China Cooperative Task Force [12] ≥85 ≥80
Middle East, Mediterranean, Sub-Saharan African IDF [4] ≥94 ≥80
Ethnic Central and South American IDF [4] ≥90 ≥80
IDF, International Diabetes Federation; WHO, World Health Organization; AHA, American Heart Association; NHLBI, National Heart, Lung, and Blood Institute; ATP III, Adult Treatment Panel III; KSSO, Korean Society for the Study of Obesity.
in males and 85 cm in females [18]. These cutoffs were defined by receiver operating characteristics (ROC) curve analysis, odds ratios, and the prevalence of abdominal obesity based on representative sample data from the 1998 Korean National Health and Nutrition Examination Survey [18]. The WC cutoff levels in Koreans using ROC curve analysis for two or more metabolic syndrome risk factors as a reference were 82 to 84 cm in males and 79 to 82 cm in females. The odds ratio of hav- ing more than two metabolic abnormalities was approximately 5 in males and females with a WC ≥90 and ≥80 cm, respec-
tively. WC values in the 80th percentile in the Korean popula- tion were 90 and 86.5 cm in males and females, respectively.
There have been numerous studies attempting to identify the optimal WC cutoff in the Korean population since 2006 [19-29].
Table 2 shows those studies that proposed thresholds for ab- dominal obesity in Koreans [19-27,29]. The range of optimal WC cutoffs were determined to be 80 to 89.8 cm in males and 76.1 to 86.5 cm in females. However, most studies were cross- sectional in design [19,20,22-24,26-29], which have an inher- ent shortcoming potentially leading to incorrect conclusions re-
Table 2. Studies Evaluating Suggested Thresholds for Abdominal Obesity in Koreans
Study Population Design Represen
tative
sample Outcome Methods for optimizing sensitivity and specificity
Optimal waist circumference cutoffs,
cm Lee et al.
(2013) [19] 3,103 Females (premenopause, n=1,745; postmenopause n=1,358); 2007 KNHANES
Cross- sectional design
Yes ≥2 Metabolic
risk factors Maximum values of
the Youden index Premenopause, 76.1;
Postmenopause, 82.5 Lim et al.
(2012) [20] 294 Males, 313 females; ≥65 years; Korean Longitudinal Study on Health and Aging cohort
Cross- sectional design
No ≥2 Metabolic
risk factors (1) Shortest distance on ROC curve (2) Maximum values of the Youden index
(1) M, 87.4; F, 84.7 (2) M, 87.4; F, 84.7
Ko et al.
(2012) [21] 3,857 Participants; ≥40 years;
Ansung-Ansan cohort Cohort
design No ≥2 Metabolic risk factors during 6-year follow-up
Maximum values of
the Youden index M, 80; F, 78 Yoo et al.
(2010) [22] 591 Participants; 20–88 years;
Korea Science and Engineering Foundation cohort
Cross- sectional design
No Nonalcoholic fatty
liver disease Maximum values of
the Youden index M, 89; F, 84 Park et al.
(2010) [23] 8,817 Subjects; ≥40 years; Chungju Metabolic Disease Cohort Cross-
sectional design
No Insulin resistance Maximum values of
the Youden index M, 84.4; F, 80.6 Koh et al.
(2010) [24] 1,437 Males, 2,071 females; Korean Rural Genomic Research Cohort Study
Cross- sectional design
No Insulin resistance;
≥2 metabolic risk factors
Maximum values of
the Youden index Insulin resistance:
M, 87; F, 83
≥2 Metabolic risk factors: M, 86; F, 83 Choi et al.
(2010) [25] 2,947 Males, 3,259 females;
Ansung-Ansan cohort Cohort
design No Incidence diabetes during 4-year fol low-up
Shortest distance on
ROC curve M, 85; F, 80 Seo et al.
(2009) [26] 308 Males, 381 females,
≥63 years; Ansan Geriatric Study Cross- sectional design
No ≥2 Metabolic risk
factors Shortest distance on
ROC curve M, 86.5; F, 86.5 Baik et al.
(2009) [27] 1,995 Males, 2,682 females;
20–80 years; KNHANES III Cross- sectional design
No ≥2 Metabolic risk factors; ≥20%
CHD risk score by Framingham risk equation
(1) Maximum values of the Youden index (2) Shortest distance on ROC curve
≥2 Metabolic risk:
(1) M, 85; F, 78;
(2) M, 86; F, 79
≥20% CHD risk score: (1) M, 85;
(2) M, 84 Kim et al.
(2006) [29] 174 Males, 239 females; National Research Laboratory of Clinical Nutrigenetics and Nutrigenomics in Yonsei University.
Cross- sectional design
No ≥2 Metabolic risk
factors Maximum of sensitivity
and specificity M, 89.8; F, 86.1
KNHANES, The Korea National Health and Nutrition Examination Survey; ROC, receiver-operating characteristic; CHD, coronary heart disease.
garding the relationship between obesity and disease. Further prospective studies using representative populations, common health outcomes, and proper analytical approaches are needed to identify optimal cutoff levels.
OPTIMAL WC CUTOFF LEVELS TO IDENTIFY ABDOMINAL OBESITY USING THE ANSUNG-ANSAN AND NATIONAL HEALTH INSURANCE CORPORATION COHORTS
We analyzed the data from two large cohorts using ROC curve
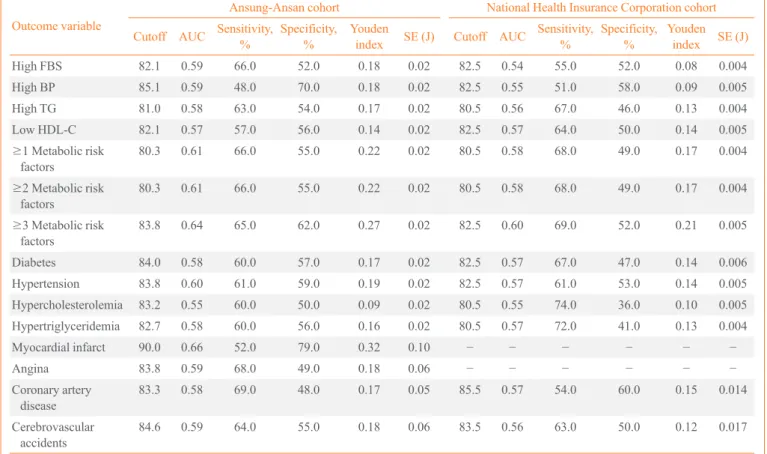
analysis to maximize the sensitivity and specificity for identi- fying optimal WC cutoff levels and to overcome the limitations of a cross-sectional design. The outcome variables were inci- dence of diabetes, hypertension, dyslipidemia, cerebrovascular disease, myocardial infarct, angina, coronary artery disease, and multiple metabolic risk factors. Tables 3, 4 show the area under the curve and optimal cutoff levels with corresponding validity parameters for WC in predicting different types of obesity-related diseases in males and females, respectively.
Among males, the optimal WC cutoff points identifying the presence of two or more metabolic risk factors were 80.3 and 80.5 cm in the Ansung-Ansan and National Health Insurance
Table 3. Area Under the Receiver-Operating Characteristic Curve, Optimal Cutoff Values, and Validity Parameters Predicting Obesi- ty-Related Diseases in Males
Outcome variable
Ansung-Ansan cohort National Health Insurance Corporation cohort Cutoff AUC Sensitivity, % Specificity,
% Youden
index SE (J) Cutoff AUC Sensitivity, % Specificity,
% Youden
index SE (J)
High FBS 82.1 0.59 66.0 52.0 0.18 0.02 82.5 0.54 55.0 52.0 0.08 0.004
High BP 85.1 0.59 48.0 70.0 0.18 0.02 82.5 0.55 51.0 58.0 0.09 0.005
High TG 81.0 0.58 63.0 54.0 0.17 0.02 80.5 0.56 67.0 46.0 0.13 0.004
Low HDL-C 82.1 0.57 57.0 56.0 0.14 0.02 82.5 0.57 64.0 50.0 0.14 0.005
≥1 Metabolic risk
factors 80.3 0.61 66.0 55.0 0.22 0.02 80.5 0.58 68.0 49.0 0.17 0.004
≥2 Metabolic risk
factors 80.3 0.61 66.0 55.0 0.22 0.02 80.5 0.58 68.0 49.0 0.17 0.004
≥3 Metabolic risk
factors 83.8 0.64 65.0 62.0 0.27 0.02 82.5 0.60 69.0 52.0 0.21 0.005
Diabetes 84.0 0.58 60.0 57.0 0.17 0.02 82.5 0.57 67.0 47.0 0.14 0.006
Hypertension 83.8 0.60 61.0 59.0 0.19 0.02 82.5 0.57 61.0 53.0 0.14 0.005
Hypercholesterolemia 83.2 0.55 60.0 50.0 0.09 0.02 80.5 0.55 74.0 36.0 0.10 0.005
Hypertriglyceridemia 82.7 0.58 60.0 56.0 0.16 0.02 80.5 0.57 72.0 41.0 0.13 0.004
Myocardial infarct 90.0 0.66 52.0 79.0 0.32 0.10 − − − − − −
Angina 83.8 0.59 68.0 49.0 0.18 0.06 − − − − − −
Coronary artery
disease 83.3 0.58 69.0 48.0 0.17 0.05 85.5 0.57 54.0 60.0 0.15 0.014
Cerebrovascular
accidents 84.6 0.59 64.0 55.0 0.18 0.06 83.5 0.56 63.0 50.0 0.12 0.017
High fasting blood sugar (FBS) was diagnosed when the FBS was ≥100 mg/dL or the subject was receiving glucose-lowering medications. High blood pressure (BP) was diagnosed when the systolic BP was ≥130 mm Hg, diastolic BP was ≥85 mm Hg, or the subject was receiving antihyper- tensive medications. High triglycerides (TG) were diagnosed when the TG level was ≥150 mg/dL. Low high density lipoprotein cholesterol (HDL- C) was diagnosed when the HDL-C level was 40 mg/dL. Metabolic risk factors included high BP, high FBS, high TG, and low HDL-C of the modi- fied National Cholesterol Education Program Adult Treatment Panel III criteria other than waist circumference. Hypertension was diagnosed when the systolic BP was ≥140 mm Hg, diastolic BP was ≥90 mm Hg, or the subjects were receiving antihypertensive medications. Diabetes was diag- nosed when the FBS was ≥100 mg/dL, 2-hour postprandial blood sugar was ≥200 mg/dL, or the subjects were receiving glucose-lowering medica- tions. Hypercholesterolemia was diagnosed when the total cholesterol was ≥200 mg/dL. Hypertriglyceridemia was diagnosed when the TG level was ≥200 mg/dL.
AUC, area under the curve; SE, standard error.
Corporation (NHIC) cohorts, respectively. The optimal cutoff values for identifying the incidence of diabetes, hypertension, hypercholesterolemia, and hypertriglyceridemia were 84.0, 83.8, 83.2, and 82.7 cm, respectively, in the Ansung-Ansan co- hort. These results were similar to those from the NHIC cohort.
An area under the curve value of 0.66 for a WC of 90 cm iden- tified myocardial infarction with a corresponding 52% sensitiv- ity and 79% specificity. The optimal cutoffs for identifying cor- onary artery disease and cardiovascular accident (CVA) were 83.3 and 84.6 cm, respectively, in the Ansung-Ansan cohort, and 85.5 and 83.5 cm, respectively, in the NHIC cohort. Among
females, the optimal cutoff values for predicting various types of obesity-related diseases, including high levels of fasting blood glucose, high blood pressure, high triglyceride, and low high density lipoprotein cholesterol, and at least one, two, or three metabolic risk factors, diabetes, hypertension, hypercho- lesterolemia, hypertriglyceridemia, angina, and coronary artery disease, ranged from 73.4 to 81.7 cm in the Ansung-Ansan co- hort and 73.5 to 77.5 cm in the NHIC cohort. These values were approximately 5 cm less than those in males. According to the Ansung-Ansan cohort, the optimal cutoff levels for myocardial infarct and CVA (84.9 and 85.9 cm, respectively) were higher Table 4. Area Under the Receiver-Operating Characteristic Curve, Optimal Cutoff Points, and Validity Parameters Predicting Obesi- ty-Related Disease in Females
Outcome variable
Ansung-Ansan cohort National Health Insurance Corporation cohort Cutoff AUC Sensitivity, % Specificity,
% Youden
index SE (J) Cutoff AUC Sensitivity, % Specificity,
% Youden
index SE (J)
High FBS 81.7 0.62 64.0 60.0 0.24 0.02 75.5 0.56 55.0 58.0 0.13 0.005
High BP 79.3 0.61 65.0 57.0 0.22 0.02 74.5 0.59 57.0 61.0 0.19 0.005
High TG 80.5 0.56 67.0 46.0 0.13 0.00 75.5 0.60 61.0 58.0 0.19 0.005
Low HDL-C 73.4 0.58 75.0 42.0 0.17 0.03 73.5 0.58 66.0 49.0 0.15 0.005
≥1 Metabolic
risk factors 75.6 0.62 74.0 51.0 0.25 0.02 74.5 0.63 65.0 61.0 0.26 0.005
≥2 Metabolic
risk factors 75.6 0.62 74.0 51.0 0.25 0.02 74.5 0.63 65.0 61.0 0.26 0.005
≥3 Metabolic
risk factors 79.0 0.64 74.0 54.0 0.28 0.02 75.5 0.66 75.0 56.0 0.32 0.006
Diabetes 78.2 0.59 74.0 43.0 0.17 0.02 77.5 0.63 65.0 62.0 0.27 0.009
Hypertension 80.4 0.61 63.0 59.0 0.22 0.02 75.5 0.63 65.0 61.0 0.26 0.006
Hypercholesterolemia 77.3 0.54 71.0 37.0 0.08 0.02 74.5 0.57 65.0 50.0 0.15 0.006
Hypertriglyceridemia 75.6 0.59 82.0 35.0 0.18 0.02 75.5 0.61 68.0 54.0 0.21 0.007
HDL-C <40 78.1 0.59 68.0 50.0 0.17 0.02 75.5 0.60 67.0 52.0 0.19 0.008
Myocardial infarct 84.9 0.67 70.0 64.0 0.34 0.10 − − − − − −
Angina 79.4 0.60 77.0 44.0 0.21 0.05 − − − − − −
Coronary artery
disease 79.4 0.62 80.0 44.0 0.24 0.04 76.5 0.62 69.0 56.0 0.25 0.015
Cerebrovascular
accidents 85.9 0.55 43.0 67.0 0.10 0.08 77.5 0.62 66.0 59.0 0.25 0.019
High fasting blood sugar (FBS) was diagnosed when the FBS was ≥100 mg/dL or the subjects were receiving glucose-lowering medications. High blood pressure (BP) was diagnosed when the systolic BP was ≥130 mm Hg, diastolic BP was ≥85 mm Hg, or the subjects were receiving antihyper- tensive medications. High triglycerides (TG) were diagnosed when the TG level was ≥150 mg/dL. Low high density lipoprotein cholesterol (HDL- C) was diagnosed when the HDL-C level was <50 mg/dL. Metabolic risk factors included high BP, high FBS, high TG, and low HDL-C of the modi- fied National Cholesterol Education Program Adult Treatment Panel III criteria other than waist circumference. Hypertension was diagnosed when the systolic BP was ≥140 mm Hg, diastolic BP was ≥90 mm Hg, or the subjects were receiving antihypertensive medications. Diabetes was diag- nosed when the FBS was ≥100 mg/dL, 2-hour postprandial blood sugar was ≥200 mg/dL, or the subjects were receiving glucose-lowering medica- tions. Hypercholesterolemia was diagnosed when the total cholesterol was ≥200 mg/dL. Hypertriglyceridemia was diagnosed when the TG was ≥ 200 mg/dL.
AUC, area under the curve; SE, standard error.
than those used to predict other diseases. Based on the above results, the optimal cutoff values for diagnosing abdominal obesity in males and females were approximately 85 and 80 cm, respectively.
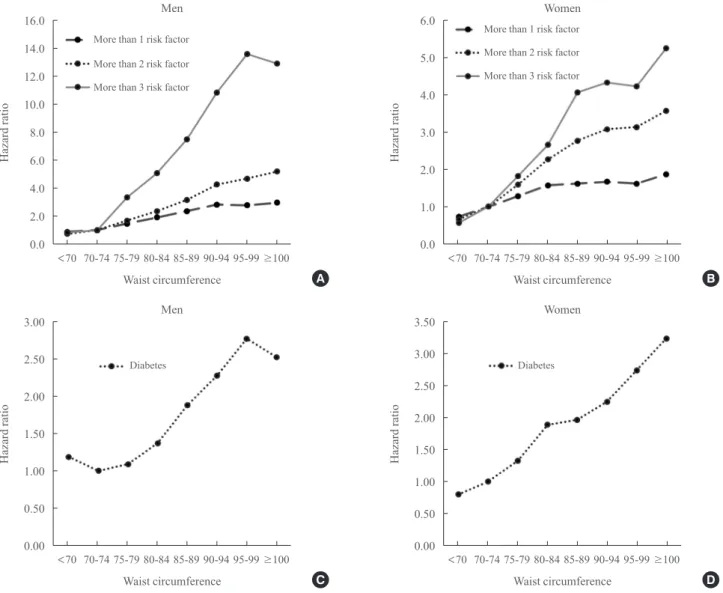
We performed a Cox proportional hazard analysis to calcu- late the hazard ratio (HR) for having metabolic risk factors or an incidence of diabetes for different WC cutoff values. Fig. 1 shows the HRs for the incidences of one, two, three, or more metabolic risk factors and for the incidence of diabetes for a 5-cm increase in the WC according to the Ansung-Ansan co- hort. The risks of having one, two, three, or more metabolic risk factors were significantly increased with increasing WC.
The HRs and 95% confidence intervals (CI) from the lowest to the highest 5-cm interval WC category (5-cm interval category
from <70 to ≥100 cm) for males were 0.88, 1.00, 1.46, 1.90, 2.34, 2.81, 2.76, and 2.95, respectively, (95% CI, 2.24 to 3.88) for the development of one or more metabolic risk factors;
0.73, 1.00, 1.67, 2.35, 3.15, 4.23, 4.66, and 5.16, respectively, (95% CI, 3.78 to 7.04) for the development of two or more metabolic risk factors; and 0.83, 1.00, 3.31, 5.04, 7.44, 10.76, 13.50, and 12.81, respectively, (95% CI, 7.65 to 21.45) for the development of three or more metabolic risk factors (all P<0.001 for trend). Females displayed similar HR trends for the development of one, two, three, or more metabolic risk fac- tors. The HRs for the incidence of diabetes were significantly increased from WC cutoff values of ≥85 cm for males (HR, 1.89; 95% CI, 1.32 to 2.70; P<0.001) and ≥80 cm for females (HR, 1.89; 95% CI, 1.37 to 2.60; P<0.001).
Fig. 1. Hazard ratios for the development of one or more metabolic risk factors or incidence of diabetes for a 5-cm increase in the waist circumference. (A) Men, ≥1, 2, or 3 metabolic risk factors. (B) Women, ≥1, 2, or 3 metabolic risk factors. (C) Men, diabetes mellitus.
(D) Women, diabetes mellitus.
16.0 14.0 12.0 10.0 8.0 6.0 4.0 2.0 0.0
Hazard ratio
<70 70-74 75-79 80-84 85-89 90-94 95-99 ≥100 Waist circumference
Men
More than 1 risk factor More than 2 risk factor More than 3 risk factor
A
3.00
2.50
2.00
1.50
1.00
0.50
0.00
Hazard ratio
<70 70-74 75-79 80-84 85-89 90-94 95-99 ≥100 Waist circumference
Men
Diabetes
C
6.0
5.0
4.0
3.0
2.0
1.0
0.0
3.50 3.00 2.50 2.00 1.50 1.00 0.50 0.00
Hazard ratioHazard ratio
<70 70-74 75-79 80-84 85-89 90-94 95-99 ≥100
<70 70-74 75-79 80-84 85-89 90-94 95-99 ≥100 Waist circumference
Waist circumference Women
Women More than 1 risk factor More than 2 risk factor More than 3 risk factor
B
D Diabetes
The prevalence of abdominal obesity varied depending on the selected WC cutoff values (Table 5). According to the Ko- rea National Health and Nutrition Examination IV data, the prevalence of abdominal obesity was 46.3% when a WC cutoff
≥85 cm was used to diagnose abdominal obesity in males and 41.6% when a WC cutoff ≥80 cm was used in females (Table 5). It is of interest that ≥60% of females aged ≥50 years were abdominally obese when 80 cm was applied as the WC cutoff level. Otherwise, the prevalence of abdominal obesity was 25.4% in males and 25.0% in females when WC values of 90 and 85 cm, respectively, were applied for the definition of ab- dominal obesity.
CONCLUSIONS
The optimal WC cutoff value determined should be that which can identify populations at a predefined level of risk of future health problems consistently. The optimal WC cutoff levels were 85 cm in males and 80 cm in females, based on data from large prospective cohorts using various health outcomes. How- ever, when considering the prevalence of abdominal obesity and the health costs for its prevention and management, WC of
90 cm in males and 85 cm in females are probably more appro- priate thresholds for abdominal obesity.
CONFLICTS OF INTEREST
No potential conflict of interest relevant to this article was re- ported.
ACKNOWLEDGEMENT
We thank the National Health Insurance Corporation and Ko- rea Centers for Disease Control and Prevention for providing the cohort data.
REFERENCES
1. Statistics Korea. 2013 Causes of Death Statistics [Internet].
Daejeon: Statistics Korea; c2008 [cited 2014 Dec 8].
Available from: http://www.index.go.kr.
2. National Cholesterol Education Program (NCEP) Expert Panel on Detection, Evaluation, and Treatment of High Blood Cholesterol in Adults (Adult Treatment Panel III).
Third Report of the National Cholesterol Education Pro- gram (NCEP) Expert Panel on Detection, Evaluation, and Treatment of High Blood Cholesterol in Adults (Adult Treatment Panel III) final report. Circulation 2002;106:
3143-421.
3. National Institutes of Health. Clinical guidelines on the identification, evaluation, and treatment of overweight and obesity in adults: the evidence report. Obes Res 1998;6 Suppl 2:51S-209S.
4. Grundy SM, Cleeman JI, Daniels SR, Donato KA, Eckel RH, Franklin BA, Gordon DJ, Krauss RM, Savage PJ, Smith SC Jr, Spertus JA, Costa F; American Heart Associa- tion; National Heart, Lung, and Blood Institute. Diagnosis and management of the metabolic syndrome: an American Heart Association/National Heart, Lung, and Blood Insti- tute Scientific Statement. Circulation 2005;112:2735-52.
5. World Health Organization. Obesity: preventing and man- aging the global epidemic. Geneva: World Health Organi- zation; 2000. p. 256.
6. Khan NA, McAlister FA, Rabkin SW, Padwal R, Feldman RD, Campbell NR, Leiter LA, Lewanczuk RZ, Schiffrin EL, Hill MD, Arnold M, Moe G, Campbell TS, Herbert C, Milot A, Stone JA, Burgess E, Hemmelgarn B, Jones C, Larochelle P, Ogilvie RI, Houlden R, Herman RJ, Hamet P, Table 5. Prevalence of Abdominal Obesity according to Differ-
ent Cutoff Values by Sex and Age Using Data from NHANES 2007 to 2009
Variable Cutoff value of waist circumference, cm
70 75 80 85 90 95 100
Male, yr
20−29 92.9 73.0 50.1 31.0 17.1 9.6 4.2 30−39 95.3 84.2 68.1 43.4 22.9 9.9 4.0 40−49 96.0 87.5 73.5 51.2 28.0 11.1 3.6 50−59 98.0 92.2 78.0 55.4 30.7 11.6 4.4 60−69 96.1 89.9 77.1 57.7 31.4 12.0 3.9
≥70 90.8 81.4 65.7 45.7 28.4 11.3 4.1
Total 95.2 84.4 68.1 46.3 25.4 10.7 4.0 Female, yr
20−29 56.5 35.2 18.8 10.3 6.0 3.2 1.7
30−39 71.4 48.0 27.1 14.6 7.6 4.2 1.9
40−49 82.9 60.5 38.1 19.6 8.8 3.8 2.3
50−59 92.7 77.6 57.8 35.1 17.2 7.4 2.3 60−69 95.3 87.7 71.8 48.7 28.1 11.9 3.6
≥70 89.9 78.4 61.2 42.5 25.3 12.6 4.3
Total 79.3 60.8 41.6 25.0 13.3 6.2 2.3
Fodor G, Carruthers G, Culleton B, Dechamplain J, Pylyp- chuk G, Logan AG, Gledhill N, Petrella R, Tobe S, Touyz RM; Canadian Hypertension Education Program. The 2006 Canadian Hypertension Education Program recommenda- tions for the management of hypertension: part II: therapy.
Can J Cardiol 2006;22:583-93.
7. Graham I, Atar D, Borch-Johnsen K, Boysen G, Burell G, Cifkova R, Dallongeville J, De Backer G, Ebrahim S, Gjelsvik B, Herrmann-Lingen C, Hoes A, Humphries S, Knapton M, Perk J, Priori SG, Pyorala K, Reiner Z, Ruilope L, Sans-Menendez S, Op Reimer WS, Weissberg P, Wood D, Yarnell J, Zamorano JL; ESC Committee for Practice Guidelines. European guidelines on cardiovascular disease prevention in clinical practice: executive summary. Athero- sclerosis 2007;194:1-45.
8. Hara K, Matsushita Y, Horikoshi M, Yoshiike N, Yokoya- ma T, Tanaka H, Kadowaki T. A proposal for the cutoff point of waist circumference for the diagnosis of metabolic syndrome in the Japanese population. Diabetes Care 2006;
29:1123-4.
9. Lee SY, Park HS, Kim DJ, Han JH, Kim SM, Cho GJ, Kim DY, Kwon HS, Kim SR, Lee CB, Oh SJ, Park CY, Yoo HJ.
Appropriate waist circumference cutoff points for central obesity in Korean adults. Diabetes Res Clin Pract 2007;
75:72-80.
10. Oka R, Kobayashi J, Yagi K, Tanii H, Miyamoto S, Asano A, Hagishita T, Mori M, Moriuchi T, Kobayashi M, Katsu- da S, Kawashiri MA, Nohara A, Takeda Y, Mabuchi H, Ya- magishi M. Reassessment of the cutoff values of waist cir- cumference and visceral fat area for identifying Japanese subjects at risk for the metabolic syndrome. Diabetes Res Clin Pract 2008;79:474-81.
11. Examination Committee of Criteria for ‘Obesity Disease’
in Japan; Japan Society for the Study of Obesity. New cri- teria for ‘obesity disease’ in Japan. Circ J 2002;66:987-92.
12. Zhou BF; Cooperative Meta-Analysis Group of the Work- ing Group on Obesity in China. Predictive values of body mass index and waist circumference for risk factors of cer- tain related diseases in Chinese adults: study on optimal cut-off points of body mass index and waist circumference in Chinese adults. Biomed Environ Sci 2002;15:83-96.
13. Expert Panel on the Identification, Evaluation, and Treat- ment of Overweight in Adults. Clinical guidelines on the identification, evaluation, and treatment of overweight and obesity in adults: executive summary. Am J Clin Nutr 1998;
68:899-917.
14. Lean ME, Han TS, Morrison CE. Waist circumference as a measure for indicating need for weight management. BMJ 1995;311:158-61.
15. Alberti KG, Zimmet P, Shaw J; IDF Epidemiology Task Force Consensus Group. The metabolic syndrome: a new worldwide definition. Lancet 2005;366:1059-62.
16. Alberti KG, Eckel RH, Grundy SM, Zimmet PZ, Cleeman JI, Donato KA, Fruchart JC, James WP, Loria CM, Smith SC Jr; International Diabetes Federation Task Force on Epidemiology and Prevention; Hational Heart, Lung, and Blood Institute; American Heart Association; World Heart Federation; International Atherosclerosis Society; Interna- tional Association for the Study of Obesity. Harmonizing the metabolic syndrome: a joint interim statement of the International Diabetes Federation Task Force on Epidemi- ology and Prevention; National Heart, Lung, and Blood Institute; American Heart Association; World Heart Feder- ation; International Atherosclerosis Society; and Interna- tional Association for the Study of Obesity. Circulation 2009;120:1640-5.
17. Khang YH, Yun SC. Trends in general and abdominal obe- sity among Korean adults: findings from 1998, 2001, 2005, and 2007 Korea National Health and Nutrition Examina- tion Surveys. J Korean Med Sci 2010;25:1582-8.
18. Lee S, Park HS, Kim SM, Kwon HS, Kim DY, Kim DJ, Cho GJ, Han JH, Kim SR, Park CY, Oh SJ, Lee CB, Kim KS, Oh SW, Kim YS, Choi WH, Yoo HJ. Cut-off points of waist circumference for defining abdominal obesity in the Korean population. Korean J Obes 2006;15:1-9.
19. Lee OG, Hur YI, Kang JH, Park HA, Kim KW, Cho YG, Choi WY, Park H, Lee HA. The cutoff value of waist cir- cumference for predicting metabolic risks in pre- and post- menopausal korean women: analysis of 2010 korean na- tional health and nutrition examination survey data. Kore- an J Fam Med 2013;34:307-18.
20. Lim S, Kim JH, Yoon JW, Kang SM, Choi SH, Park YJ, Kim KW, Cho NH, Shin H, Park KS, Jang HC. Optimal cut points of waist circumference (WC) and visceral fat area (VFA) predicting for metabolic syndrome (MetS) in elder- ly population in the Korean Longitudinal Study on Health and Aging (KLoSHA). Arch Gerontol Geriatr 2012;54:
e29-34.
21. Ko KP, Oh DK, Min H, Kim CS, Park JK, Kim Y, Kim SS.
Prospective study of optimal obesity index cutoffs for pre- dicting development of multiple metabolic risk factors: the Korean genome and epidemiology study. J Epidemiol
2012;22:433-9.
22. Yoo HJ, Park MS, Lee CH, Yang SJ, Kim TN, Lim KI, Kang HJ, Song W, Yeon JE, Baik SH, Choi DS, Choi KM.
Cutoff points of abdominal obesity indices in screening for non-alcoholic fatty liver disease in Asians. Liver Int 2010;
30:1189-96.
23. Park YM, Kwon HS, Lim SY, Lee JH, Yoon KH, Son HY, Yim HW, Lee WC. Optimal waist circumference cutoff value reflecting insulin resistance as a diagnostic criterion of metabolic syndrome in a nondiabetic Korean population aged 40 years and over: the Chungju Metabolic Disease Cohort (CMC) study. Yonsei Med J 2010;51:511-8.
24. Koh JH, Koh SB, Lee MY, Jung PM, Kim BH, Shin JY, Shin YG, Ryu SY, Lee TY, Park JK, Chung CH. Optimal waist circumference cutoff values for metabolic syndrome diagnostic criteria in a Korean rural population. J Korean Med Sci 2010;25:734-7.
25. Choi SJ, Keam B, Park SH, Park HY. Appropriate waist circumference cut-offs to predict diabetes in the Korean population: the Korean Genome and Epidemiology Study.
Circ J 2010;74:1357-63.
26. Seo JA, Kim BG, Cho H, Kim HS, Park J, Baik SH, Choi DS, Park MH, Jo SA, Koh YH, Han C, Kim NH. The cutoff values of visceral fat area and waist circumference for identifying subjects at risk for metabolic syndrome in el- derly Korean: Ansan Geriatric (AGE) cohort study. BMC Public Health 2009;9:443.
27. Baik I. Optimal cutoff points of waist circumference for the criteria of abdominal obesity: comparison with the cri- teria of the International Diabetes Federation. Circ J 2009;
73:2068-75.
28. Hyun YJ, Kim OY, Jang Y, Ha JW, Chae JS, Kim JY, Yeo HY, Paik JK, Lee JH. Evaluation of metabolic syndrome risk in Korean premenopausal women: not waist circum- ference but visceral fat. Circ J 2008;72:1308-15.
29. Kim JA, Choi CJ, Yum KS. Cut-off values of visceral fat area and waist circumference: diagnostic criteria for ab- dominal obesity in a Korean population. J Korean Med Sci 2006;21:1048-53.
![Table 2 shows those studies that proposed thresholds for ab- ab-dominal obesity in Koreans [19-27,29]](https://thumb-ap.123doks.com/thumbv2/123dokinfo/5226225.125068/3.892.68.827.410.1077/table-shows-studies-proposed-thresholds-dominal-obesity-koreans.webp)