• 검색 결과가 없습니다.

Cut-off Values and Clinical Utility of Surrogate Markers for Insulin Resistance and Beta-Cell Function to Identify Metabolic Syndrome and Its Components among Southern Indian Adults

N/A
N/A
Protected

Academic year: 2021

Share "Cut-off Values and Clinical Utility of Surrogate Markers for Insulin Resistance and Beta-Cell Function to Identify Metabolic Syndrome and Its Components among Southern Indian Adults"

Copied!
11
0
0

로드 중.... (전체 텍스트 보기)

전체 글

(1)

Cut-off Values and Clinical Utility of Surrogate

Markers for Insulin Resistance and Beta-Cell Function to Identify Metabolic Syndrome and Its Components among Southern Indian Adults

Chiranjeevi Kumar Endukuru

1

, Girwar Singh Gaur

1,

*, Dhanalakshmi Yerrabelli

1

, Jayaprakash Sahoo

2

, Balasubramaniyan Vairappan

3

Departments of

1

Physiology,

2

Endocrinology, and

3

Biochemistry, Jawaharlal Institute of Postgraduate Medical Education and Research, Puducherry, India

Background: Insulin resistance (IR) is a collective clinical entity that exacerbates metabolic syndrome (MetS).

As the gold-standard test to quantify IR involves intravenous insulin loading and repeated blood glucose moni- toring, many indices have been developed for IR assessment for convenience. This study tested the ideal cut-off values and clinical utility of IR indices in identifying MetS.

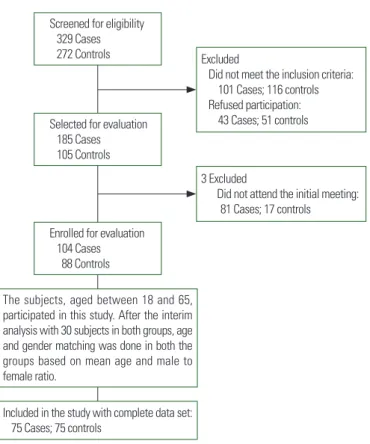
Methods: We recruited 150 subjects, 75 MetS patients and 75 healthy controls, then obtained written informed consent to participate in this study. We collected fasting blood samples for glucose and lipid profiles and calcu- lated nineteen indices of IR and insulin secretion using validated formulae. We determined the precision of these IR indices using the area under the curve (AUC) in a receiver operating characteristic analysis.

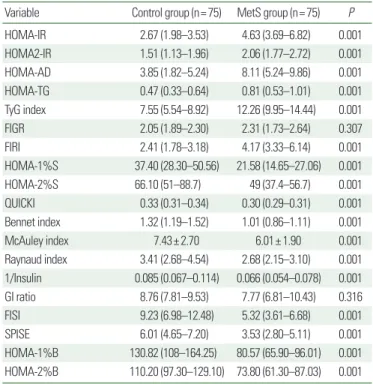
Results: Subjects with MetS have significantly higher IR coupled with lower insulin sensitivity and beta-cell function than controls. Among the surrogate markers of IR tested, the homeostatic model assessment of insulin resistance (HOMA-IR), HOMA-adiponectin (HOMA-AD), triglyceride-glucose (TyG) index, HOMA-1%S (insulin sensitivity), quantitative insulin sensitivity check index (QUICKI), McAuley index, single-point insulin sensitivity estimator (SPISE), and HOMA-2%B (beta-cell function) showed the highest AUC values for detecting MetS.

Conclusion: Our study results suggest that the ideal cut-off and AUC values identified for HOMA-IR, HOMA-AD, the TyG index, HOMA-1%S, QUICKI, the McAuley index, SPISE, and HOMA-2%B offer a clinical approach to the early detection and risk stratification for MetS among people in southern India.

Key words: Beta-cell function, Homeostatic model assessment of insulin resistance, Insulin sensitivity, Homeo- static model assessment-adiponectin, McAuley index, Single-point insulin sensitivity estimator

Received June 25, 2020 Reviewed July 27, 2020 Accepted September 16, 2020

* Corresponding author Girwar Singh Gaur

https://orcid.org/0000-0002-6593-5187 Department of Physiology, Jawaharlal Institute of Postgraduate Medical Education and Research, Puducherry 605006, India Tel: +91-9994470395 Fax: +91-0413-2272066 E-mail: [email protected]

INTRODUCTION

During the past decade, technological breakthroughs in health- care and medical technologies have substantially improved the di- agnostic approaches to and treatment options for cardiovascular disease (CVD). Nonetheless, CVD is the primary cause of morbid- ity and mortality globally.

1

Impaired glucose tolerance, atherogenic

dyslipidemia, hypertension (HTN), and central or abdominal obe- sity are well-known CVD risk factors. Metabolic syndrome (MetS) is the collection of all the CVD risk factors related to vascular and metabolic dysfunctions that precede overt CVD and type 2 diabe- tes mellitus (T2DM).

2

The association of MetS and its compo- nents with CVD risk is complicated and multifactorial. It ranges from developing resistance to insulin, aggravated glycemic and lipid

Copyright © 2020 Korean Society for the Study of Obesity

This is an Open Access article distributed under the terms of the Creative Commons Attribution Non-Commercial License (https://creativecommons.org/licenses/by-nc/4.0/) which permits unrestricted non-commercial use, distribution, and reproduction in any medium, provided the original work is properly cited.

2017-03-16 https://crossmark-cdn.crossref.org/widget/v2.0/logos/CROSSMARK_Color_square.svg

(2)

profiles, and oxidative stress to low-grade inflammation, and all the factors are interconnected and share underlying mechanisms and pathways.

3

In addition to those risk factors, the etiology of MetS can also include smoking and drinking habits, a fatty diet, physical inactivity, and heavy work stress. It is essential to improve our knowledge about the onset and pathogenesis of MetS to facilitate practical therapeutic strategies.

4

The prevalence of MetS is rising rapidly, which affects public health. According to the evidence, ap- proximately one-fourth of the world’s population can be classified as having MetS.

5

In India, a community-based cross-sectional study in 2017 showed that the prevalence of MetS had increased from 24% to 33%.

6

Thus, studies on MetS and ways to reduce CVD risk are intended to build better prevention strategies.

Insulin resistance (IR) is a noteworthy risk factor for CVD and T2DM. It appears to be the most predominant of the five clinical risk factors used to diagnose MetS.

7

IR is a state in which the insu- lin hormone no longer has sufficient capability to bind to its recep- tors and signal anticipated functions, which leads the liver, skeletal muscle, and adipose tissue to have reduced sensitivity to the meta- bolic effects of insulin. In other words, a known dosage of insulin does not increase the glucose disposal of a person with IR as much as it does in a healthy person, and that can contribute to beta-cell dyfucntion.

8

Genetic abnormalities in proteins involved in the in- sulin pathway and increased visceral fat have been proposed as sig- nificant contributors to IR.

9

In this study, we focus on IR to en- hance our understanding of MetS and find diagnostic markers to identify MetS. Among the various methods available for the esti- mation of IR, the gold standard and validated technique is the hy- perinsulinemic-euglycemic clamp test, which directly measures the insulin-mediated glucose disposal rate in vivo in a steady-state.

10

It involves continuously loading and adjusting insulin and glucose in- travenously and testing blood glucose at regular intervals over a 2-hour period.

11

Its application to quantify IR in clinical practice is limited by its dosage, invasiveness, complexity, time-consumption, and expense. Obviously, surrogate IR markers are needed. In recent years, many studies have focused on finding simpler, non-invasive surrogate IR indices that use equations and software to enable the early diagnosis and risk stratification of MetS.

Currently, three categories of surrogate IR markers are available.

The first category involves glucose loading, insulin loading, com-

bined glucose and insulin loading, and measuring glucose and insu- lin at hourly intervals. The second category comprises markers that address IR in a steady state without a glucose or insulin interven- tion.

12

The third category contains indirect markers that correlate with IR, such as ferritin, insulin-like growth factor binding pro- tein-1, adiponectin, or resistin.

13

To preserve simplicity and en- hance clinical utility, we designed this study to investigate the ideal cut-off values for IR markers in the second category and compare their detectable accuracy in identifying MetS among the people in southern India.

METHODS Study participants

Our subjects, aged 18 to 65 years, participated in this cross-sec- tional study from November 2018 to February 2020. This study has ethical clearance from the Institutional Ethics Committee (Hu- man research), Jawaharlal Institute of Postgraduate Medical Educa- tion and Research, Puducherry, India (JIP/IEC/2018/0301). All participants provided signed and dated written informed consent before their enrollment. Seventy-five adults diagnosed with MetS were recruited from the Endocrine outpatient department (Fig. 1).

Based on the National Cholesterol Education Program Adult Treat- ment Panel III guidelines, MetS was defined as having any three of the following five conditions

3,4

: waist circumference (WC) ≥90 cm in Asian males, ≥ 80 cm in Asian females; fasting plasma glucose (FPG) ≥ 100 mg/dL (5.6 mmol/L) or receiving medication for T2DM; serum triglycerides (TG) ≥ 150 mg/dL (1.7 mmol/L) or receiving specific treatment for dyslipidemia; high-density-lipopro- tein cholesterol (HDL-C) ≤40 mg/dL (1.03 mmol/L) in males,

≤ 50 mg/dL (1.29 mmol/L) in females or receiving specific treat-

ment for dyslipidemia; systolic blood pressure (SBP) ≥ 130 mmHg

or diastolic blood pressure (DBP) ≥ 85 mmHg or receiving antihy-

pertensive medication. Among the 75 subjects in the MetS group,

34 were receiving oral hypoglycemic agents (metformin, daonil),

20 were receiving lipid-lowering agents (atorvastatin), and 15 were

taking antihypertensive agents (envas). Seventy-five healthy volun-

teers who did not have MetS were included in the study as age and

sex-matched controls. Potential subjects with a medical history of

ischemic heart disease; cancer; thyroid disorders; neurological,

(3)

psychological, or other endocrinology disorders; or drug intake for any chronic illness were excluded.

Sample size calculation

We used the OpenEpi version 3 (Andrew G. Dean and Kevin M.

Sullivan, Atlanta, GA, USA), online calculator to estimate the sam- ple size. Based on a previous report,

14

the recommended sample size was 108, with 54 subjects in each group, to determine differences of 1.7 between two independent medians with an interquartile range of homeostatic model assessment of insulin resistance (HOMA- IR) values (1.6 [1.1–2.4] vs. 3.3 [2.0–4.8]) with a power of 80%

and an alpha error of 0.05. We recruited 150 participants, with 75 in each group, to enable broader and wider coverage of the popula- tion, provide more information, and reduce uncertainty.

Brief procedures

Assessment of traditional anthropometric measures

We evaluated subject standing height and weight using a wall- mounted stadiometer and digital weight balance while the subjects were wearing light clothing and barefoot. Body mass index (BMI)

was calculated as weight in kg divided by height in m

2

. WC was measured using a stretchable measuring tape at the narrowest point around the abdomen between the inferior border of the last costal rib and the upper portion of the iliac crest. Hip circumference (HC) was taken around the most comprehensive part of the buttocks.

The waist-to-hip ratio (WHR) and waist-to-height ratio (WHtR) of the subjects were calculated. Brachial artery blood pressure (BP) was measured thrice in the subject’s left arm in a sitting position af- ter a rest of five minutes using an Omron (SEM-1; Kyoto, Japan).

Assessment of biochemical profile

We assayed glucose and lipid profiles using an AU680 Analyzer (Beckman Coulter, Atlanta, GA, USA). Serum low-density lipo- protein cholesterol (LDL-C) was calculated based on the Friede- wald formula [LDL-C= total cholesterol–(HDL-C+TG/5)]. The Friedewald formula is not valid when the serum TG of an individu- al is < 400 mg/dL.

15

The atherogenic index of plasma (AIP) was calculated using the formula [AIP= log10(TG/ HDL-C)]. Insulin and adiponectin levels were quantified using a commercially avail- able enzyme-linked immunosorbent assay kit (Calbiotech, El Ca- jon, CA, USA).

Surrogate markers of IR and insulin secretion

IR indices

We used these indices, calculated as follows: HOMA-IR

16

: fast- ing plasma insulin (µU/mL)× FPG (mmol/L)/22.5; HOMA2- IR

17

: the online HOMA Calculator v2.2.2; HOMA-adiponectin (HOMA-AD)

18

: fasting plasma insulin (µU/mL)× FPG (mmol/

L)/adiponectin (µg/mL); HOMA-triglycerides (HOMA-TG)

19

: fasting plasma insulin (µU/mL)× FPG (mmol/L)/TG (mg/dL);

triglyceride-glucose (TyG) index

20

: FPG (mmol/L)/TG (mmol/

L); fasting insulin to glucose ratio (FIGR)

21

: fasting plasma insulin (µU/mL)/FPG (mg/dL); fasting insulin resistance index (FIRI)

10

: fasting plasma insulin (µU/mL)× FPG (mmol/L)/25.

Insulin sensitivity indices

We used these indices, calculated as follows: HOMA-1%S (insu- lin sensitivity)

16

: 1/HOMA-IR× 100; HOMA-2%S

17

: the online HOMA calculator v2.2.2; quantitative insulin sensitivity check in- dex (QUICKI)

22

: 1/[log (fasting insulin in µU/mL)+log (FPG in

Excluded

Did not meet the inclusion criteria:

101 Cases; 116 controls Refused participation:

43 Cases; 51 controls

3 Excluded

Did not attend the initial meeting:

81 Cases; 17 controls Screened for eligibility

329 Cases 272 Controls

Selected for evaluation 185 Cases 105 Controls

Enrolled for evaluation 104 Cases 88 Controls

The subjects, aged between 18 and 65, participated in this study. After the interim analysis with 30 subjects in both groups, age and gender matching was done in both the groups based on mean age and male to female ratio.

Included in the study with complete data set:

75 Cases; 75 controls

Figure 1. Flow diagram of the selection and continuity of study participants.

(4)

mg/dL)]; Bennet index

23

: 1/[log (fasting insulin in µU/mL)× log (FPG in mmol/L)]; McAuley index

24

: exp [2.63–0.28 ln (insulin in µU/L)−0.31 ln (TG in mmol/L)]; Raynaud index

25

: 40/fasting insulin (µU/mL); Reciprocal insulin

26

: 1/fasting insulin (µU/mL);

glucose to insulin (GI) ratio

26

: FPG (mg/dL)/fasting plasma insu- lin (µU/mL); fasting insulin sensitivity index (FISI)

27

: 10

4

/[fasting plasma insulin (µU/mL)× FPG (mmol/L)]; single-point insulin sensitivity estimator (SPISE)

28

: 600× HDL-C0.185/(TG0.2×

BMI

1.338

).

Beta cell function indices

HOMA-1%B (beta-cell function)

16

: [20× fasting insulin (µU/

mL)/[FPG (mmol/L)–3.5]; HOMA-2%B

17

: the online HOMA calculator v2.2.2.

Statistical analysis

Statistical analyses were carried out using IBM SPSS ver. 20.00 (IBM Corp., Armonk, NY, USA). We use the mean± standard de- viation and median with interquartile range to represent continu- ous variables, depending on the normality of the data, which was tested by the Kolmogorov-Smirnov test. The Student independent t-test (two-tailed) and Mann-Whitney U-test were used to com- pare the continuous variables. Categorical findings are presented as percentages, and chi-square test was used to detect differences be- tween the groups. By observing the area under the curve (AUC) in a receiver operating characteristic (ROC) analysis, we calculated the detectable accuracy of the IR indices to identify MetS and its components. MedCalc 11.4.2.0 (Ostend, Belgium) was used for the AUC comparisons. A logistic regression analysis was done us- ing MedCalc software to calculate the odds ratios (ORs) and 95%

confidence intervals (CIs) that surrogate IR markers have for MetS and its components. A P-value was considered statistically signifi- cant at less than 0.05.

RESULTS

Table 1 depicts the demographic and anthropometric data for the healthy control subjects and MetS subjects. We observed no significant differences in age, sex, smoking, family history of HTN, T2DM, and CVD between the control and MetS group subjects

(Table 1). Anthropometric measurements (weight, BMI, WC, WHR, and WHtR) were significantly higher in the MetS group than in the control group (P<0.001).

The impaired glycemic state in the MetS group was observed as significantly increased FPG and insulin levels (Table 2). In contrast, adiponectin levels in the MetS group were significantly decreased.

Atherogenic dyslipidemia in the MetS group was evident as signifi- cantly increased lipid parameters (TC, TG) and lipid ratios (LDL/

HDL-C, TG/HDL-C, TC/HDL-C, non-HDL/HDL-C, AIP), except for HDL-C (P<0.001), which was significantly decreased (Table 2). MetS subjects had higher LDL-C levels than controls, but that difference was not statistically significant. Based on the es- timated cardiovascular parameters, the MetS group exhibited pre- hypertension status, with significantly increased systolic blood pressure (SBP), diastolic blood pressure (DBP), and mean arterial pressure (MAP) (Table 2).

Among the IR indices, the HOMA-IR, HOMA2-IR, HOMA-AD, HOMA-TG, TyG index, and FIRI values were significantly higher Table 1. Comparison of demographic and anthropometric data between healthy control subjects and patients with MetS

Variable Control group (n= 75) MetS group (n= 75) P

Age (yr) 44.18± 8.32 46.13± 6.12 0.105

Sex (male:female) 37:38 43:32 0.326

Smoking 11 (14.7) 15 (20) 0.388

Alcohol intake 21 (28) 33 (44) 0.041

Family H/O HTN 27 (36) 36 (48) 0.317

Family H/O T2DM 38 (50.7) 40 (53.3) 0.744

Family H/O CVD 8 (10.7) 12 (16) 0.337

High WC 9 (12) 34 (45.3) 0.001

Hyperglycemia 18 (24) 69 (92) 0.001

High TG 14 (18.7) 40 (53.3) 0.001

Low HDL-C 7 (9) 51 (68) 0.001

High BP 15 (20) 32 (42.7) 0.003

Height (cm) 164.04± 8.05 160.73± 9.48 0.022

Weight (kg) 69.17± 10.73 73.60± 7.28 0.004

BMI (kg/m

2

) 26.25± 3.23 27.50± 3.61 0.027

WC (cm) 90.94± 8.9 98.63± 9.68 0.001

HC (cm) 100.05± 9.44 102.20± 9.36 0.164

WHR 0.90± 0.04 0.96± 0.05 0.001

WHtR 0.55± 0.05 0.62± 0.07 0.001

Values are presented as mean± standard deviation or number (%). BMI, WHR, and WHtR should be lower to be healthy.

MetS, metabolic syndrome; H/O, history of; HTN, hypertension; T2DM, type 2 diabetes

mellitus; CVD, cardiovascular disease; WC, waist circumference; TG, triglycerides; HDL-

C, high-density lipoprotein cholesterol; BP, blood pressure; BMI, body mass index; HC,

hip circumference; WHR, waist-to-hip ratio; WHtR, waist-to-height ratio.

(5)

(P<0.001) in the MetS subjects than in the controls (Table 3). In contrast, the values for the insulin-sensitivity indices and beta-cell function indices (HOMA-1%S, HOMA-2%S, QUICKI, Bennet index, McAuley index, Raynaud index, reciprocal insulin, FISI, SPISE, HOMA-1%B, and HOMA-2%B) were significantly lower in the MetS group than the control group.

Table 4 explains the detectable accuracy of all the surrogate mark- ers of IR and insulin secretion in identifying MetS among the south- ern-Indian subjects in our study population. Among the IR and in- sulin secretion markers, HOMA-IR, HOMA-AD, the TyG index, HOMA-1%S, QUICKI, the McAuley index, SPISE, and HOMA- 2%B yielded an AUC above 0.8, showing the best detectable accu- racy for the identification of MetS. Most of the other indices tested (HOMA2-IR, HOMA-TG, FIRI, HOMA-2%S, the Bennet index, Raynaud index, reciprocal insulin, FISI, and HOMA-1%B) report- ed an AUC between 0.6 and 0.8. In our results, FIGR and the GI ratio were the least effective, with the lowest AUC in the ROC analysis.

Table 5 provides information about the proportion of subjects with values higher than the cut-off for each index. Compared with the control group, the MetS group had a higher proportion of sub- jects with higher cut-off values for HOMA-IR and QUICKI (93.3%), indicating increased IR and decreased insulin sensitivity, respec- tively.

The AUC values for HOMA-IR, HOMA-AD, the TyG index, HOMA-1%S, QUICKI, the McAuley index, SPISE, and HOMA- 2%B in identifying MetS and its components are shown in Supple- mentary Table 1. Among those markers of IR and insulin secretion, HOMA-IR has the largest AUC for identifying MetS (AUC, 0.851;

95% CI, 0.784–0.904). SPISE has the highest AUC for predicting central obesity, and HOMA-IR, HOMA-AD, the TyG index, HOMA- 1%S, QUICKI, and the McAuley index showed similar AUCs for predicting central obesity. An elevated FPG was best predicted by HOMA-IR, HOMA-AD, the TyG index, HOMA-1%S, QUICKI, Table 2. Comparison of biochemical and cardiometabolic parameters between

healthy control subjects and patients with MetS

Variable Control group (n= 75) MetS group (n= 75) P

FPG (mg/dL) 93.00 (86–100) 129 (118–145) 0.001

Insulin (μU/mL) 11.7 (8.8–14.9) 14.9 (12.9–18.6) 0.001 Adiponectin (µg/mL) 17.36 (13.26–23.08) 12.1 (9.13–18.23) 0.001

BHR (/min) 72.90± 8.73 76.37± 11.55 0.039

SBP (mmHg) 119.05± 12.59 127.33± 13.79 0.001

DBP (mmHg) 77.29± 11.06 80.93± 7.23 0.018

MAP (mmHg) 91.21± 10.81 96.39± 8.56 0.001

TC (mg/dL) 174.87± 22.53 187.17± 28.89 0.004

TG (mg/dL) 129 (100–147) 154 (116–180) 0.001

HDL-C (mg/dL) 46.05± 4.95 37.73± 6.28 0.001

LDL-C (mg/dL) 105.20± 22.78 109.81± 27.18 0.350

VLDL-C (mg/dL) 24 (16–30) 27 (19–37) 0.050

LDL-C/HDL-C 2.34± 0.60 2.83± 0.91 0.001

TG/HDL 2.78 (2.18–3.17) 4.17 (3.14–5.08) 0.001

TC/HDL 3.82± 0.54 4.99± 1.15 0.001

Non-HDL-C/HDL-C 2.82± 0.54 3.99± 1.15 0.001

AIP 0.431± 0.12 0.602± 0.16 0.001

Values are presented as median (interquartile range) or mean± standard deviation.

FPG, insulin, BHR, SBP, DBP, MAP, and all the lipid parameters except HDL-C should be lower to be healthy; HDL-C and adiponectin should be higher.

MetS, metabolic syndrome; FPG, fasting plasma glucose; BHR, basal heart rate; SBP, systolic blood pressure; DBP, diastolic blood pressure; MAP, mean arterial pressure; TC, total cholesterol; TG, triglycerides; HDL-C, high-density lipoprotein cholesterol; LDL-C, low-density lipoprotein cholesterol; VLDL-C, very-low-density lipoprotein cholesterol;

AIP, atherogenic index of plasma.

Table 3. Comparison of surrogate markers of IR and insulin secretion between healthy control subjects and patients with MetS

Variable Control group (n= 75) MetS group (n= 75) P

HOMA-IR 2.67 (1.98–3.53) 4.63 (3.69–6.82) 0.001

HOMA2-IR 1.51 (1.13–1.96) 2.06 (1.77–2.72) 0.001

HOMA-AD 3.85 (1.82–5.24) 8.11 (5.24–9.86) 0.001

HOMA-TG 0.47 (0.33–0.64) 0.81 (0.53–1.01) 0.001

TyG index 7.55 (5.54–8.92) 12.26 (9.95–14.44) 0.001

FIGR 2.05 (1.89–2.30) 2.31 (1.73–2.64) 0.307

FIRI 2.41 (1.78–3.18) 4.17 (3.33–6.14) 0.001

HOMA-1%S 37.40 (28.30–50.56) 21.58 (14.65–27.06) 0.001

HOMA-2%S 66.10 (51–88.7) 49 (37.4–56.7) 0.001

QUICKI 0.33 (0.31–0.34) 0.30 (0.29–0.31) 0.001

Bennet index 1.32 (1.19–1.52) 1.01 (0.86–1.11) 0.001

McAuley index 7.43± 2.70 6.01± 1.90 0.001

Raynaud index 3.41 (2.68–4.54) 2.68 (2.15–3.10) 0.001 1/Insulin 0.085 (0.067–0.114) 0.066 (0.054–0.078) 0.001

GI ratio 8.76 (7.81–9.53) 7.77 (6.81–10.43) 0.316

FISI 9.23 (6.98–12.48) 5.32 (3.61–6.68) 0.001

SPISE 6.01 (4.65–7.20) 3.53 (2.80–5.11) 0.001

HOMA-1%B 130.82 (108–164.25) 80.57 (65.90–96.01) 0.001 HOMA-2%B 110.20 (97.30–129.10) 73.80 (61.30–87.03) 0.001 Values are presented as median (interquartile range) or mean± standard deviation. All the IR indices should be lower to be healthy, and the insulin sensitivity and beta-cell function indices should be higher.

IR, insulin resistance; MetS, metabolic syndrome; HOMA, homeostatic model assess- ment; AD, adiponectin; TG, triglycerides; TyG, triglyceride-glucose; FIGR, fasting insulin to glucose ratio; FIRI, fasting insulin resistance; %S, insulin sensitivity; QUICKI, quanti- tative insulin sensitivity check index; 1/Insulin, reciprocal insulin; GI, glucose to insulin;

FISI, fasting insulin sensitivity index; SPISE, single-point insulin sensitivity estimator;

%B, beta-cell function.

(6)

and HOMA-2%B. The TyG index, McAuley index, and SPISE showed the largest AUCs for predicting elevated TG and reduced HDL-C. None of the indices tested showed good predictive ability in identifying high BP.

Among the markers of IR, insulin sensitivity and beta-cell func- tion tested, HOMA-IR, HOMA-AD, the TyG index, HOMA- 1%S, QUICKI, the McAuley index, SPISE, and HOMA-2%B were associated with increased odds of having MetS and its components after adjustment for age, sex, BMI, smoking, and alcohol status (Supplementary Table 2). The binomial logistic regression analysis showed that subjects with higher HOMA-IR levels were more like- ly to have MetS and hyperglycemia than those with lower HOMA- IR levels (OR, 2.24; 95% CI, 1.60–3.13 and OR, 16.47; 95% CI, 6.12– 28.44, respectively). Subjects with higher TyG index and lower McAuley index values were more likely to have dyslipidemia (elevated TG) and hyperglycemia (OR, 3.46; 95% CI, 2.32–4.83 and OR, 3.34; 95% CI, 2.84–4.16, respectively).

DISCUSSION

The quantification of IR is of utmost importance, because it is the root factor associated with the clinical and metabolic abnor- malities in MetS. It predicts the future risk of developing T2DM and CVD, can remain undiagnosed for a long time, and is estab- lished before any signs of disease appear. It is crucial to address IR as soon as possible to reduce the risk of developing life-threatening illnesses. Therefore, in this pioneering regional study, we have fo- cused on understanding the ideal cut-off values and clinical utility of surrogate IR and insulin secretion markers for detecting MetS and its components among subjects near a tertiary care teaching hospital in southern India.

Matthews et al.

16

developed the homeostatic model assessment concept in 1985 to quantify IR, insulin sensitivity, and beta-cell functions. In this study, we found that HOMA-IR was significantly higher in the MetS group than in the controls. The World Health Organization

29

has defined IR as a HOMA-IR of ≥ 1.8. In the cur- rent study, a HOMA-IR cut-off of ≥ 2.86 provided adequate pre- Table 4. AUCs, ideal cut-offs, sensitivity, and specificity of surrogate markers for IR and insulin secretion for identifying MetS in the ROC analysis

Variable AUC (95% CI) P Cut-off value Sensitivity Specificity Youden index

HOMA-IR 0.851 (0.784–0.904) 0.001 ≥ 2.86 86.67 70.67 0.5733

HOMA2-IR 0.787 (0.712–0.849) 0.001 ≥ 1.69 80.01 65.33 0.4533

HOMA-AD 0.846 (0.778–0.899) 0.001 ≥ 6.26 68.14 85.33 0.5333

HOMA-TG 0.755 (0.678–0.822) 0.001 ≥ 0.72 53.33 81.35 0.3467

TyG index 0.836 (0.767–0.891) 0.001 ≥ 9.88 76.00 88.00 0.6400

FIGR 0.548 (0.465–0.630) 0.335 ≥ 2.41 85.33 46.67 0.3200

FIRI 0.768 (0.669–0.850) 0.001 ≥ 2.96 83.67 70.47 0.4414

HOMA-1%S 0.850 (0.783–0.903) 0.001 ≤ 28.2 82.74 77.33 0.5731

HOMA-2%S 0.779 (0.704–0.843) 0.001 ≤ 53.9 69.33 74.67 0.4400

QUICKI 0.844 (0.776–0.898) 0.001 ≤ 0.32 93.33 61.33 0.5467

Bennet index 0.795 (0.721–0.856) 0.001 ≤ 1.2 89.30 74.62 0.4534

McAuley index 0.815 (0.743–0.874) 0.001 ≤ 6.05 78.76 92.12 0.4937

Raynaud index 0.742 (0.664–0.810) 0.001 ≤ 3.10 76.01 62.67 0.3867

1/Insulin 0.735 (0.657–0.804) 0.001 ≤ 0.08 86.67 50.15 0.3733

GI ratio 0.547 (0.464–0.629) 0.343 ≤ 7.45 85.33 55.81 0.2928

FISI 0.797 (0.724–0.858) 0.001 ≤ 6.96 83.67 70.37 0.4414

SPISE 0.822 (0.751–0.880) 0.001 ≤ 3.79 73.47 90.70 0.5067

HOMA-1%B 0.784 (0.680–0.875) 0.001 ≤ 94.74 71.43 74.42 0.4585

HOMA-2%B 0.842 (0.773–0.896) 0.001 ≤ 87.12 93.62 76.74 0.6800

Cut-off values correspond to the highest Youden index.

AUC, area under the curve; IR, insulin resistance; MetS, metabolic syndrome; ROC, receiver operating characteristic; HOMA, homeostatic model assessment; AD, adiponectin; TG, triglycerides; TyG, triglyceride-glucose; FIGR, fasting insulin to glucose ratio; FIRI, fasting insulin resistance; %S, insulin sensitivity; QUICKI, quantitative insulin sensitivity check index;

1/Insulin, reciprocal insulin; GI, glucose to insulin; FISI, fasting insulin sensitivity index; SPISE, single-point insulin sensitivity estimator; %B, beta-cell function.

(7)

dictive power, sensitivity and specificity in detecting MetS and ele- vated FPG among the southern Indians (AUC, 0.851; 95% CI, 0.784–0.904 and AUC, 0.963; 95% CI, 0.919–0.987, respectively).

Using different criteria to define IR and different approaches to de- termine cut-off values are the reasons for a notably higher HOMA- IR. Moreover, a high HOMA-IR value correlated strongly with the odds of having MetS and elevated FPG. The HOMA2-IR is a sim- plified version of HOMA-IR that is calculated using an online cal- culator.

17

HOMA2-IR displays metabolic processes more precisely than the original HOMA-IR because it highlights the feedback in- teractions between glucose and insulin in various parts of the body.

However, it did not detect MetS more efficiently than HOMA-IR.

The differences in the predictive ability of HOMA-IR and HOMA2-IR could reflect a drawback of HOMA2-IR: it accepts only a specific range of values for computation.

30

Keskin et al.

31

ob- served similar results in the Brazilian Metabolic Syndrome Study;

HOMA-IR had a slightly higher AUC than HOMA2-IR in the Table 5. Proportion of subjects with values higher than the cut-off for the IR, insu- lin sensitivity, and beta-cell function indices

Variable Cut-off value Control group (n= 75) MetS group

(n= 75) P

HOMA-IR ≥ 2.86 34 (45.3) 70 (93.3) 0.001

HOMA2-IR ≥ 1.69 27 (36) 60 (80) 0.001

HOMA-AD ≥ 6.26 12 (16) 52 (69.3) 0.001

HOMA-TG ≥ 0.72 15 (20) 43 (57.3) 0.001

TyG index ≥ 9.88 9 (12) 57 (76) 0.001

FIGR ≥ 2.41 12 (16) 35 (46.7) 0.001

FIRI ≥ 2.96 22 (29.3) 65 (86.7) 0.001

HOMA-1%S ≤ 28.2 18 (24) 59 (78.7) 0.001

HOMA-2%S ≤ 53.9 19 (25.3) 52 (69.3) 0.001

QUICKI ≤ 0.32 29 (38.7) 70 (93.3) 0.001

Bennet index ≤ 1.2 19 (25.3) 67 (89.3) 0.001

McAuley index ≤ 6.05 11 (14.7) 46 (61.3) 0.001

Raynaud index ≤ 3.10 28 (37.3) 57 (76) 0.001

1/Insulin ≤ 0.08 37 (49.3) 65 (86.7) 0.001

GI ratio ≤ 7.45 11 (14.7) 36 (48) 0.001

FISI ≤ 6.96 17 (22.7) 60 (80) 0.001

SPISE ≤ 3.79 5 (6.7) 43 (57.3) 0.001

HOMA-1%B ≤ 94.74 7 (9.3) 56 (74.7) 0.001

HOMA-2%B ≤ 87.12 6 (8) 57 (76) 0.001

Values are presented as number (%).

IR, insulin resistance; MetS, metabolic syndrome; HOMA, homeostatic model assess- ment; AD, adiponectin; TG, triglycerides; TyG, triglyceride-glucose; FIGR, fasting insulin to glucose ratio; FIRI, fasting insulin resistance; %S, insulin sensitivity; QUICKI, quanti- tative insulin sensitivity check index; 1/Insulin, reciprocal insulin; GI, glucose to insulin;

FISI, fasting insulin sensitivity index; SPISE, single-point insulin sensitivity estimator;

%B, beta-cell function.

ROC analysis. IR is a causative agent of MetS, which could indicate that MetS-related metabolic abnormalities are the end result of long-term IR. Excess weight and obesity in the MetS group could be an essential link between IR and MetS.

Recently, HOMA-AD was introduced as a novel, simple, and ad- ipokine-based IR index that is calculated using serum adiponectin levels as a denominator in the HOMA-IR formula.

18

To date, few studies have addressed the role of the HOMA-AD in IR assessment.

Matsuhisa et al.

18

surveyed Japanese respondents and observed that the IR measured by the euglycemic-hyperinsulinemic clamp tech- nique was more significantly associated with HOMA-AD (r = –0.64) than with HOMA-IR (r = –0.59). In the present study, HOMA-AD has shown higher predictive power in discriminating subjects with MetS and hyperglycemia (AUC, 0.846; 95% CI, 0.778–0.899 and AUC, 0.893; 95% CI, 0.832–0.937, respectively).

The ideal cut-off value for identifying MetS with the HOMA-AD index was ≥ 6.26. Contrary to our findings, Da Silva et al.

32

found that the HOMA-AD (AUC, 0.712) had less detectable accuracy than HOMA-IR (AUC, 0.859). However, they also found that HOMA-AD could discriminate patients with and without IR as well as HOMA-IR. The exact mechanisms connecting adiponectin and IR have not been studied extensively. Recent findings show that insulin could specifically affect adiponectin gene expression and in vitro adiponectin levels.

33

Thus, it is reasonable to think that the higher insulin levels found in IR subjects could decrease their adiponectin levels. The primary reason for low adiponectin levels in MetS could be central or abdominal obesity because adiponec- tin levels are determined mainly by the degree of visceral fat.

Another new surrogate marker of IR, the TyG index, was devel-

oped by Simental-Mendía et al.

34

in 2008 as a product of FPG and

TG. Recent studies have found that the TyG index can predict the

future risk of diabetes in men and women and is associated with

CVD, obesity, fatty liver, and MetS.

35

We found the TyG index to

be highly predictive of MetS (AUC, 0.836; 95% CI, 0.779–0.928),

elevated FPG and TG (AUC, 0.865; 95% CI, 0.799–0.915; and

AUC, 0.906; 95% CI, 0.848–0.948, respectively). In other words,

the TyG index could precisely identify around 83.6% of individuals

with MetS, 86.5% of individuals with elevated FPG, and 90.6% of

individuals with high TG. The TyG index is also associated with

increased odds of having MetS, elevated FPG and TG. The ideal

(8)

cut-off value for the TyG index to detect MetS in our study was

≥ 9.88. However, certain pathological conditions, such as dyslipid- emia and abdominal obesity, might influence the TyG index in ways that affect its ability to identify MetS. These results suggest that both glucose and lipid abnormalities could play a crucial role in the pathogenesis of MetS. Similar results have been reported by Zheng and Mao

36

They showed that the TyG index independently predicted incident HTN and suggested that including the TyG in- dex in routine check-ups could help to prevent HTN.

In addition to the IR indices, we examined insulin sensitivity and beta-cell function indices derived from equations that use glucose and insulin levels. HOMA-1%S and QUICKI indicate insulin sen- sitivity, and HOMA-2%B is a method for evaluating beta-cell func- tion. In Mexican subjects, Baez-Duarte et al.

37

demonstrated a gradual deterioration of beta-cell function and insulin sensitivity in MetS patients as their number of components of MetS increased.

We here found that HOMA-1%S, QUICKI, and HOMA-2%B were significantly lower in MetS patients than in controls, confirm- ing the findings of Baez-Duarte et al.

37

and indicating that the func- tion or mass of beta cells was significantly reduced in subjects with MetS, along with decreased insulin sensitivity. This can be ex- plained by the fact that a disproportionate accumulation of fat in the abdominal area is related to decreased insulin-mediated glucose disposal in southern-Indian adults. Increased pancreatic beta-cell apoptosis, necrosis, or autophagy could be involved in beta cell dysfunction in MetS. In this study, HOMA-1%S, QUICKI, and HOMA-2%B showed the best predictive power (AUC, 0.850; 95%

CI, 0.783– 0.903; AUC, 0.844; 95% CI, 0.776–0.898 and AUC, 0.842; 95% CI, 0.773–0.896, respectively), with cut-offs of ≤ 28.2,

≤ 0.32, and ≤87.12, respectively, to identify MetS patients from southern India.

In 2001, McAuley et al.

24

proposed the McAuley index based on serum insulin and TG, to provide information on the pathophysiol- ogy of IR and MetS. Patients with MetS have a significantly lower McAuley index than controls. Thus, the dysregulation of serum lipid metabolism, mainly an increase in TG levels, as the result of hyperinsulinemia can directly cause reduced insulin sensitivity and beta-cell dysfunction through the deposition of TG within cells. We also found that the McAuley index showed good predictive power to identify MetS, elevated FPG and TG, and reduced HDL-C (AUC,

0.815; 95% CI, 0.743–0.874; AUC, 0.796; 95% CI, 0.723– 0.857;

AUC, 0.895; 95% CI, 0.834–0.939; and AUC, 0.762; 95% CI, 0.680–

0.827, respectively). Furthermore, the McAuley index was strongly associated with the odds of having central obesity and elevated FPG.

The mean McAuley index in the MetS group was 6.01±1.90, with a cut-off of ≤6.05. A similar pattern for the McAuley index was re- ported in a study conducted among Korean adults in 2016 by Kim et al.,

38

who concluded that the McAuley index showed the best ac- curacy in detecting MetS. Contrary to our findings, a 2007 study by Sarafidis et al.

39

on a Greek population found that McAuley’s in- dex was the worst predictor of insulin sensitivity among the mea- sures examined. This discrepancy in the results could be due to the normal mean TG levels in the Greek study population.

Paulmichl et al.

28

introduced SPISE as a reliable tool for estimat- ing IR based on fasting TG, HDL-C, and BMI measurements. They developed the model using computer-assisted mathematical mod- eling of their study population data. They also compared the reli- ability of SPISE to that of the gold standard euglycemic-hyperinsu- linemic clamp test, HOMA-IR, and other indices for IR. Compared with control subjects, the SPISE value was significantly lower in the MetS group. SPISE showed a high ability to discriminate MetS cas- es from controls (AUC, 0.822; 95% CI, 0.751–0.880). SPISE can also predict central obesity, elevated FPG and TG, and reduced HDL-C with excellent discriminating power. We observed a cut-off value of ≤ 3.79 for identifying MetS patients in southern India.

Paulmichl et al.

28

found a SPISE cut-off value of ≤ 6.61 among a European population. The lower cut-off value of SPISE found in this study indicates higher IR and decreased insulin sensitivity among southern Indians. Dudi et al.

40

demonstrated similar results and found SPISE to be a valuable, low-cost measure with high sensitivi- ty and specificity for IR and insulin sensitivity in MetS among a northern Indian population in 2019.

In conclusion, we found increased IR coupled with decreased in-

sulin sensitivity and beta-cell function in the MetS group compared

with the control group. Our study results suggest that HOMA-IR,

HOMA-AD, the TyG index, HOMA-1%S, QUICKI, the McAuley

index, SPISE, and HOMA-2%B show better detectable accuracy in

identifying MetS subjects than the other surrogate markers of IR

and insulin secretion we tested. We also obtained ideal cut-off

points for the surrogate markers of IR and insulin secretion for the

(9)

detection of MetS, and those numbers are not consistent with those in previous studies. The differences in ideal cut-off points could be due to the study design, ethnic differences, sample size, or criteria for MetS diagnosis. Therefore, using these surrogate mea- sures of IR and insulin secretion, in addition to FPG and lipid pro- files, could help with the identification and risk stratification of MetS among southern Indians. Our findings suggest that early treatment options to address IR and intervention strategies to im- prove insulin sensitivity are the best ways to slow disease develop- ment and progression.

CONFLICTS OF INTEREST

The authors declare no conflict of interest.

ACKNOWLEDGMENTS

We sincerely acknowledge the Jawaharlal Institute of Postgradu- ate Medical Education and Research for providing financial help in the form of an intramural PhD research grant (JIP/Res/Intramu- ral/Phs-1/2018-19/98). We are thankful to all the subjects who took part in this study.

AUTHOR CONTRIBUTIONS

Study concept and design: CKE, GSG, DY, JS, and BV; acquisi- tion of data: CKE; analysis and interpretation of data: GSG, CKE, and DY; drafting of the manuscript: GSG, CKE, and DY; critical revision of the manuscript: CKE, GSG, DY, JS, and BV; statistical analysis: CKE and DY; obtained funding: CKE; administrative, technical, or material support: GSG; and study supervision: GSG.

SUPPLEMENTARY MATERIALS

Supplementary Tables 1 and 2 can be found via https://doi.org/

10.7570/jomes20071.

REFERENCES

1. Arnett DK, Blumenthal RS, Albert MA, Buroker AB, Gold-

berger ZD, Hahn EJ, et al. 2019 ACC/AHA Guideline on the Primary Prevention of Cardiovascular Disease: a report of the American College of Cardiology/American Heart Associa- tion Task Force on Clinical Practice Guidelines. Circulation 2019;140:e596-646.

2. Ford ES. Risks for all-cause mortality, cardiovascular disease, and diabetes associated with the metabolic syndrome: a sum- mary of the evidence. Diabetes Care 2005;28:1769-78.

3. Alberti KG, Eckel RH, Grundy SM, Zimmet PZ, Cleeman JI, Donato KA, et al. Harmonizing the metabolic syndrome: a joint interim statement of the International Diabetes Federa- tion Task Force on Epidemiology and Prevention; National Heart, Lung, and Blood Institute; American Heart Associa- tion; World Heart Federation; International Atherosclerosis Society; and International Association for the Study of Obe- sity. Circulation 2009;120:1640-5.

4. Grundy SM, Cleeman JI, Daniels SR, Donato KA, Eckel RH, Franklin BA, et al. Diagnosis and management of the meta- bolic syndrome: an American Heart Association/National Heart, Lung, and Blood Institute Scientific Statement. Circu- lation 2005;112:2735-52.

5. Saklayen MG. The global epidemic of the metabolic syndrome.

Curr Hypertens Rep 2018;20:12.

6. Harikrishnan S, Sarma S, Sanjay G, Jeemon P, Krishnan MN, Venugopal K, et al. Prevalence of metabolic syndrome and its risk factors in Kerala, South India: analysis of a community based cross-sectional study. PLoS One 2018;13:e0192372.

7. Shin JA, Lee JH, Lim SY, Ha HS, Kwon HS, Park YM, et al.

Metabolic syndrome as a predictor of type 2 diabetes, and its clinical interpretations and usefulness. J Diabetes Investig 2013;

4:334-43.

8. Liu R, Christoffel KK, Brickman WJ, Liu X, Gadgil M, Wang G, et al. Do static and dynamic insulin resistance indices per- form similarly in predicting pre-diabetes and type 2 diabetes?

Diabetes Res Clin Pract 2014;105:245-50.

9. Lebovitz HE. Insulin resistance: definition and consequences.

Exp Clin Endocrinol Diabetes 2001;109 Suppl 2:S135-48.

10. Singh B, Saxena A. Surrogate markers of insulin resistance: a review. World J Diabetes 2010;1:36-47.

11. Muniyappa R, Lee S, Chen H, Quon MJ. Current approaches

(10)

for assessing insulin sensitivity and resistance in vivo: advan- tages, limitations, and appropriate usage. Am J Physiol Endo- crinol Metab 2008;294:E15-26.

12. Park SE, Park CY, Sweeney G. Biomarkers of insulin sensitivi- ty and insulin resistance: past, present and future. Crit Rev Clin Lab Sci 2015;52:180-90.

13. Engin A. Adiponectin-resistance in obesity. Adv Exp Med Biol 2017;960:415-41.

14. Antoniolli LP, Nedel BL, Pazinato TC, de Andrade Mesquita L, Gerchman F. Accuracy of insulin resistance indices for meta- bolic syndrome: a cross-sectional study in adults. Diabetol Metab Syndr 2018;10:65.

15. Friedewald WT, Levy RI, Fredrickson DS. Estimation of the concentration of low-density lipoprotein cholesterol in plasma, without use of the preparative ultracentrifuge. Clin Chem 1972;

18:499-502.

16. Matthews DR, Hosker JP, Rudenski AS, Naylor BA, Treacher DF, Turner RC. Homeostasis model assessment: insulin resis- tance and beta-cell function from fasting plasma glucose and insulin concentrations in man. Diabetologia 1985;28:412-9.

17. Oxford Centre for Diabetes, Endocrinology & Metabolism.

HOMA calculator [Internet]. Oxford: Diabetes Trial Unit;

2009 [cited 2020 Oct 30]. Available from: http://www.dtu.

ox.ac.uk

18. Matsuhisa M, Yamasaki Y, Emoto M, Shimabukuro M, Ueda S, Funahashi T, et al. A novel index of insulin resistance deter- mined from the homeostasis model assessment index and ad- iponectin levels in Japanese subjects. Diabetes Res Clin Pract 2007;77:151-4.

19. Khan SH, Khan AN, Chaudhry N, Anwar R, Fazal N, Tariq M.

Comparison of various steady state surrogate insulin resistance indices in diagnosing metabolic syndrome. Diabetol Metab Syndr 2019;11:44.

20. Kang B, Yang Y, Lee EY, Yang HK, Kim HS, Lim SY, et al.

Triglycerides/glucose index is a useful surrogate marker of in- sulin resistance among adolescents. Int J Obes (Lond) 2017;

41:789-92.

21. Nauck MA, Meier JJ. Diagnostic accuracy of an “amended”

insulin-glucose ratio for the biochemical diagnosis of insulin- omas. Ann Intern Med 2012;157:767-75.

22. Katz A, Nambi SS, Mather K, Baron AD, Follmann DA, Sul- livan G, et al. Quantitative insulin sensitivity check index: a simple, accurate method for assessing insulin sensitivity in humans. J Clin Endocrinol Metab 2000;85:2402-10.

23. Anderson RL, Hamman RF, Savage PJ, Saad MF, Laws A, Kades WW, et al. Exploration of simple insulin sensitivity measures derived from frequently sampled intravenous glucose tolerance (FSIGT) tests. The Insulin Resistance Atheroscle- rosis Study. Am J Epidemiol 1995;142:724-32.

24. McAuley KA, Williams SM, Mann JI, Walker RJ, Lewis-Barned NJ, Temple LA, et al. Diagnosing insulin resistance in the general population. Diabetes Care 2001;24:460-4.

25. Raynaud E, Perez-Martin A, Brun JF, Benhaddad AA, Mercier J. Revised concept for the estimation of insulin sensitivity from a single sample. Diabetes Care 1999;22:1003-4.

26. Hermans MP, Levy JC, Morris RJ, Turner RC. Comparison of insulin sensitivity tests across a range of glucose tolerance from normal to diabetes. Diabetologia 1999;42:678-87.

27. Sluiter WJ, Erkelens DW, Terpstra P, Reitsma WD, Doorenbos H. Glucose tolerance and insulin release, a mathematical ap- proach. II. Approximation of the peripheral insulin resistance after oral glucose loading. Diabetes 1976;25:245-9.

28. Paulmichl K, Hatunic M, Højlund K, Jotic A, Krebs M, Mi- trakou A, et al. Modification and validation of the triglyceride- to-HDL Cholesterol ratio as a surrogate of insulin sensitivity in white juveniles and adults without diabetes mellitus: the Single Point Insulin Sensitivity Estimator (SPISE). Clin Chem 2016;62:1211-9.

29. Alberti KG, Zimmet PZ. Definition, diagnosis and classifica- tion of diabetes mellitus and its complications. Part 1: diag- nosis and classification of diabetes mellitus provisional report of a WHO consultation. Diabet Med 1998;15:539-53.

30. Geloneze B, Vasques AC, Stabe CF, Pareja JC, Rosado LE, Queiroz EC, et al. HOMA1-IR and HOMA2-IR indexes in identifying insulin resistance and metabolic syndrome: Brazil- ian Metabolic Syndrome Study (BRAMS). Arq Bras Endocri- nol Metabol 2009;53:281-7.

31. Keskin M, Kurtoglu S, Kendirci M, Atabek ME, Yazici C. Ho-

meostasis model assessment is more reliable than the fasting

glucose/insulin ratio and quantitative insulin sensitivity check

(11)

index for assessing insulin resistance among obese children and adolescents. Pediatrics 2005;115:e500-3.

32. Da Silva CC, Zambon MP, Vasques AC, Camilo DF, De Ber- nardi Rodrigues AM, Antonio MÂ, et al. Homeostatic model assessment of adiponectin (HOMA-Adiponectin) as a surro- gate measure of insulin resistance in adolescents: comparison with the hyperglycaemic clamp and homeostatic model as- sessment of insulin resistance. PLoS One 2019;14:e0214081.

33. Blaslov K, Bulum T, Zibar K, Duvnjak L. Relationship between adiponectin level, insulin sensitivity, and metabolic syndrome in type 1 diabetic patients. Int J Endocrinol 2013;2013:535906.

34. Simental-Mendía LE, Rodríguez-Morán M, Guerrero-Rome- ro F. The product of fasting glucose and triglycerides as sur- rogate for identifying insulin resistance in apparently healthy subjects. Metab Syndr Relat Disord 2008;6:299-304.

35. Sánchez-Íñigo L, Navarro-González D, Fernández-Montero A, Pastrana-Delgado J, Martínez JA. The TyG index may predict the development of cardiovascular events. Eur J Clin Invest 2016;46:189-97.

36. Zheng R, Mao Y. Triglyceride and glucose (TyG) index as a

predictor of incident hypertension: a 9-year longitudinal pop- ulation-based study. Lipids Health Dis 2017;16:175.

37. Baez-Duarte BG, Sánchez-Guillén Mdel C, Pérez-Fuentes R, Zamora-Ginez I, Leon-Chavez BA, Revilla-Monsalve C, et al.

β-cell function is associated with metabolic syndrome in Mex- ican subjects. Diabetes Metab Syndr Obes 2010;3:301-9.

38. Kim TJ, Kim HJ, Kim YB, Lee JY, Lee HS, Hong JH, et al.

Comparison of surrogate markers as measures of uncompli- cated insulin resistance in Korean adults. Korean J Fam Med 2016;37:188-96.

39. Sarafidis PA, Lasaridis AN, Nilsson PM, Pikilidou MI, Stafilas PC, Kanaki A, et al. Validity and reproducibility of HOMA-IR, 1/HOMA-IR, QUICKI and McAuley’s indices in patients with hypertension and type II diabetes. J Hum Hypertens 2007;21:709-16.

40. Dudi P, Goyal B, Saxena V, Rabari K, Mirza AA, Naithani M,

et al. Single point insulin sensitivity estimator as an index for

insulin sensitivity for metabolic syndrome: a study in North

Indian population. J Lab Physicians 2019;11:244-8.

수치

Figure 1. Flow diagram of the selection and continuity of study participants.
Table 1 depicts the demographic and anthropometric data for  the healthy control subjects and MetS subjects
Table 4 explains the detectable accuracy of all the surrogate mark- mark-ers of IR and insulin secretion in identifying MetS among the  south-ern-Indian subjects in our study population

참조

관련 문서

Relationship between Metabolic Syndrome and Mental Health in Korean adults; Using the 7th Korea National.. Health and

Objective: This study was conducted to identify the association between vitamin D and osteosarcopenia among all adults in Korea using data from the Korea National Health

Frequency and clinical significance of the expression of the multidrug resistance proteins MDR1/P-glycoprotein, MRP1, and LRP in acute myeloid leukemia: a

Biochemical markers of bone turnover can be classified according to the process that underlie in markers of bone formation, products of the osteoblast

 mutual exclusion and complementary  application similar to IR.  sensitive to local environment and

In this thesis, a methodology using the VISSIM simulation model and surrogate safety assessment model (SSAM) was utilized to quantify the impacts of the leading

Values of Glucose, T-protein, T-cholesterol and Triglyceride of Blistered fluid caused by Buhang blistering --- 19..

Objective: This study was conducted to identify the association between vitamin D and Sarcopenia among all adults in Korea using data from the National Health and