Use of Serum Homocysteine to Predict Cardiovascular Disease in Korean Men with or without Metabolic Syndrome
The aim of this study was to examine whether serum homocysteine (Hcy) levels correlated with cardiovascular disease (CVD) depending on the presence or absence of metabolic syndrome (MetS) in Korean men. We conducted a case-control study, including 138 CVD and 290 non-CVD age-matched control subjects. The subjects were divided into four subgroups: 34 CVD/MetS, 104 CVD, 77 MetS, and 213 normal subgroups. The mean Hcy was significantly higher, whereas HDL and intake of vitamin B1 and B2 were lower in the CVD group (P < 0.05) than non-CVD group. When compared to the control group, subjects with CVD/MetS, CVD and MetS exhibited high Hcy levels, with the highest observed in the CVD/MetS subgroup (P < 0.001). Multivariate stepwise linear regression between CVD and markers of CVD showed Hcy significantly correlated with CVD (P < 0.05).
To predict CVD based on Hcy, Hcy threshold of 11.72 µM in non-MetS subjects had an area under the curve (AUC) of 0.664 (95% CI 0.598-0.731). In MetS subjects, the AUC was 0.618 and Hcy threshold was 13.32 μM (95% CI 0.509-0.726). The results of our study show that the presence of MetS needs to be considered when using Hcy levels for predicting CVD.
Key Words: Homocysteine; Cardiovascular Diseases; Metabolic Syndrome; Cut-off Points Ji Yeon Kang1, Ill Keun Park1,
Ji Young Lee1, Sook Hee Sung1, Youn Koun Chang1, Yoo Kyoung Park2,3, and Tae In Choi1
1Radiation Health Research Institute, Korea Hydro &
Nuclear Power Co., Ltd, Seoul; 2Department of Medical Nutrition, Kyung Hee University, Yongin;
3Research Institute of Clinical Nutrition, Kyung Hee University, Seoul, Korea
Received: 20 September 2011 Accepted: 7 February 2012 Address for Correspondence:
Tae In Choi, MD
Radiation Health Research Institute, Korea Hydro & Nuclear Power Co., Ltd, 308 Uicheon-ro, Dobong-gu, Seoul 132-703, Korea
Tel: +82.2-3499-6650, Fax: +82.2-3499-6622 E-mail: [email protected]
The study was supported by grant from the Korea Hydro &
Nuclear Power project (E08NJ22).
http://dx.doi.org/10.3346/jkms.2012.27.5.500 • J Korean Med Sci 2012; 27: 500-505
INTRODUCTION
Traditional risk factors for cardiovascular disease (CVD), such as diabetes mellitus, dyslipidemia, hypertension, smoking and low physical activity have been used to assess the risk of CVD (1, 2). However, these characteristics do not fully explain cardiovas- cular risk. Therefore, there has been a focus on newly identified risk factors such as increased plasma homocysteine (Hcy), C- reactive protein (CRP), B-type natriuretic peptide level, and met- abolic syndrome (MetS) (3, 4).
Although the mechanism that explains the relationship be- tween elevated plasma Hcy levels and CVD is unclear, Hcy is a strong and independent risk factor for CVD, particularly coro- nary heart disease, stroke and atherosclerosis (5, 6). Common- ly, hyperhomocysteinemia was defined with a Hcy level above 12 μM (7) or 15 μM (8). Some studies quantified the Hcy levels as quartile (6, 9) or quintile (10), and compared above and be- low 12 μM (7). Subsequently, the contribution of Hcy to the pre- diction or diagnosis on CVD is still undetermined.
MetS is known as a cluster of cardiovascular risk factors asso- ciated with insulin resistance, hypertension, glucose intoler- ance, hypertriglyceridemia and low levels of HDL, and is the concurrence of multiple metabolic abnormalities in an individ- ual (11). MetS is associated with increased cardiovascular events
and death (4), and is a cardiovascular risk factor, but not an in- dependent predictive index along with diabetes, obesity, dys- lipidemia, and smoking. Therefore, Wang et al. (3) stated the importance of putative biomarkers to standard risk factors for CVD risk assessment of individuals.
The Skaraborg project found a significant association between Hcy and insulin resistance index including serum insulin and HOMA-IR, and provided a potential link between MetS and hy- perhomocysteinemia (12). In previous studies using Korean adults, MetS and its components were shown to have a signifi- cant correlation with a high level of Hcy (9, 13). However, the Persian Gulf Healthy Heart Study (14) indicated that no associ- ation between MetS using NCEP-ATP III criteria and Hcy. Fur- thermore, a few studies have shown that Hcy levels were not dif- ferent based on the presence of MetS using NCEP-ATP III crite- ria in Korean type 2 diabetes patients (15, 16). There is contro- versy concerning the usefulness of Hcy based on whether the patient has MetS, but, no comprehensive study was performed on the predictive values of Hcy for CVD in subjects with or with- out MetS so far.
Therefore, in the present study, we investigated the associa- tion of Hcy with CVD and MetS and proposed optimal cut-off points for the prediction of CVD based on MetS.
MATERIALS AND METHODS Subjects and study design
This was a retrospective case-control study, in which 4,043 indi- viduals without pre-existing CVD between the ages of 40 to 59 yr participated in annual regular health check-ups in 2008. 3,886 of 4,043 individuals were participated health follow-up in 2009 and 2010. A total of 138 CVD patients who were newly diagnosed with CVD in 2009 or 2010 were included in this study and clas- sified as the CVD group. The incidence of CVD cases were de- fined as fatal and nonfatal myocardial infarction, stroke, angina, heart failure, peripheral vascular event, revascularization (coro- nary artery bypass surgery or angioplasty with or without stent- ing) and CVD-related hospital admissions. Age- and the num- ber of MetS components non-CVD group, who were recruited and provided informed consent, consisted of 290. The subjects were assigned in about 2:1 ratio to either the non-CVD group or CVD group. Finally, non-CVD and CVD groups were divided into four subgroups depending on the presence of MetS. In to- tal, 428 men were included in the final analyses: 213 normal subgroup, 77 MetS subgroup, 104 CVD subgroup, and 34 CVD/
MetS subgroup.
Measurements
Anthropometry of each subject was conducted by experienced research staff. Height and weight were measured with the sub- ject standing straight wearing light clothing (InBody 720; Bio- space, Seoul, Korea). Body mass index (BMI) was calculated as body weight in kilograms divided by height in meters squared (kg/m2). Waist circumference (WC) was obtained at midpoint between the anterior superior iliac crest and lower rib. Blood pressure was recorded in duplicate in a sitting position after 15 min of rest using a sphygmomanometer and the results were averaged.
Blood samples were collected from subjects for all biochemi- cal evaluations after fasting for over 12 hr. Fasting plasma glucose (FPG), total cholesterol (TC), triglyceride (TG), high density lipo- protein cholesterol (HDL) and low density lipoprotein choles- terol (LDL) were measured using enzymatic methods (Cobas Integra 800; Roche Diagnostics, Mannheim, Germany). Hcy and creatine (CRE) were measured by enzyme-linked immune-sor- bent assays (ELISA) using Alisei Quality system (SEAC, Calenz- ano, Italy).
Typical dietary intake was analyzed using a computerized food frequency questionnaire (FFQ). The FFQ consisted of 7 food groups including 108 food items and was based on the FFQ de- veloped by the Korea Center for Disease Control and Preven- tion. It was designed to collect information regarding the usual intake of food over the past one year.
The subjects also completed a computerized self-adminis- tered questionnaire regarding their health-related variables that
included smoking status, alcohol drinking habit and exercise.
We analyzed using the indices of anthropometry and blood sample, and results of FFQ and self-administered questionnaire for 2008.
Definition of MetS
A diagnosis of the MetS was based on modified ATP III defini- tion, in which three of the following five criteria need to be sat- isfied (17):
1) WC: a modified cut-off point of 90 cm for Asia-Pacific men, which is consistent with recommendations from WHO Expert Consultation (18)
2) blood pressure: a systolic blood pressure (SBP) ≥ 130 mmHg or a diastolic blood pressure (DBP) ≥ 85 mmHg or on drug treatment for hypertension
3) TG: ≥ 150 mg/dL (1.7 mM) or on drug treatment for ele- vated TG
4) HDL: < 40 mg/dL (1.0 mM) or on drug treatment for re- duced HDL
5) FPG: ≥ 100 mg/dL (5.6 mM) or on drug treatment for ele- vated FPG
Statistical analyses
For determining sample size statistical software package G*Power (version 3.0.10, Franz Faul, Universität Kiel, Germany) was used.
A total of 400 subjects were calculated as a sample size for α = 0.05 and 95% power among four groups in a fixed-effects ANCOVA model with a two-sided.
All statistical analysis was performed using SPSS for Windows, version 18.0 (SPSS Inc., Chicago, IL, USA). All values are pre- sented as the mean ± standard deviation or number (%). Differ- ences between the two groups were analyzed by an indepen- dent Student’s t-test or chi-square test. In addition, markers of CVD among four groups were assessed by ANOVA and analysis of covariance after adjustment for age (ANCOVA). Pearson’s cor- relation and partial correlation were used to examine the asso- ciation of Hcy and cardiovascular risk factors. Stepwise multiple regression analysis was then used to evaluate the independent associations of these variables in non-MetS and MetS. Sensitiv- ity and specificity of the Hcy criteria to detect CVD were calcu- lated. Based on the receiver operating characteristic (ROC) anal- ysis, the best cut-off point of Hcy was determined from the high- est Youden index, which was defined as follows: sensitivity + specificity-1) (19). All reported P values were two-tailed, and the statistical significance was set at P < 0.05.
Ethics statement
This study was approved by the institutional review board of the Asan Medical Center (IRB No. 2007-0119). Informed written consent was obtained from all subjects following the contents of the study.
RESULTS
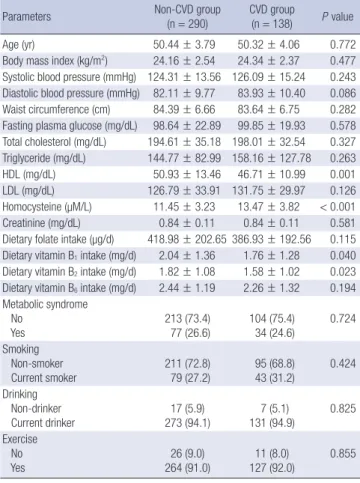
Table 1 shows the general and clinical characteristics of the 428
study subjects (290 CVD and 138 non-CVD). Compared with the non-CVD group, the CVD group had significantly lower val- ue for HDL and dietary intake of vitamin B1 and B2 (HDL, P = 0.001; vitamin B1, P = 0.040; vitamin B1, P = 0.023). Also, Hcy concentration was significantly higher in the CVD group (P <
0.001). There were no significant difference in age, BMI, SBP, DBP, WC, FPG, TC, TG, LDL, MetS, smoking, drinking, and ex- ercise between the two groups (Table 1).
Compared with the control group, the mean age of MetS and CVD/MetS groups were significantly higher (P < 0.001). BMI, SBP, DBP, WC, TC, and TG were higher in CVD and CVD/MetS subgroups than in the control and MetS subgroup (P < 0.001).
In the CVD/MetS subgroup, HDL was significantly lower (P <
0.001) and FPG and Hcy were significantly higher than the nor- mal subgroup (P < 0.001). In addition, LDL was the highest in the CVD/MetS subgroup (Table 2). However, the dietary intakes of B vitamins (folate, B1, B2 and B6) were similar across the sub- groups.
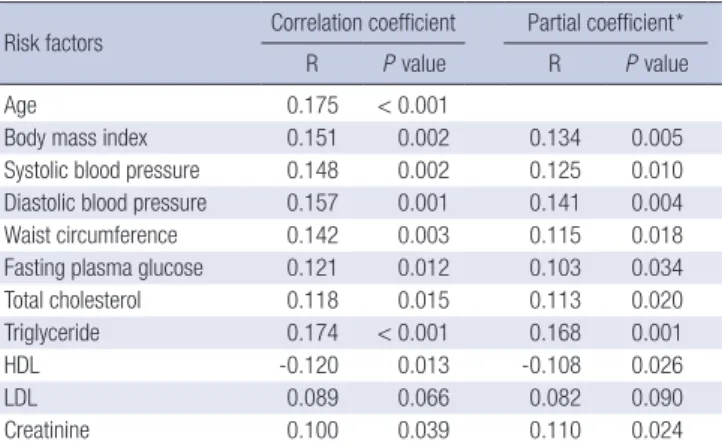
Correlations were analyzed between Hcy and cardiovascular risk factors (Table 3). Hcy demonstrated a statistically significant positive correlation with age (r = 0.175, P < 0.001), BMI (r = 0.151, P = 0.002), SBP (r = 0.148, P = 0.002), DBP (r = 0.157, P = 0.001), WC (r = 0.142, P = 0.003), FPG (r = 0.121, P = 0.012), TC (r = 0.118, P = 0.015), TG (r = 0.174, P < 0.001) and CRE (r = 0.100, P = 0.039) and negative correlation with HDL (r = -0.120, P = 0.013). Adjustment for age did not alter the results (Table 3).
In Table 4, stepwise linear regression analysis using Hcy showed a significant positive coefficient for CVD both in non-MetS sub- jects (β = 0.041, P < 0.001) and MetS subjects (β = 0.027, P = 0.034). Adjustment for age did not alter the results (Table 4).
Fig. 1 shows the ROC curve for Hcy value prediction CVD Table 1. Demographic and clinical characteristics of subjects
Parameters Non-CVD group
(n = 290) CVD group
(n = 138) P value
Age (yr) 50.44 ± 3.79 50.32 ± 4.06 0.772
Body mass index (kg/m2) 24.16 ± 2.54 24.34 ± 2.37 0.477 Systolic blood pressure (mmHg) 124.31 ± 13.56 126.09 ± 15.24 0.243 Diastolic blood pressure (mmHg) 82.11 ± 9.77 83.93 ± 10.40 0.086 Waist circumference (cm) 84.39 ± 6.66 83.64 ± 6.75 0.282 Fasting plasma glucose (mg/dL) 98.64 ± 22.89 99.85 ± 19.93 0.578 Total cholesterol (mg/dL) 194.61 ± 35.18 198.01 ± 32.54 0.327 Triglyceride (mg/dL) 144.77 ± 82.99 158.16 ± 127.78 0.263 HDL (mg/dL) 50.93 ± 13.46 46.71 ± 10.99 0.001 LDL (mg/dL) 126.79 ± 33.91 131.75 ± 29.97 0.126 Homocysteine (µM/L) 11.45 ± 3.23 13.47 ± 3.82 < 0.001 Creatinine (mg/dL) 0.84 ± 0.11 0.84 ± 0.11 0.581 Dietary folate intake (µg/d) 418.98 ± 202.65 386.93 ± 192.56 0.115 Dietary vitamin B1 intake (mg/d) 2.04 ± 1.36 1.76 ± 1.28 0.040 Dietary vitamin B2 intake (mg/d) 1.82 ± 1.08 1.58 ± 1.02 0.023 Dietary vitamin B6 intake (mg/d) 2.44 ± 1.19 2.26 ± 1.32 0.194 Metabolic syndrome
No Yes
213 (73.4) 77 (26.6)
104 (75.4) 34 (24.6)
0.724 Smoking
Non-smoker Current smoker
211 (72.8) 79 (27.2)
95 (68.8) 43 (31.2)
0.424 Drinking
Non-drinker Current drinker
17 (5.9) 273 (94.1)
7 (5.1) 131 (94.9)
0.825 Exercise
No Yes
26 (9.0) 264 (91.0)
11 (8.0) 127 (92.0)
0.855
Data are mean ± standard deviation or n (%). HDL, high density lipoprotein choles- terol; LDL, low density lipoprotein cholesterol.
Table 2. Comparison of markers of cardiovascular risk according to cardiovascular disease and metabolic syndrome
Parameters Non-CVD group CVD group
P value*
Normal (n = 213) MetS (n = 77) CVD (n = 104) CVD/ MetS (n = 34)
Age (yr)† 49.81 ± 3.73a 52.17 ± 3.42b 49.92 ± 4.17a 51.53 ± 3.51a,b < 0.001
Body mass index (kg/m2) 23.55 ± 2.23a 23.81 ± 1.96a 25.88 ± 2.55b 25.97 ± 2.77b < 0.001
Systolic blood pressure (mmHg) 121.53 ± 13.03a 122.69 ± 13.72a 131.68 ± 11.19b 136.56 ± 14.69b < 0.001 Diastolic blood pressure (mmHg) 79.99 ± 9.26a 82.07 ± 9.48a 87.68 ± 8.19b 89.66 ± 10.99b < 0.001
Waist circumference (cm) 82.64 ± 5.88a 81.87 ± 5.59a 89.27 ± 6.06b 89.09 ± 6.99b < 0.001
Fasting plasma glucose (mg/dL) 96.65 ± 24.78a 98.32 ± 18.48a,b 104.15 ± 15.41b 104.66 ± 23.35b 0.036 Total cholesterol (mg/dL) 188.97 ± 32.29a 190.25 ± 30.77a 203.72 ± 39.47b 215.03 ± 26.47b < 0.001 Triglyceride (mg/dL) 118.58 ± 51.29a 130.58 ± 82.28a 218.11 ± 110.45b 242.13 ± 193.31b < 0.001
HDL (mg/dL) 52.75 ± 12.65a 48.15 ± 11.25b 45.97 ± 14.51b 42.29 ± 8.85c < 0.001
LDL (mg/dL) 124.53 ± 32.60a 127.28 ± 29.80a 132.04 ± 36.71a 145.50 ± 26.25b < 0.001
Homocysteine (µM/L) 10.89 ± 2.86a 13.11 ± 3.99b 13.02 ± 3.60b 14.60 ± 2.92c < 0.001
Creatinine (mg/dL) 0.83 ± 0.11 0.84 ± 0.11 0.86 ± 0.10 0.85 ± 0.11 0.148
Dietary folate intake (µg/d) 409.28 ± 184.51 445.81 ± 245.36 386.73 ± 182.82 387.51 ± 222.77 0.231
Dietary vitamin B1 intake (mg/d) 2.01 ± 1.38 2.10 ± 1.30 1.80 ± 1.24 1.64 ± 1.40 0.204
Dietary vitamin B2 intake (mg/d) 1.80 ± 1.10 1.88 ± 1.02 1.60 ± 0.99 1.49 ± 1.11 0.134
Dietary vitamin B6 intake (mg/d) 2.39 ± 1.14 2.57 ± 1.34 2.29 ± 1.28 2.19 ± 1.46 0.358
Data are mean ± standard deviation. *P values were calculated by ANCOVA with adjusted by age; †P value was calculated by ANOVA. HDL, high density lipoprotein cholesterol;
LDL, low density lipoprotein cholesterol. a,b,cMeans with each superscript letter are significantly different among four groups.
based on the presence of MetS. In non-MetS subjects, the area under the curve (AUC) was 0.664 (95% confidence interval [CI], 0.598-0.731) and Hcy of 11.72 μM was the cut-off point, with a sensitivity of 61.5% and a specificity of 62.4% (P < 0.001). Also, Hcy cut-off point to predict CVD in MetS subjects was 13.32 μM with the best combination of sensitivity (70.6%) and specificity (50.6%) yielding the highest Youden index and 0.618 AUC (95%
CI, 0.509-0.726; P = 0.049).
DISCUSSION
We investigated the usefulness of Hcy for predicting cardiovas- cular disease in subjects with and without MetS. The cut-off points of Hcy, which are 11.72 μM for non-MetS subjects and 13.32 μM for MetS subjects, are optimal for yielding the maxi- mal sensitivity plus specificity for predicting CVD.
Hcy is known as an independent predictive biomarker for CVD (20), causing an increase in oxygen stress and a decrease
in endothelial function and thus, enhancing thrombotic events (5). Hcy levels changed depending on sex, age, smoking and intake of coffee, alcohol and folate (9, 21-24). Boushey et al. (20) reported that an increase in Hcy for 5 μM/L is associated with an odds ratio (OR) for coronary artery disease (CAD) of 1.6 for men. Also, several studies demonstrated a relationship between Hcy and risk of obesity, diabetes, dyslipidemia, hypertension and MetS (25-27), although Veerkamp et al. (28) reported that no association was found between plasma Hcy concentration and plasma lipid levels, nor between Hcy and insulin resistance.
In particular, the roles of insulin and/or insulin resistance in de- termining plasma Hcy have been demonstrated (29).
The WC, index of abdominal obesity and one of the compo- nents of MetS showed positive correlation with Hcy (7, 30), but no difference of Hcy level between subjects with WC ≥ 90 cm and with WC < 90 cm (13). Similarly, Koehler et al. (31) report- ed a weak positive relationship between BMI and Hcy concen- trations, which was similar to our result. Jacques et al. (24) sug- gested that persons with BMI ≥ 30.7 kg/m2 had slightly higher plasma Hcy concentrations than those with a BMI < 30.7 kg/m2. The Hodaland Homocysteine Study investigators reported a U- shaped association between BMI and Hcy concentrations that Table 3. Correlation of homocysteine and cardiovascular risk factors
Risk factors Correlation coefficient Partial coefficient*
R P value R P value
Age 0.175 < 0.001
Body mass index 0.151 0.002 0.134 0.005
Systolic blood pressure 0.148 0.002 0.125 0.010 Diastolic blood pressure 0.157 0.001 0.141 0.004
Waist circumference 0.142 0.003 0.115 0.018
Fasting plasma glucose 0.121 0.012 0.103 0.034
Total cholesterol 0.118 0.015 0.113 0.020
Triglyceride 0.174 < 0.001 0.168 0.001
HDL -0.120 0.013 -0.108 0.026
LDL 0.089 0.066 0.082 0.090
Creatinine 0.100 0.039 0.110 0.024
*Data are given as Pearson’s correlation (R) coefficients with adjustment for age. HDL, high density lipoprotein cholesterol; LDL, low density lipoprotein cholesterol.
Table 4. Variables identified by stepwise regression analysis as being predictive of CVD in non-MetS and MetS
Variables
Non-MetS (n = 317) MetS (n = 111) Unstandardized
coefficients P value
Unstandardized coefficients P
value
β SE β SE
Homocysteine 0.041 0.007 < 0.001 0.027 0.013 0.034
HDL -0.006 0.002 0.003
Adjusted R2 0.114 0.032
Data are regression coefficient. SE, standard error; HDL, high density lipoprotein cho- lesterol.
Fig. 1. Receiver-operating-characteristic curves of Hcy for CVD according to the (A) non-MetS subjects, (B) MetS subjects.
Sensitivity Sensitivity
1-Specificity 1-Specificity
0.0 0.2 0.4 0.6 0.8 1.0 0.0 0.2 0.4 0.6 0.8 1.0
1.0
0.8
0.6
0.4
0.2
0.0
1.0
0.8
0.6
0.4
0.2
0.0
A B
disappeared after adjustment for other determinants of Hcy con- centrations (32). Lim et al. (15) suggested that we should use a different index and standard of defining obesity according to ethnicity as well as East and West affiliation, because people with different ethnicities have different characteristics of obesi- ty. We agreed with this opinion, and large-scale prospective stud- ies are needed to establish a suitable index and standard of obe- sity for Korean.
Like our result, positive association between Hcy and blood pressure was reported in several studies (13, 22, 24, 32). How- ever, Sun et al. (6) found negative correlation and Shin et al. (9) reported no correlation between Hcy and blood pressure.
Hcy and lipid metabolism were interrelated at least in part via methyl group donors (33). Moreover, hyperhomocystein- emia in mice was associated with a decreased activity of hepat- ic thiolase and serum lecithin-cholesteol acylransferase (LCAT), which are two important enzymes involved in HDL metabolism (34). Real et al. (27) and Obeid and Herrmann (33) showed sig- nificant negative correlation between Hcy and HDL, but no cor- relations with other lipid profiles. In our study, a relationship was found between Hcy levels and the lipid profile (TC, TG and HDL), except for LDL.
B vitamins (vitamin B1, B2, B6, B12, and folate) are involved in homocysteine metabolism (35). In addition, numerous obser- vational studies suggested that B vitamins may provide a pro- tective effect due to the Hcy-lowering effect (36). Chang et al.
(37) showed that the dietary intake of folate, thiamin (vitamin B1), riboflavin (vitamin B2) and vitamin C were inversely associ- ated with the risk of hyperhomocysteinemia in diabetic patients.
In this study, the intakes of vitamin B1 and B2 were significantly low in CVD subjects, although there was no significant relation between Hcy and B vitamins (data not shown). Therefore, the deficiency of vitamin B2 could cause a secondary deficiency in folate (38), leading to an increase of plasma Hcy. Although plas- ma folic acid and vitamim B12 were not measured in this study, none of the patients had a history or laboratory evidence of ane- mia attributable to low plasma folate and vitamim B12. There are just 3 published studies of CVD outcomes related to Hcy levels in men (mean age about 50 yr) (28, 39, 40). The mean Hcy level among controls in the different studies varied from 9.9 μM to 10.9 μM. In this study, Hcy levels of 10.89 μM were similar to other results in the control group, but the non- CVD group had higher Hcy levels of 11.45 μM. This may be be- cause the non-CVD group included subjects with MetS. Previ- ous observations and our study indicated that individuals with MetS a had higher Hcy level than control subjects (9, 13). Ntaios et al. (25) found that several drugs used in MetS patients influ- ence Hcy levels. Therefore, to determine the optimal cut-off point of Hcy for CVD, we must consider the presence of MetS or the medication usage for the subjects.
A variety of large-scale prospective cohorts have specified
only 1 vascular disease: stroke (10) or coronary heart disease (8). Moreover, there was no agreement on the cut-off point for the diagnosis of hyperhomocysteinemia, and there are few stud- ies that suggested optimal cut-off point by Youden’s index. We determined that 11.72 μM in non-MetS and 13.32 μM in MetS may be the optimal cut-off point for CVD. These values that were higher than 9.47 μM were the most appropriate cut-off point value of Hcy for cardiovascular events by Sun et al. (6). Despite Hcy being influenced by sex, Sun et al. (6) have not suggested a cut-off point of Hcy for CVD according to sex.
This study had a limitation because of the challenges with inter- preting data in a case-control study to determine the optimal cut- off point. Although the discriminatory poser of our study was suf- ficient, the non-CVD group was selected by a matching method.
The strength of this study was that it was a large-scale study conducted in a comparatively short period. It is difficult to con- duct an epidemiological study on CVD. Because the incremental costs of diagnosis for CVD, such as computed tomography (CT), treadmill test (TMT) and coronary arteriography (CAG), were huge. Also, diagnosis of CVD could take long to gather sufficient CVD cases. Nevertheless, our findings identified important issues for further study and provided possible explanations for impor- tant clinical findings on relationships among Hcy, MetS and CVD.
In conclusion, this study shows that the cut-off value of Hcy for predicting the CVD is influenced by presence of MetS. A prospective longitudinal study would be necessary to address these issues as well as to identify factors determining the Hcy level in response to the development of CVD with or without MetS. In addition, the feasibility of incorporating Hcy in clinical screening for primary prevention warrants further research.
REFERENCES
1. Wilson PW, D’Agostino RB, Levy D, Belanger AM, Silbershatz H, Kan- nel WB. Prediction of coronary heart disease using risk factor categories.
Circulation 1998; 97: 1837-47.
2. Hamer M, Stamatakis E. Physical activity and risk of cardiovascular dis- ease events: inflammatory and metabolic mechanisms. Med Sci Sports Exerc 2009; 41: 1206-11.
3. Wang TJ, Gona P, Larson MG, Tofler GH, Levy D, Newton-Cheh C, Jacques PF, Rifai N, Selhub J, Robins SJ, et al. Multiple biomarkers for the predic- tion of first major cardiovascular events and death. N Engl J Med 2006;
355: 2631-9.
4. Gami AS, Witt BJ, Howard DE, Erwin PJ, Gami LA, Somers VK, Montori VM. Metabolic syndrome and risk of incident cardiovascular events and death: a systematic review and meta-analysis of longitudinal studies. J Am Coll Cardiol 2007; 49: 403-14.
5. Ozkan Y, Ozkan E, Simşek B. Plasma total homocysteine and cysteine levels as cardiovascular risk factors in coronary heart disease. Int J Car- diol 2002; 82: 269-77.
6. Sun Y, Chien KL, Hsu HC, Su TC, Chen MF, Lee YT. Use of serum homo- cysteine to predict stroke, coronary heart disease and death in ethnic Chi-
nese: 12-year prospective cohort study. Circ J 2009; 73: 1423-30.
7. Kang SS, Wong PW, Malinow MR. Hyperhomocyst(e)inemia as a risk factor for occlusive vascular disease. Annu Rev Nutr 1992; 12: 279-98.
8. Rossi GP, Maiolino G, Seccia TM, Burlina A, Zavattiero S, Cesari M, Sticchi D, Pedon L, Zanchetta M, Pessina AC. Hyperhomocysteinemia predicts total and cardiovascular mortality in high-risk women. J Hyper- tens 2006; 24: 851-9.
9. Shin KP, Lee SY, Kim YJ, Lee JG, Kim DH, Jung DW, Yi YH, Park SK, Cho YH. The association of homocysteine and metabolic syndrome. Korean J Obes 2011; 20: 16-22.
10. Fallon UB, Elwood P, Ben-Shlomo Y, Ubbink JB, Greenwood R, Smith GD. Homocysteine and ischaemic stroke in men: the Caerphilly study. J Epidemiol Community Health 2001; 55: 91-6.
11. DeFronzo RA, Ferrannini E. Insulin resistance. A multifaceted syndrome responsible for NIDDM, obesity, hypertension, dyslipidemia, and athero- sclerotic cardiovascular disease. Diabetes Care 1991; 14: 173-94.
12. Björck J, Hellgren M, Råstam L, Lindblad U. Associations between serum insulin and homocysteine in a Swedish population: a potential link be- tween the metabolic syndrome and hyperhomocysteinemia: the Skaraborg project. Metabolism 2006; 55: 1007-13.
13. Choi JW, Kim SH, Yeon CH, Jung KC. The association between homo- cysteine and features of the metabolic syndrome. Kwandong Med J 2006;
10: 31-7.
14. Nabipour I, Ebrahimi A, Jafari SM, Vahdat K, Assadi M, Movahed A, Moradhaseli F, Obeidi N, Sanjdideh Z. The metabolic syndrome is not associated with homocysteinemia: the Persian Healthy Heart Study. J Endocrinol Invest 2009; 32: 406-10.
15. Lim DM, Park KY, Koh GP. The biochemical markers of coronary heart disease correlates better to metabolic syndrome defined by WHO than by NCEP-ATP III or IDF in Korean type 2 diabetic patients. Korean Diabe- tes J 2008; 32: 157-64.
16. Lim DM, Park KY, Kim BJ, Lee KW, Lee MJ, Yom YS, Koh GP. Cardiovas- cular risk according to the components of metabolic syndrome in type 2 diabetes. Korean Clin Diabetes 2009; 10: 196-203.
17. Grundy SM, Cleeman JI, Daniels SR, Donato KA, Eckel RH, Franklin BA, Gordon DJ, Krauss RM, Savage PJ, Smith SC Jr, et al. Diagnosis and man- agement of the metabolic syndrome: an American Heart Association/
National Heart, Lung, and Blood Institute Scientific Statement. Circula- tion 2005; 112: 2735-52.
18. WHO Expert Consultation. Appropriate body-mass index for Asian pop- ulations and its implications for policy and intervention strategies. Lan- cet 2004; 363: 157-63.
19. Hilden J, Glasziou P. Regret graphs, diagnostic uncertainty and Youden’s Index. Stat Med 1996; 15: 969-86.
20. Boushey CJ, Beresford SA, Omenn GS, Motulsky AG. A quantitave assess- ment of plasma homocysteine as a risk factor for vascular disease. Prob- able benefits of increasing folic acid intakes. JAMA 1995; 274: 1049-57.
21. Das M, Ghose M, Borah NC, Choudhury N. A community based study of the relationship between homocysteine and some of the life style fac- tors. Indian J Clin Biochem 2010; 25: 295-301.
22. Kim SJ, Lim KS, Song MS, Kang YJ, Lee SY. Prevalence of hyperhomocys- teinemia and related factors in a community-based health examination survey: a cross-sectional study. J Prev Med Public Health 2009; 42: 337-42.
23. Chew SC, Khor GL, Loh SP. Association between dietary folate intake and blood status of folate and homocysteine in Malaysian adults. J Nutr
Sci Vitaminol (Tokyo) 2011; 57: 150-5.
24. Jacques PF, Bostom AG, Wilson PW, Rich S, Rosenberg IH, Selhub J.
Determinants of plasma total homocysteine concentration in the Fam- ingham Offspring cohort. Am J Clin Nutr 2001; 73: 613-21.
25. Ntaios G, Savopoulos C, Chatzopoulos S, Mikhailidis D, Hatzitolios A.
Iatrogenic hyperhomocysteinemia in patients with metabolic syndrome:
a systematic review and metaanalysis. Atherosclerosis 2011; 214: 11-9.
26. Karatela RA, Sainani GS. Plasma homocysteine in obese, overweight and normal weight hypertensives and normotensives. Indian Heart J 2009;
61: 156-9.
27. Real JT, Martinez-Hervas S, Garcia-Garcia AB, Chaves FJ, Civera M, Ascaso JF, Carmena R. Association of C677T polymorphism in MTHFR gene, high homocysteine and low HDL cholesterol plasma values in heterozygous familial hypercholesterolemia. J Atheroscler Thromb 2009; 16: 815-20.
28. Veerkamp MJ, de Graaf J, den Heijer M, Blom HJ, Stalenhoef AF. Plasma homocysteine in subjects with familial combined hyperlipidemia. Ath- erosclerosis 2003; 166: 111-7.
29. Jacobs RL, House JD, Brosnan ME, Brosnan JT. Effects of streptozotocin- induced diabetes and of insulin treatment on homocysteine metabolism in the rat. Diabetes 1998; 47: 1967-70.
30. Pitla S, Nagalla B. Gender-related difference in the relationship between plasma homocysteine, anthropometric and conventional biochemical coronary heart disease risk factors in middle-aged Indians. Ann Nutr Metab 2009; 54: 1-6.
31. Koehler KM, Romero LJ, Stauber PM, Pareo-Tubbeh SL, Liang HC, Baumgartner RN, Garry PJ, Allen RH. Vitamin supplementation and other variables affecting serum homocysteine and methylmalonic acid concen- trations in elderly men and women. J Am Coll Nutr 1996; 15: 364-76.
32. Nygård O, Vollset SE, Refsum H, Stensvold I, Tverdal A, Nordrehaug JE, Ueland M, Kvåle G. Total plasma homocysteine and cardiovascular risk profile. The Hordaland Homocysteint Study. JAMA 1995; 274: 1526-33.
33. Obeid R, Herrmann W. Homocysteine and lipids: S-adenosyl methionine as a key intermediate. FEBS Lett 2009; 583: 1215-25.
34. Namekata K, Enokodi Y, Ishii I, Nagai Y, Harada T, Kimura H. Abnormal lipid metabolism in cystathionine beta-synthase-deficient mice, an ani- mal model for hyperhomocysteinemia. J Biol Chem 2004; 279: 52961-9.
35. Finkelstein JD. The metabolism of homocysteine: pathways and regula- tion. Eur J Pediatr 1998; 157: S40-4.
36. Brouwer IA, van Dusseldorp M, Thomas CM, Duran M, Hautvast JG, Eskes TK, Steegers-Theunissen RP. Low-dose folic acid supplementation decreases plasma homocysteine concentrations: a randomised trial. In- dian Heart J 2000; 52: S53-8.
37. Chang NS, Kim JM, Kim HS, Cho YW. Plasma total homocysteine and macrovascular complications are associated with food and nutrient intake in patients with type II diabetes mellitus. Nutr Res Pract 2007; 1: 79-83.
38. Selhub J, Jacques PF, Wilson PW, Rush D, Rosenberg IH. Vitamin status and intake as primary determinants of homocysteinemia in an elderly population. JAMA 1993; 270: 2693-8.
39. Chambers JC, Obeid OA, Refsum H, Ueland P, Hackett D, Hooper J, Turner RM, Thompson SG, Kooner JS. Plasma homocysteine concentra- tions and risk of coronary heart disease in UK Indian, Asian and Euro- pean men. Lancet 2000; 355: 523-7.
40. Shahram F, Faridar A, Hamedani MG, Nadji A, Naderi N, Mojarad Shafiee N, Rasker JJ, Davatchi F. Plasma homocysteine level in patients with Be- hcet’s disease with or without thrombosis. Arch Iran Med 2010; 13: 476-81.