883
(Received 17 July 2019; Received in revised form 28 August 2019; accepted 3 September 2019)
Abstract − Two-phase flow near the wellbore in volatile oil reservoirs causes complications in well test analysis. In this study, the flow behavior of volatile oil reservoirs below the bubble-point pressure and the potential of radial composite model for interpretation of two-phase well test in volatile oil reservoirs was investigated. A radial composite model was used for two-phase well test analysis. A new procedure was developed to interpret well test data and estimate the radius of the two-phase region. The changes in fluid composition near the wellbore during drawdown test were found to increase the saturation pressure, which affects the saturation profile during build-up. Well test results showed that the radial composite method is a powerful tool for well test characterization and estimation of reservoir parameters. The proposed procedure was able to estimate the reservoir parameters and radius of the two-phase region with acceptable accuracy.
Key words: Radial composite model, Two-phase flow, Volatile oil reservoir, Well test analysis
1. Introduction
Hydrocarbon resources have been the most important source of energy in recent decades; and hence, many studies have been conducted on the discovery, production, processing and storage of these resources.
Petroleum reservoirs are broadly classified as oil or gas reservoirs.
The differences in phase behavior, coupled with the physical properties of reservoir rock that determine the relative ease with which liquid and gas are transmitted or retained, result in many diverse types of hydrocarbon reservoirs with complex behaviors [1-5].
In volatile oil reservoirs, when the bottomhole wellbore pressure (Pw) falls below the bubble point pressure of the reservoir fluid (Pb), dissolved gas in oil vaporizes and gas saturation increases near the wellbore. Initially, the liberated gas is immobile, but after a short period of time gas saturation increases and flows toward the well [6,7]. This behavior is similar to gas condensate systems with flowing wellbore pressure below the dew-point pressure. The existence of a two-phase flow region near the wellbore reduces the mobility of gas/oil and causes the log-log pressure derivative curve of a radial homogeneous reservoir to behave same as a ‘‘radial composite’’ system. The first region (Region 1) is the altered region with reduced effective permeability duo to two-phase gas-oil flow.
The second region (Region 2) is the virgin zone with original permeability (Fig. 1) [8].
There are two approaches that can be used for well test analysis of
volatile oil systems with Pw<Pb. In the first method, radial composite method, pressure data are directly used for well test analysis. This approach estimates effective permeability, skin, radius of gas bank, and distance to the fault/boundary. The important issue in using this method concerns the duration of test, which should be long enough such that the pressure response reaches beyond the two phase region [8]. In the second method, the Raghavan two–phase pseudo-pressure technique is employed. By two-phase pseudo-pressure approach, the near wellbore effects induced by the two phase flow will be eliminated.
Therefore, it has been suggested that conventional methods developed for well test analysis of single phase oil reservoirs might be safely used [9,10]. However, two-phase pseudo-pressure method requires correct knowledge of the relative permeability of fluids which are usually not available.
Extensive published literature exists regarding behavior diagnosis and well test analysis of gas condensate systems by radial composite and two-phase pseudo-pressure methods [8,11-16]. However, only a few publications have dealt with volatile oil reservoirs below Pb [6,7]. Hence, the behavior of volatile oil reservoirs has not been well understood and pressure transient test analysis has not been well developed for reservoir characterization in two-phase volatile oil reservoirs.
The aim of this study was to investigate the behavior of volatile oil reservoir and characterize it through well test analysis. For this purpose, the flow behavior of volatile oil reservoirs near the wellbore and the saturation profile in drawdown and build-up tests below Pb were fully assessed. Subsequently, the radial composite model was used for two-phase well test analysis. A new procedure was presented for estimating the radius of two-phase region when the saturation profile is unknown. Synthetic test data generated by a commercial
†To whom correspondence should be addressed.
E-mail: [email protected]
This is an Open-Access article distributed under the terms of the Creative Com- mons Attribution Non-Commercial License (http://creativecommons.org/licenses/by- nc/3.0) which permits unrestricted non-commercial use, distribution, and reproduc- tion in any medium, provided the original work is properly cited.
reservoir simulator were used to check the applicability of the proposed method and investigate the flow behavior.
2. Theory and background
The well test interpretation model for volatile oil reservoirs with Pw<Pb, is a two-region radial composite model to represent the two- phase (oil and gas) region around the wellbore (Region 1) and a single-phase oil region away from the well (Region 2). This model is characterized by mobility and storativity changes in the radial direction, resulting in two radial flow stabilizations on the log-log pressure derivative curve. Therefore, interpretation of test data in a volatile oil reservoir that shows a composite behavior will yield the inner and outer zone effective permeabilities (Keff1 and Keff2), the wellbore skin (Sw), the total skin (St), the mobility ratio between various regions (kh/μ)1/2 and the outer radius of two-phase region (Ri) [8].
To determine the two-phase radius (Ri) from well test data, different methods have been proposed [17-22], all of which require evaluation of the total compressibility in the two-phase region around the wellbore [11]. Bozorgzadeh and Gringarten [11] proposed a procedure to characterize the condensate bank from pressure build-up test data and interpret well test data in gas condensate systems. We employed this procedure (which will be referred to as Analysis#1 herein) to analyze the pressure build-up data in a volatile oil reservoir. To use the above method for characterizing volatile oil reservoirs, oil saturation of the two-phase region near the wellbore at the time of shut-in must be determined.
However, in some cases, there is not enough data to estimate the oil saturation of two-phase region near the wellbore. Therefore, in this study, another procedure has been also presented for estimation of the total compressibility and interpretation of well test data. This method (which will be referred to as Analysis#2 herein) is based on
the fact that the mobility ratio (M) and diffusivity ratio (D) described by Eqs. (1) and (2) are both independent of viscosity and compressibility.
Therefore, they can be estimated from the log-log pressure derivative plots, through type curve matching without calculation of the total compressibility and viscosity of fluids in the two-phase near-wellbore region.
(1)
(2)
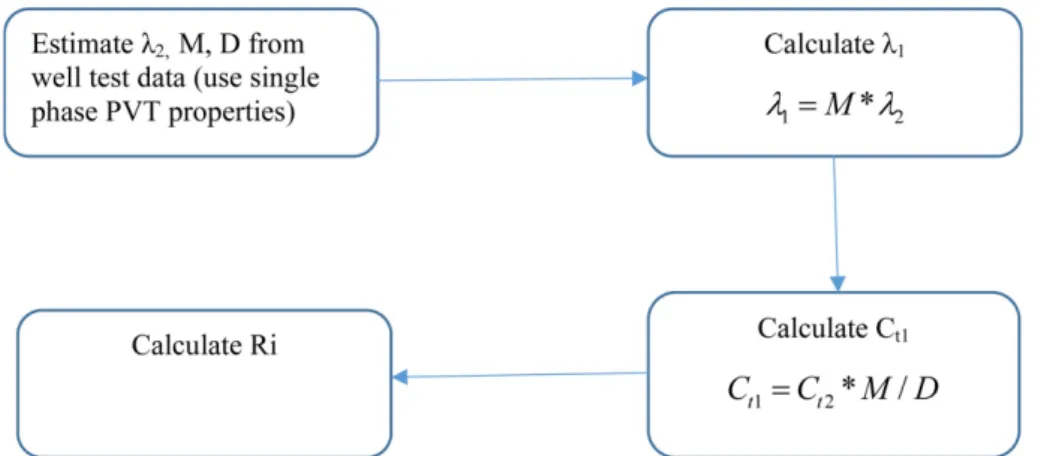
Thereafter, the two-phase total compressibility could be calculated from the mobility ratio (M), diffusivity ratio (D), and single-phase total compressibility (Ct2). The following steps have been proposed for well test analysis using this method:
1. Calculate the mobility of the single-phase outer region (λ2) from well test data using the fluid properties of single-phase oil at average reservoir pressure.
2. Estimate the mobility ratio (M) and diffusivity ratio (D) through matching pressure and derivative data with a radial composite model.
3. Calculate the two-phase total compressibility (Ct1) using the mobility ratio (M), diffusivity ratio and single-phase total compressibility (Ct2):
(3) 4. Calculate the mobility of the two-phase region (λ1) using the mobility ratio and the mobility of the single-phase oil region.
(4) 5. Calculate the radius of the two-phase region from well test data, based on the total compressibility of two-phase region.
1 1 2
2 1 2 singlephase
/
twophase
k k
M λλ μ μ
⎛ ⎞ ⎛ ⎞
= = ⎜ ⎟ ⎜ ⎟
⎝ ⎠ ⎝ ⎠
1 2
1 1 2 2 singlephase
/
t twophase t
k h k h
D μ φC μ φC
⎛ ⎞ ⎛ ⎞
= ⎜ ⎟ ⎜ ⎟
⎝ ⎠ ⎝ ⎠
1 2* /
t t
C =C M D
1 M* 2
λ = λ
Fig. 1. Gas saturation profile near the wellbore.
Fig. 2 presents the proposed procedure for determination of well test parameters.
3. Model construction
In the present study, simulations were carried out to investigate the well test behavior of volatile oil systems with Pw<Pb, and to identify the challenges in well-test analysis of these reservoirs. In all cases, the reservoir was single-layer, isotropic and homogeneous with constant thickness. Gravitational and frictional effects along with wellbore storage were neglected. Furthermore, near-wellbore effects were ignored, except for the cases that these effects are mentioned. The data used for the simulation model are summarized in Table 1.
A single-layer simulation model was built with 48 cells. To simulate various phenomena occurring around the wellbore accurately, the grid size was logarithmically increased in the radial direction, with larger grid cells away from the wellbore and finer ones around it. The outer radius of the model was considered to be large enough to ensure that the outer boundary effects do not affect the transient well test data. High resolution time steps were used specially at the beginning of each test duration.
Two volatile oil samples, A and B, with different volatility criteria were used in this study. Fluid properties are listed in Table 2. Modified Peng-Robinson equation of state (EOS) with three parameters was
used to model PVT properties of the reservoir fluids. Three different relative permeability curves were employed to estimate the interrelation of relative permeability and saturation (see Fig. 3).
4. Results and Discussion
To investigate the impacts of various reservoir conditions on well test behavior, successive 5-days drawdowns and 5-days build-ups (DD1, BU1, DD2, and BU2) were designed and simulated to generate synthetic test data. Fig. 4 presents the pressure and rate histories for a typical simulation run (Case 1). Seven runs were implemented using different rates, initial pressures, wellbore skins, fluid compositions, and gas-oil relative permeability models (see Table 3).
4-1. Phase behavior
In a volatile oil reservoir, during a drawdown test, when Pw drops Fig. 2. Proposed procedure for determination of well test parameters.
Table 1. Model parameters (base model)
Parameter Value Parameter Value
Porosity (%) 9 Reservoir temperature (oC) 146
Absolute permeability (m2) 4.93E-15 Initial reservoir pressure (MPa) 34
Net to-Gross ratio 1 Initial water saturation 0
Wellbore radius (m) 0.08 Residual oil saturation 10%
Top depth (m) 3048 Critical gas saturation 5%
Reservoir thickness (m) 30.48
Table 2. Fluid properties
Properties Fluid A (base) Fluid B
Pb (MPa) 33.58 28.47
Rs (m3/m3) 311.33 505.65
Bo at Pb (m3/Sm3) 2.08 2.53
Fig. 3. Relative permeability curves.
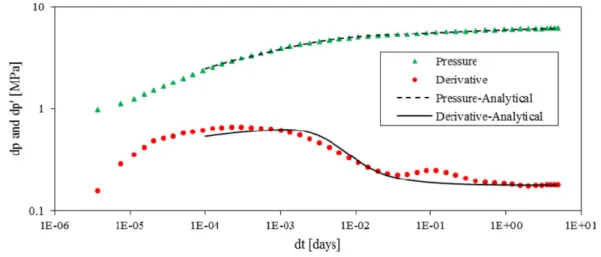
below Pb, a two-phase (oil and gas) flow zone is created near the wellbore with high gas saturation level, whereas the single-phase oil remains away from the wellbore. The size of the near wellbore region with high gas saturation increases with duration of drawdown
test, as shown in Fig. 5. Moreover during the test, the amounts of heavy end components in oil increase and those of light end components decrease towards the wellbore (see Fig. 6). The fluid composition of near-wellbore region cannot return to the original fluid composition due to the loss of light components.
During the subsequent build-up, dissolution of the free gas near the wellbore (remained from the previous drawdown) depends on the difference between the average reservoir pressure and Pb. If this difference is high enough (like Case 2 with an initial pressure of 38 MPa), the liberated gas condenses into the oil and the near-wellbore gas saturation returns to the initial gas saturation during build-up, as shown in Fig. 7(a). But if the two pressures are close to each other (like Case 1 with an initial pressure of 34 MPa), the liberated gas cannot condense into the oil and remains as a separate phase, as shown in Fig. 7(b). In fact, the above-mentioned behavior depends on the saturation pressure of fluid near the wellbore, which varies due to fluid composition changes during production (Fig. 8). Therefore, if the build-up pressure is above the saturation pressure of near- wellbore fluid, the liberated gas dissolves into oil during the build-up test; otherwise, it remains as a separate gas phase.
4-2. Well test behavior
In volatile oil reservoirs with Pw>Pb, the mobility of volatile oils can be evaluated using a method similar to that employed for black oils, because they exhibit the same trends in drawdown and build-up tests. Below Pb, at the beginning of build-ups, oil exhibits a lower relative Fig. 4. Pressure and rate histories (case 1).
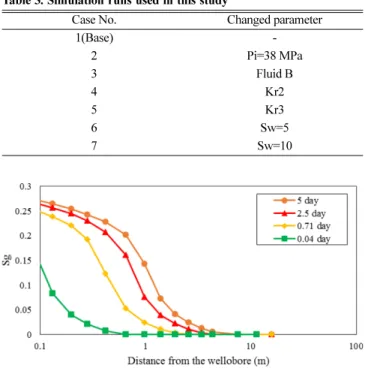
Table 3. Simulation runs used in this study
Case No. Changed parameter
1(Base) -
2 Pi=38 MPa
3 Fluid B
4 Kr2
5 Kr3
6 Sw=5
7 Sw=10
Fig. 5. Gas saturation profile near the wellbore in the DD1 test at differ- ent times from the beginning of production (Case 1).
Fig. 7. Gas saturation profiles at the end of drawdown and build-up tests below Pb: (a) Case 2: Pi=38 MPa (b) Case 1: Pi=34 MPa.
mobility, as shown in Fig. 9(b), with higher early time derivative stabilizations during the build-up test. This behavior corresponds to the lower mobility at the end of previous drawdown, i.e., higher late time derivative stabilizations of drawdown test as shown in Fig. 9(a).
Consequently, the log-log pressure-derivative behavior of volatile oil reservoirs below Pb corresponds to a radial composite model, with decreasing mobility during drawdowns and increasing mobility during build-ups (Fig. 9).
4-3. Well test analysis
The procedure described in the theory and background section
was implemented with computer generated build-up data, as depicted in Fig. 4. Analysis was performed on pressure data using the two- zone radial composite model and the two mentioned procedures (Analysis#1 and Analysis#2). It is notable that well-test analysis is usually conducted on build-up test data, since drawdown data may be altered by rate fluctuations and wellbore dynamics [12]. In the following section, discussions focus on analyzing build-up tests.
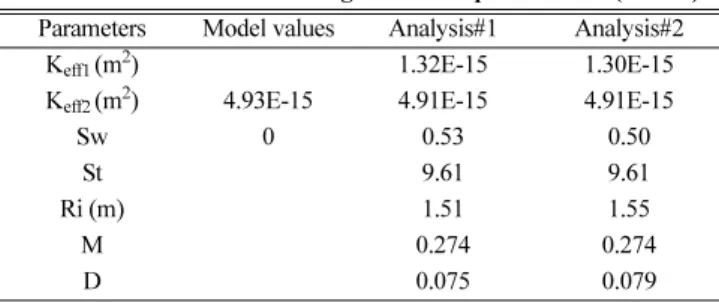
Fig. 10 shows analysis of build-up test (BU1) following drawdown with 79 Sm3/day oil rate in Case 1. In this figure, two radial-flow stabilizations are visible on the pressure derivative curve, indicating a two-region radial-flow composite behavior. Therefore, the radial Fig. 8. Saturation pressure profile for flow periods at the end of drawdown and build-up tests (Case 2).
Fig. 9. Log-log pressure and derivative in (a) DD1 test and (b) BU1 test for Case 1.
Fig. 10. Log-log pressure and derivative matching of the BU1 test (Case 1).
Keff1 (m2) 1.12E-15 2.40E-15 1.47E-15 1.11E-15 1.12E-15
Keff2 (m2) 4.93E-15 4.90E-15 4.81E-15 4.67E-15 4.80E-15 4.78E-15
Sw 0 0.40 0.22 0.41 6.83 13.3
St 9.87 3.39 10.40 33.30 57.10
Ri (m) 1.58 2.14 3.03 1.93 1.94
M 0.243 0.498 0.249 0.315 0.315
D 0.058 0.166 0.063 0.098 0.098
Fig. 11. Analysis of volatile oil reservoir with radial composite model: (a) Case 3: fluid B (b) Case 4: Kr2 (c) Case 5: Kr3, (d) Case 6: Sw=5, (e) Case 7: Sw=10
wellbore and subsequent reduction in oil relative permeability. The other reason for this mismatch arises from model assumptions. The radial composite model assumes average values for the inner zone.
However, as shown in Fig. 1, the gas saturation in the near wellbore zone is increasing toward the well bore.
The outer radius of the two-phase region was calculated using the obtained storativity ratios. The obtained radius was within an acceptable range compared to the actual radius of two-phase region that can be calculated from gas saturation profile in Fig. 7(b) for Case 1. The slight difference between the actual radius and predicted one might be due to the changes in saturation profile during build-up, compared to that in the preceding drawdown (Fig. 7(b)), which has been already stated for gas condensate systems. This difference could be reduced if accurate PVT properties of the produced well stream at the time of production are used for calculations [11].
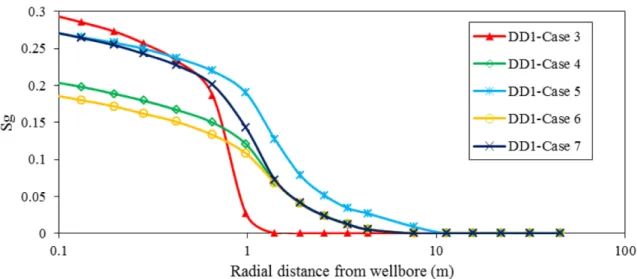
To check the validity of the described method, other models were analyzed using different parameters. As presented in Table 3, Case 3 included a different fluid, (Fluid B) with higher volatility, while in Cases 4 and 5, relative permeability was changed. In Cases 6 and 7, wellbore skin was changed to 5 and 10, respectively. In all models, other parameters were similar to Case 1. Results of two-phase well test analysis of these cases are presented in Fig. 11(a) for fluid B (Case 3), Figs. 11(b) and 11(c) for models with different relative permeabilities (Cases 4 and 5), and Figs. 11(d) and 11(e) for different wellbore skins (Sw=5 Case 6, Sw=10 Case 7). In all cases, two stabilizations were observable on the pressure derivative response.
Therefore, the two-region radial composite model was selected for well test analysis. Table 5 represents the actual parameters and the predicted ones represents the actual parameters and the predicted ones. As can be seen, in all cases, the actual and estimated values of permeabilities and wellbore skins were within acceptable ranges.
Fig. 12 indicates the saturation profiles of the mentioned cases at the end of drawdown. Comparison between the actual and predicted radius of two-phase regions shows that the predicted ones were in acceptable ranges. The radius was underestimated in some cases,
which could be attributed to the saturation changes in drawdowns and build-ups, as previously discussed.
5. Conclusion
Well test behavior of volatile oil reservoirs below Pb was investigated based on synthetic generated data. The potential of radial composite method in the interpretation of two-phase volatile oil well test data was examined. The following conclusions were also drawn:
(1) Saturation profiles in the drawdown and build-up tests in a two-phase flow near the wellbore revealed that the liberated gas in the drawdown test of volatile oil reservoirs may completely condense into the oil during subsequent build-up, if the average reservoir pressure is much higher Pb. However, if the reservoir pressure is close to Pb, the liberated gas cannot condense into the oil and remains as a separate phase.
(2) Well test analysis using pressure data shows a composite behavior for volatile oil reservoirs below the Pb due to the presence of a high gas saturation zone around the wellbore with decreasing mobility during drawdowns and increasing mobility during build-ups.
(3) Radial composite models could be successfully employed for well test interpretation and estimation of reservoir parameters including permeability, wellbore skin and radius of the two-phase region, provided that test duration is long enough to reach the single-phase oil region.
(4) The new procedure developed in this study estimates the radius of the two-phase region with acceptable accuracy and therefore, can be very useful when saturation profile near the wellbore is not available.
Nomenclature
Variables BU : Buildup test
Bo : Oil formation volume factor [m3/Sm3] Fig. 12. Saturation profile at the end of DD1 in different cases.
Pb : Bubble point pressure Pi : Initial pressure Pw : Wellbore pressure
Ri : Two-phase outer radius [m]
Rs : Solution gas oil ratio [m3/m3] Sw : Wellbore skin
St : Total skin
Greek letters λ : Mobility µ : Viscosity [kg/m·s]
Ø : porosity
Subscripts and Superscripts b : bubble point
i : initial g : gas o : oil r : relative t : total w : wellbore
References
1. Ahmed, T., Reservoir engineering handbook, 4th ed., Elsevier.
(2010).
2. Lee, Y., et al., “A Simulation Study on the Analysis of Optimal Gas Storage System of the Depleted Gas Reservoir,” Korean Chem- ical Engineering Research, 45(5), 515-522(2007).
3. Kwon, S., et al., “The Development of Evaluation Chart for the Applicability of CO2 Flooding in Oil Reservoirs and Its Appli- cations,” Korean Chemical Engineering Research, 45(6), 638-647 (2007).
4. Bae, J., Sung, W. and Kwon, S., “An Experimental Analysis of Hydrate Production using Multi-Well, Plate-Type Cell Appara- tus,” Korean Chemical Engineering Research, 45(3), 304-309 (2007).
5. You, H. D., “Plan for Hydrocarbon Underground Storage in Korea,” Korean Chemical Engineering Research, 15(1), 61-70 (1977).
19216),” SPE Formation Evaluation, 3(03), 578-594. (1988).
10. Raghavan, R., “Well-Test Analysis for Multiphase Flow,” SPE Formation Evaluation, 4(04), 585-594(1989).
11. Bozorgzadeh, M. and Gringarten, A. C., “Condensate Bank Charac- terization from Well Test Data and Fluid PVT Properties,” SPE Reservoir Evaluation & Engineering, 9(05), 596-611 (2006).
12. Gringarten, A. C., et al., Well Test Analysis in Gas-Condensate Reservoirs, in SPE Annual Technical Conference and Exhibition held in Dallas, Society of Petroleum Engineers: Texas (2000).
13. Xu, S. and Lee, W. J., Two-Phase Well Test Analysis of Gas Condensate Reservoirs, in SPE Annual Technical Conference and Exhibition, Society of Petroleum Engineers: Houston, Texas (1999).
14. Mazloom, J. and Rashidi, F., “Use of Two-phase Pseudo Pres- sure Method to Calculate Condensate Bank Size and Well Deliv- erability in Gas Condensate Reservoirs,” Petroleum Science and Technology, 24(2), 145-156(2006).
15. Yousefi, S., Eslamian, A. and Rashidi, F., “Investigation of Well Test Behavior in Gas Condensate Reservoir Using Single-phase Pseudo-pressure Function,” Korean J. of Chemical Engineering, 31(1), 20-28(2014).
16. Shahbazi, S., Maarefvand, P. and Gerami, S., “Transient Pressure Test Analysis of Horizontal Wells in Gas Condensate Reservoirs:
Evaluation of Conventional Multi-phase Pseudo-pressure Solu- tions,” J. of Petroleum Science and Engineering, 145, 668-688 (2016).
17. Van Poolen, H., “Radius-of-drainage and Stabilization-time Equa- tions,” Oil Gas J, 62(37), 138-146(1964).
18. Ramey, H., “Approximate Solutions for Unsteady Liquid Flow in Composite Reservoirs,” J. of Canadian Petroleum Technology, 9(01), (1970).
19. Odeh, A., “Flow Test Analysis for a Well with Radial Disconti- nuity,” J. of Petroleum Technology, 21(02), 207-210(1969).
20. Satman, A., Eggenschwiler, M. and Ramey, Jr., H. J., Interpretation of Injection Well Pressure Transient Data in Thermal Oil Recovery, in SPE California Regional Meeting, Society of Petroleum Engi- neers, Los Angeles, California (1980).
21. Olarewaju, J. S. and Lee, W. J., A Comprehensive Application of a Composite Reservoir Model to Pressure Transient Analysis, in SPE California Regional Meeting, Society of Petroleum Engi- neers, Ventura, California (1987).
22. Olarewaju, J. S., Lee, J. W. and Lancaster, D. E., “Type- and Decline-Curve Analysis with Composite Models,” SPE Forma- tion Evaluation, 6(01), 79-85(1991).