− 626 − 대한지역사회영양학회지 18(6) : 626~643, 2013
Korean J Community Nutr 18(6) : 626~643, 2013 http://dx.doi.org/10.5720/kjcn.2013.18.6.626
보건소를 방문한 경계성 고혈압 환자의 저염식생활 영양교육 참여정도에 따른 혈압, 나트륨 섭취 및 식행동 변화에 관한 연구
정은진·권종숙
1)·안소현·손숙미
†가톨릭대학교 생활과학부 식품영양학전공,
1)신구대학교 식품영양학과
Blood Pressure, Sodium Intake and Dietary Behavior Changes by Session Attendance on Salt Reduction Education Program for Pre-hypertensive Adults
in a Public Health Center
Eun-Jin Jung, Jong-Sook Kwon
1), So-Hyun Ahn, Sook Mee Son
†Department of Food Science & Nutrition, The Catholic University of Korea, Bucheon, Korea
1)
Department of Food & Nutrition, Shingu College, Songnam, Korea
Abstract
This study was performed to evaluate the differences in blood pressure, sodium intake and dietary behavior changes according to the extent of session attendance on sodium reduction education program for pre-hypertensive adults in a public health center. Sodium reduction education program consisted of 8 sessions for 8 weeks. Fifty three patients who completed the pre and post nutritional assessments were classified into 2 groups according to the session attendance rate. Nineteen participants who attended the education program 3 times or less (≤ 3) were categorized into the less attendance (LA) group and 34 participants attended 4 times or more (≥ 4) into the more attendance (MA) group. Blood pressure, anthropometric measurements, serum lipid profile, nutrient intakes including sodium, nutrition knowledge and dietary behavior score were assessed before and after the nutrition education program. Mean sodium intakes (p < 0.001), systolic/diastolic blood pressure (p < 0.001), and weight (p < 0.001) were significantly decreased in the MA group after sodium reduction education program. Compared to the MA group, mean sodium intakes, systolic/
diastolic blood pressure were not significantly changed after the education program even with significantly increased nutrition knowledge (p < 0.05) and dietary behavior score (p < 0.01) in the LA group. It appears that pre-hypertensive adults need to attend the sodium reduction education program for at least 4 times or more to gain beneficial effects from the intervention. Positive feedback of healthcare team or offering more cooking classes may be needed to raise the attendance rate in the sodium reduction education program. (Korean J Community Nutr 18(6) : 626~643, 2013) KEY WORDS : high blood pressure·sodium intake·session attendance·salt reduction education program·prehypertensive adults
—————————————————————————
서 론
—————————————————————————
고혈압은 그 자체가 하나의 질병이면서 뇌졸중 및 각종 심 혈관계질환의 주요 원인이 되며(Kearney 등 2005), 우리 나라 30세 이상 성인의 고혈압은 2008년 26.9%에서 2009 년 30.3%, 2010년 28.9% 로 지속적으로 증가하는 추세에 있다.
고혈압의 원인에는 나트륨의 과잉섭취와 더불어 비만, 알 코올섭취, 운동부족, 흡연 등이 있으나(Blaustein 등 1991;
Kolasa 2003) 그중에서도 나트륨의 과다섭취는 혈액의 부 피를 증가시킬 뿐 아니라 혈관을 수축시키는 노르에피네프 린의 분비를 촉진하여 말초혈관의 저항을 증가시킴으로써 혈
접수일: 2013년 18월 19일 접수수정일: 2013년 10월 31일 수정 채택일: 2013년 11월 13일 채택
*This research was supported by a grant of the Food-hygiene Fund, 2007, the Gyeonggi-Province.
†Corresponding author: Sook Mee Son, Department of Food Science & Nutrition, The Catholic University of Korea, 43 Jibong- ro, Womi-gu Bucheon-Si, Gyeonggi-do 420-743, Korea
Tel: (02) 2164-4318, Fax: (02) 2164-4310 E-mail: [email protected]
This is an Open-Access article distributed under the terms of the Creative Commons Attribution Non-Commercial License(http://
creativecommons.org/licenses/by-nc/3.0) which permits unrestricted non-commercial use, distribution, and reproduction in any medium, provided the original work is properly cited.
정은진·권종숙·안소현·손숙미·627
압상승을 가져 오고, 한편으로는 혈관 벽을 뻣뻣하게 만들고 두껍게 하여 뇌졸중을 유발시킨다(De Wardener &
MacGregor 2002).
32개국 52개 센터를 중심으로 연구한 Intersalt study에 서는 20~59세 성인의 경우 수축기 혈압과 이완기 혈압이 나트륨의 배설량과 정의 상관관계가 있었으며, 나트륨배설 량으로 부터 추정된 하루 나트륨섭취량이 393~1181 mg (소금으로 1~3 g)으로 낮은 집단에서는 고혈압이 거의 없 거나 고혈압 유병률이 5% 미만인 반면, 하루에 3543 mg (소금으로 9 g) 이상의 높은 소금나트륨섭취량을 보인 집단 에서는 고혈압 유병률이 8~9%로 높았다고 보고되었다 (Carvalho 등 1989).
한국인의 경우 평균 나트륨섭취량은 1998년~2010년 사 이에 4500 mg 이상으로 나타났는데 이는 한국인의 나트륨 목표섭취량인 2000 mg(KNS 2010)의 2배를 초과하는 수 준이다(Song 등 2013). 보건복지부와 식품의약품안전처에 서는 2005년부터 가공식품의 나트륨관련 표시기준을 강화 하고 가공식품의 나트륨함량을 모니터링 하는등 나트륨에 대 한 교육, 홍보 및 정보제공을 강화하고 있음에도 불구하고 나 트륨섭취량은 2008년 4727.9 mg에서 2010년 5059.5 mg으로 오히려 증가하는 추세를 보이고 있다(Song 등 2013).
한국인의 높은 나트륨 섭취량은 전통적으로 김치, 장류, 생 선, 젓갈등의 소금함량이 높은 전통음식을 과다하게 섭취하 는 것과 관련이 있으며(Kim & Paik 등 1987) 실제로 김치 로부터 전체 나트륨 섭취량의 27.1%, 국·찌개로부터 21.8%, 어패류 반찬으로부터 12.2%를 섭취하고 있다고 보고되었 다(Son 등 2007). 최근 12년간의 국민건강영양조사를 분 석한 결과 나트륨의 주요급원으로 김치(22.8~31.7%), 면 및 만두류(10.5~13.8%), 국및 탕류(10.2~13.8%), 찌개 및 전골류(8.5~11.2%)로 보고하였다(Song 등 2013). 나 트륨 섭취량과 관련된 식행동 보고에서 중년층은 짠맛선호 도나 식탁염첨가, 국물섭취가 높은 반면 젊은 층은 외식, 배 달 음식을 많이 먹고 라면과 물김치국물을 많이 먹는다고 보 고되었다(Park 등 2008).
고혈압은 약물치료도 중요하지만 초기단계부터 생활습관 개선이 중요하다. 수축기혈압 120~139 mmHg, 이완기혈 압 80~89 mmHg인 경계성고혈압의 경우에도 심혈관질환 의 위험이 증가하며(Stamler 1993) 고혈압으로 가기 전 단계로써 약물치료 없이 식생활개선과 운동요법을 먼저 실 시하도록 하고 있다(Whelton 등 2002). 만성질환의 예방 및 관리를 위한 건강증진사업이 시행됨에 따라 보건소에서 는 고혈압환자를 대상으로 영양교육을 통한 나트륨섭취 저
감화와 혈압관리사업을 시행하고 있다. 보건소에서의 고혈 압환자대상 영양교육효과에 관한 연구를 보면 고혈압관리 를 받고 있는 여자노인을 대상으로 6주간 총 20회의 영양 교육 프로그램을 실시한 결과 교육 전에 5323.6 mg이던 나트륨섭취량이 교육 후에는 3581.0 mg으로 유의하게 감 소했으며 소금섭취와 관련된 식지식과 식행동이 긍정적으 로 변화되고 이완기혈압이 유의하게 감소하였다고 보고되 었다(Yim 2008). 또한 보건소의 경계성 고혈압 환자를 대 상으로 8주간의 영양교육과 8주간의 추후 지도 결과 나트 륨섭취의 유의한 감소와 함께 수축기혈압, 이완기혈압이 교 육 전에 비해 유의하게 감소하였다(Jung 등 2012). Jung 등(2009)은 중등학생 대상으로 싱겁게 먹기 영양교육 프 로그램을 4차시로 제작하여 실시한 결과 교육 후 싱겁게 먹 는 편이 증가했고 식행동 점수, 영양지식 평균점수가 높아 졌다고 보고하였다. 그러나 보건소에 등록된 만 50세 이상 고혈압환자를 대상으로 총 4회의 영양교육을 실시한 결과 영양지식은 상승하고 나트륨섭취는 유의하게 감소하였으나 혈압의 유의한 변화는 없었다고 하여(Moon & Kim 2011) 영양교육 기간, 프로그램의 종류, 영양교육 프로그램에 따 라 차이를 보이고 있다.
보건소를 중심으로 한 영양교육을 실시할 때 제일 중요한 것은 대상자들의 높은 관심과 더불어 대상자를 건강증진 프 로그램에 지속적으로 참여시키는 것이다. 일반적으로 초기 에는 많은 사람들이 참석하지만 나중에는 불규칙하게 참석 하거나 중도탈락자가 발생하게 되는데 이는 중재활동효과를 낮출 뿐 아니라 비용, 효율측면에서도 비경제적이다(Wee
& Koh 2011).
대상자들의 건강프로그램 참여정도에 영향을 미치는 요 인들에는 개인의 사회·경제적요인 외에도 어떤 이웃을 두 고 있느냐도 포함된다(Fielding 1982). Yim(1998)은 영 양교육애 지속적으로 참여한 참여자와 중간에 탈락한 불참 자의 특성을 분석했는데 불참자는 참여자에 비해 여자노인 의 경우 종교 활동 참가비율이 낮았으며 흡연율이 높고, 자 아 존중감과 인지된 건강상태가 더 낮았다고 보고했으며 Huff 등(2011)은 가정혈압사업에 계속적인 참여를 막는 장애요인으로서 잊어버리는 것, 시간이 없는 것, 스스로 게 으르다고 생각하는 것 등으로 나타났다고 했다.
그동안 대부분의 보고서들은 영양교육을 완료한 대상자들 을 중심으로 효과를 보고하고 있고 중간에 탈락하거나 참석 횟수가 낮은 대상자들의 데이터는 보고에서 누락되어 있다.
실제로 Moon & Kim(2011)은 1회 교육 참석자 51명중 4
회 교육에 모두 참석한 35명을 최종 연구대상으로 했으며
Yim(2008)의 연구는 총 70명 중 16주간의 교육프로그램
628 ·경계성 고혈압환자의 저염식생활 영양교육 참여 정도에 따른 혈압, 나트륨 섭취
에 모두 참여한 40명을 대상으로 효과를 분석한 것이다.
따라서 영양교육프로그램에서 중도에 탈락하거나 참여횟 수가 적은 사람들의 특성과 영양교육효과를 비교 분석하면 차후 지역사회 고혈압환자를 대상으로 한 저염식생활 영양 교육프로그램 수립 시에 도움이 될 것으로 생각된다.
이에 본 연구에서는 보건소를 방문한 경계성 고혈압환자 를 대상으로 8주간의 저염식생활 영양교육을 실시했을 때 4 회 이상 영양교육 프로그램에 참여한 군과 3회 이하 참석한 군의 특성을 비교하고 영양교육 효과의 차이를 비교분석 함 으로써 향후 고혈압환자들을 대상으로 한 건강증진 프로그 램의 효율적인 수립에 도움이 되는 자료를 제공하고자 한다.
—————————————————————————
연구대상 및 방법
—————————————————————————
1. 연구대상 및 기간
본 연구는 경기도 성남지역의 보건소에서 성인 경계성 고 혈압환자 75명을 대상으로 2007년 5월부터 7월까지 8주 동안 주 1회 저염식생활 영양교육을 실시한 것으로 영양교 육 실시전의 1차 조사와 8주후의 2차 조사에 모두 참여한 53명을 대상으로 하였다. 그동안의 저염식생활 교육에서 4 회 이상 참석한 군에서 짠맛에 대한 미각과 고염식태도가 개 선되었다고 보고되었으며(Shin 등 2008), Moon & Kim (2011)은 고혈압환자를 대상으로 총 4회의 교육을 실시한 결과 영양지식은 증가하고 나트륨섭취는 유의하게 감소되었 다고 보고되었으므로 적어도 4회 이상 참석한 군에서 교육 효과가 일부 나타나는 것으로 보인다. 따라서 본 연구에서는 53명 중 4회 이상으로 참석한 대상자를 more attendance 군(MA군, N = 34), 총 8회 교육에서 3회 이하 참석한 대 상자를 less attendance 군(LA군, N = 19) 으로 분류하 여 비교분석 하였다.
2. 기초조사
일반사항에서는 성별, 나이, 가족 수, 교육수준, 영양교육 참여경험, 인지된 건강상태, 고혈압 관리에 대한 관심, 영양 지식의 고혈압관리 적용여부 등을 조사하였다. 대상자들의 신장, 체중, 근육량, 체지방량, 내장지방 등의 체구성을 Inbody 720(Biospace Co, Korea)를 사용하여 측정하였다.
혈압은 5분 정도 안정된 상태를 유지한 후 자동혈압계 (Automatic blood pressure FT-500R, 자원메디칼)를 사용하여 수축기혈압과 이완기혈압을 측정하였다. 혈액검사 의 경우 대상자들이 적어도 10시간의 공복시간을 유지한 후 5ml의 정맥혈을 채취한 다음 보건소 임상병리실에서 자동분 석기(HC16D Hanshin Medical Co, Korea)를 사용하여
혈당, 혈청콜레스테롤, HDL-콜레스테롤, 혈청중성지질 등 을 분석하였다.
3. 영양소 및 나트륨섭취량 조사
대상자들의 1일 영양소 섭취량과 나트륨섭취량을 조사하 기 위해 24시간 회상법을 사용하여 조사전날의 식품섭취량 을 조사하였다. 실물크기의 모형을 사용하여 식품영양학을 전공한 훈련된 조사원이 1 : 1면접에 의해서 조사하였다. 조 사된 식품섭취량을 영양분석프로그램인 Can-Pro 3.0(The Korean Society 2008)을 사용하여 영양소섭취량으로 환 산하였다. 분석된 영양소 섭취량은 한국인 영양섭취기준 (KDRIs, Korean Nutrition Society 2010)과 비교하여 평가하였다. 즉 에너지섭취량은 에너지필요추정량(EER)과 비교하였고 나트륨, 칼륨은 충분섭취량과(AI), 나머지 영양 소에 대해서는 권장섭취량(RI)과 비교하여 영양섭취수준을 평가하였다.
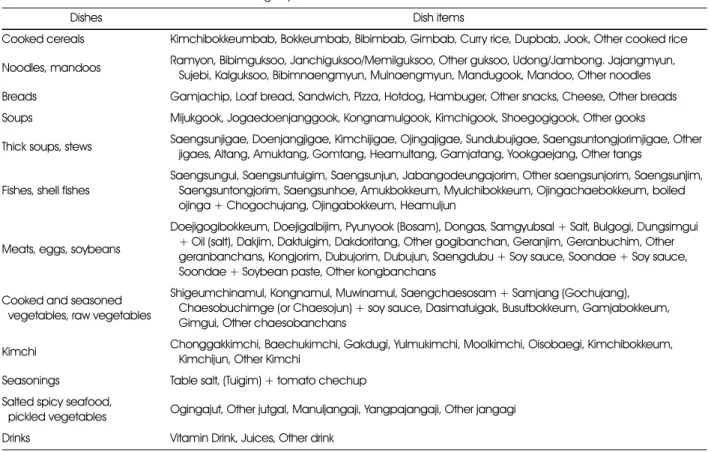
나트륨 섭취량 조사는 24시간 회상법외에도 Son 등 (2006)의 연구에서 개발된 음식섭취빈도지(Dish Fre- quency Questionnaire:DFQ)를 사용하여 분석하였다(Son 등 2005). 즉 음식섭취빈도지에서는 최근 6개월 동안의 섭 취빈도와 함께 국물이 있는 음식의 경우에는 국물을 남기는 지의 여부를 조사하였고, 제시된 섭취량에 비해 ‘이상’, ‘보 통’, ‘이하’중 해당여부를 조사하였으며 섭취빈도 환산점수 와 1인 1회분 분량을 곱하여 음식섭취량을 구한다음 나트륨 섭취량을 계산하였다(Son 등 2005). 음식의 기간별 섭취 빈도는 1주 1일을 1점으로 하여 하루 3회는 21점, 하루 2 회는 14점, 하루 1회는 7점, 하루 5~6회는 5.5점, 3~4회 는 3.5점, 1~2회는 1.5점, 한 달 2~3회는 0.63점, 한 달 1 회는 0.25점으로 환산하여 주당 섭취횟수를 구하였다. 음식 은 총 12가지 음식류로 묶어 각 음식류 별로 포함된 음식항 목의 섭취횟수를 합산하였는데 각 음식류에 포함된 음식항 목은 Table 1과 같다.
4. 소금 섭취와 고혈압관련 영양지식과 식행동 조사
소금 섭취와 고혈압관련 영양지식을 묻는 항목에는 소금 대체식품, 고혈압과 중성지방, 체중, 나이, 스트레스, 유전성 등과의 관련성에 관한 항목으로 10문항을 구성하여(Park 등 2008) ‘그렇다’, ‘아니다’로 조사하였고 맞으면 10점, 틀 리면 0점을 부여하였다.
소금섭취와 관련된 식행동의 경우 고염섭취를 유발하는 식
행동인 건어물이나 생선자반을 좋아하는지, 국물을 남김없
이 먹는지, 외식을 자주하는지 등의 10가지 항목으로 구성
하여 ‘그렇다’고 대답한 경우 10점, ‘아니다’로 대답한 경우
정은진·권종숙·안소현·손숙미·629
에는 0점을 부여하였다.
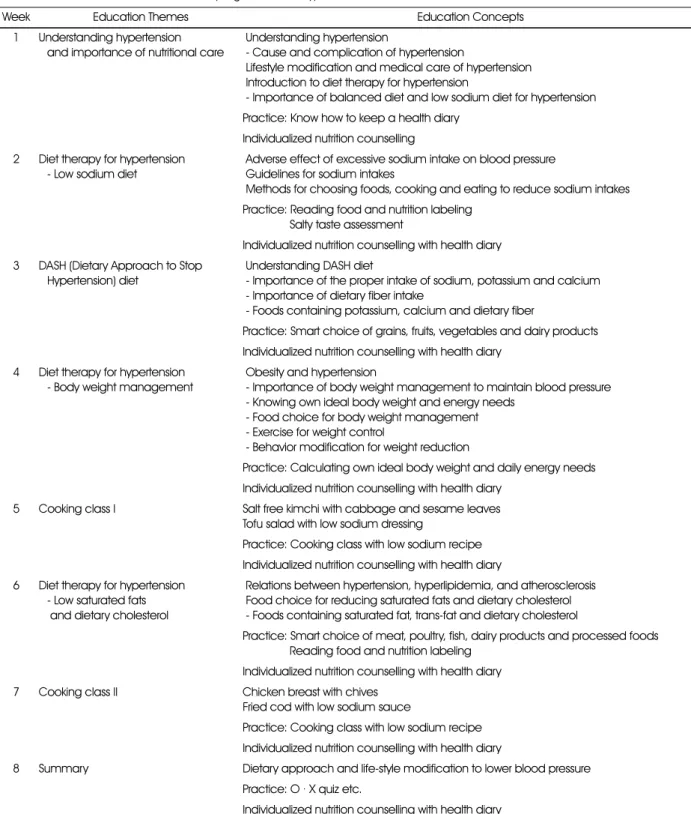
5. 저염식생활 영양교육의 실시
본 연구에서 실시한 저염식생활 영양교육은 Moon(2005), Son & Huh(2006)의 연구와 국민고혈압사업단의 사업내 용, 혈압의 저하와 더불어 소금섭취 감량에도 효과를 보이는 것으로 보고된 대시다이어트(Svetkey 등 2003)를 토대로 구성되었다.
영양교육프로그램은 1회 2시간씩 8주 동안 총 8회에 걸 쳐 실시하였으며 총 6회의 교육과 2회의 저염메뉴 조리실습 으로 구성되으며(Table 2)영양사 면허를 가진 강사가 교육 을 담당하였다.
강의에서는 식품모형, 염도계, 리플릿 등 을 사용했다. 1회 교육에서는 고혈압의 이해와 식사요법의 중요성을 다루었으 며, 특히 저염식생활의 중요성에 대한 강의와 질문형식을 통 해 동기유발을 시켰다. 2회에서는 과량의 소금섭취와 고혈 압과의 관련성, 소금섭취를 줄이기 위한 식품선택 방법과 조 리방법, 영양성분표시 읽기 등을 실시하였다. 3회에서는 우 리나라 식사패턴에 맞춘 대시다이어트를 소개 했으며, 4회 에서는 혈압을 낮추는데 있어 체중감량의 중요성, 6회에서 는 포화지방을 줄이기 위한 시판기름의 선택방법을 교육하
였다. 5회와 7회에서는 채소와 어육류를 이용한 저염 메뉴 를 직접 조리실습을 통해 만들어 시식하는 과정을 통해 저염 음식도 조리방법에 따라 맛있게 할 수 있다는 것을 인식 시 켰다. 8회 교육에서는 배운 내용을 형식으로 다시 한번 복습 시키는 총 정리시간을 가졌으며, 매회 영양교육 후에는 대상 자들이 작성한 식사일지를 영양사가 확인하여 개별적으로 상 담하는 시간을 가졌다(Table 2).
6. 영양교육의 효과 평가
영양교육 효과는 교육전의 기초조사(교육전 조사)와 교 육후의 사후조사(교육후 조사)의 결과를 비교하여 평가하 였다. 사후조사에서는 기초조사와 동일하게 공복상태에서 혈압을 측정했으며 정맥혈을 채취하여 같은 항목을 조사하 였고 영양소 및 나트륨섭취량, 영양지식과 식행동 등을 조 사하였다. 또한 교육후 조사에서는 영양교육의 각 세션이 고혈압이나 저염식생활에 도움이 되었는지의 여부를 조사 하였다.
영양교육 참가횟수에 따른 영양교육 효과의 차이를 보기 위해 대상자를 3회 이하 참석한 LA군과 4회 이상 참석한 MA군으로 나누어서 참가자의 일반 특성과 영양교육 효과를 비교하였다.
Table 1. Kinds of dish items included in each dish group
Dishes Dish items
Cooked cereals Kimchibokkeumbab, Bokkeumbab, Bibimbab, Gimbab, Curry rice, Dupbab, Jook, Other cooked rice Noodles, mandoos Ramyon, Bibimguksoo, Janchiguksoo/Memilguksoo, Other guksoo, Udong/Jambong. Jajangmyun,
Sujebi, Kalguksoo, Bibimnaengmyun, Mulnaengmyun, Mandugook, Mandoo, Other noodles Breads Gamjachip, Loaf bread, Sandwich, Pizza, Hotdog, Hambuger, Other snacks, Cheese, Other breads Soups Mijukgook, Jogaedoenjanggook, Kongnamulgook, Kimchigook, Shoegogigook, Other gooks
Thick soups, stews Saengsunjigae, Doenjangjigae, Kimchijigae, Ojingajigae, Sundubujigae, Saengsuntongjorimjigae, Other jigaes, Altang, Amuktang, Gomtang, Heamultang, Gamjatang, Yookgaejang, Other tangs
Fishes, shell fishes
Saengsungui, Saengsuntuigim, Saengsunjun, Jabangodeungajorim, Other saengsunjorim, Saengsunjim, Saengsuntongjorim, Saengsunhoe, Amukbokkeum, Myulchibokkeum, Ojingachaebokkeum, boiled ojinga + Chogochujang, Ojingabokkeum, Heamuljun
Meats, eggs, soybeans
Doejigogibokkeum, Doejigalbijim, Pyunyook (Bosam), Dongas, Samgyubsal + Salt, Bulgogi, Dungsimgui + Oil (salt), Dakjim, Daktuigim, Dakdoritang, Other gogibanchan, Geranjim, Geranbuchim, Other geranbanchans, Kongjorim, Dubujorim, Dubujun, Saengdubu + Soy sauce, Soondae + Soy sauce, Soondae + Soybean paste, Other kongbanchans
Cooked and seasoned vegetables, raw vegetables
Shigeumchinamul, Kongnamul, Muwinamul, Saengchaesosam + Samjang (Gochujang), Chaesobuchimge (or Chaesojun) + soy sauce, Dasimatuigak, Busutbokkeum, Gamjabokkeum, Gimgui, Other chaesobanchans
Kimchi Chonggakkimchi, Baechukimchi, Gakdugi, Yulmukimchi, Moolkimchi, Oisobaegi, Kimchibokkeum, Kimchijun, Other Kimchi
Seasonings Table salt, (Tuigim) + tomato chechup Salted spicy seafood,
pickled vegetables Ogingajut, Other jutgal, Manuljangaji, Yangpajangaji, Other jangagi Drinks Vitamin Drink, Juices, Other drink
630 ·경계성 고혈압환자의 저염식생활 영양교육 참여 정도에 따른 혈압, 나트륨 섭취
7. 통계분석
자료분석은 SAS 9.1 package program을 사용하였고 수집한 자료에 대해서는 평균과 표준편차, 백분율과 절대빈 도수 등의 기술 통계치로 표시했으며 범주형 변수에 대한 두 군간의 유의차 검증은 χ
2-test로 검증했다. 연속변수에 대
한 영양교육 전후의 비교는 Paired t-test를 사용하였고 영양교육을 3회 이하 받은 LA군과 4회 이상 받은 MA군의 영양교육효과에 따른 차이의 비교는 t-test를 사용하여 검 증하였으며 모든 유의성검증은 P < 0.05 수준에서 이루어 졌다.
Table 2. Salt reduction nutrition education program for the hypertension
Week Education Themes Education Concepts
1 Understanding hypertension and importance of nutritional care
Understanding hypertension
- Cause and complication of hypertension
Lifestyle modification and medical care of hypertension Introduction to diet therapy for hypertension
- Importance of balanced diet and low sodium diet for hypertension Practice: Know how to keep a health diary
Individualized nutrition counselling 2 Diet therapy for hypertension
- Low sodium diet
Adverse effect of excessive sodium intake on blood pressure Guidelines for sodium intakes
Methods for choosing foods, cooking and eating to reduce sodium intakes Practice: Reading food and nutrition labeling
Salty taste assessment
Individualized nutrition counselling with health diary 3 DASH (Dietary Approach to Stop
Hypertension) diet
Understanding DASH diet
- Importance of the proper intake of sodium, potassium and calcium - Importance of dietary fiber intake
- Foods containing potassium, calcium and dietary fiber
Practice: Smart choice of grains, fruits, vegetables and dairy products Individualized nutrition counselling with health diary
4 Diet therapy for hypertension - Body weight management
Obesity and hypertension
- Importance of body weight management to maintain blood pressure - Knowing own ideal body weight and energy needs
- Food choice for body weight management - Exercise for weight control
- Behavior modification for weight reduction
Practice: Calculating own ideal body weight and daily energy needs Individualized nutrition counselling with health diary
5 Cooking class I Salt free kimchi with cabbage and sesame leaves Tofu salad with low sodium dressing
Practice: Cooking class with low sodium recipe Individualized nutrition counselling with health diary 6 Diet therapy for hypertension
- Low saturated fats and dietary cholesterol
Relations between hypertension, hyperlipidemia, and atherosclerosis Food choice for reducing saturated fats and dietary cholesterol - Foods containing saturated fat, trans-fat and dietary cholesterol
Practice: Smart choice of meat, poultry, fish, dairy products and processed foods Reading food and nutrition labeling
Individualized nutrition counselling with health diary 7 Cooking class II Chicken breast with chives
Fried cod with low sodium sauce
Practice: Cooking class with low sodium recipe Individualized nutrition counselling with health diary
8 Summary Dietary approach and life-style modification to lower blood pressure Practice: O · X quiz etc.
Individualized nutrition counselling with health diary
정은진·권종숙·안소현·손숙미·631
—————————————————————————
결 과
—————————————————————————
1. 영양교육 참여횟수에 따른 일반사항
LA군과 MA군은 평균나이가 각각 60.9세, 61.6세로서 군 간에 유의한 차이가 없었으며 가족수에 대해서도 유의한 차이를 보이지 않았다. 성별분포, 학력, 영양교육 참여경험, 인지된 건강상태, 고혈압관리에 대한 관심정도에 대해서도 유의한 차이를 보이지 않았으나 영양지식을 고혈압관리에 활 용하는 여부에 대해서는 MA군의 경우 ‘하고 있다’ 혹은 ‘긍 적적으로 노력 한다’ 등으로 답변한 대상자수가 82.4%를 보
였으나 LA군은 57.9%을 보여 두 군간에 유의한 차이를 보 였다(Table 3).
2. 영양교육 참여횟수에 따른 혈압, 신체계측치, 혈액성상의 변화
MA군의 경우 영양교육 후의 체중이 교육 전 59.2 kg에 서 교육 후 58.7 kg으로 유의하게 감소했으며(P < 0.05), BMI(P < 0.001), 체지방률(P < 0.001)도 유의하게 감소 했고 근육량과 제지방량은 유의하게 증가하였다(P < 0.05).
반면에 LA군의 경우에는 이와같은 변화를 보이지 않았다 (Table 4).
Table 3. General characteristics of the subjects
Variables Less attendance group
(n = 19)
More attendance group (n = 34)
F-value
or χ2-value p-value Sex
Male 3 (15.8)1) 5 (14.7) 90.01 0.9158
Female 16 (84.2) 29 (85.3)
Education
Illiterate 0 (90.0) 0 (90.0) 93.20 0.5247
Elementary school 0 (90.0) 1 (92.9)
Middle school 4 (21.1) 4 (11.8)
High school 5 (26.3) 16 (47.1)
≥ University 10 (52.6) 13 (38.2)
Experience of attending nutrition education
No 17 (89.5) 28 (82.4) 91.21 0.7513
1 time 1 (95.3) 2 (95.9)
≥ 2 times 1 (95.3) 4 (11.8)
Health status
Very good 0 (90.0) 1 (92.9) 90.91 0.9234
Good 4 (21.1) 5 (14.7)
Fair 8 (42.1) 14 (41.2)
Poor 6 (31.6) 12 (35.3)
Very poor 1 (95.3) 2 (95.9)
Interest in hypertension management
Very high 7 (36.8) 8 (23.5) 92.62 0.4533
High 7 (36.8) 20 (58.8)
Low 4 (21.1) 4 (11.8)
Very low. 1 (95.3) 2 (95.9)
Application of nutrition information to hypertension management
Yes 5 (26.3) 6 (17.7) 10.40* 0.0155
Trying positively 6 (31.6) 22 (64.7)
So so 7 (36.8) 2 (95.9)
No 1 (95.3) 4 (11.8)
Age (yrs) 60.7± 6.92) 61.6± 8.1 90.18 0.6729
Family size (persons) 92.7± 1.3 92.7± 1.3 90.03 0.8740
1) N (%) 2) Mean± SD
*: p < 0.05 by χ2 test
632 ·경계성 고혈압환자의 저염식생활 영양교육 참여 정도에 따른 혈압, 나트륨 섭취
수축기혈압의 경우 MA군은 교육 전 135.2 mmHg에서 교육 후 125.9 mmHg로 9.3 mmhg 유의하게 감소했고 (P < 0.001) 이완기혈압도 교육 전 79.0 mmHg에서 교육 후 75.9 mmHg로 3.1 mmhg 유의하게 감소하였다(P <
0.05). 반면에 LA군의 경우에는 교육 후의 SBP와 DBP가 감소 경향만 보였을 뿐 유의하지 않았다. 따라서 MA군과 LA군의 혈압의 변화 값 사이 에는 유의한 차이를 나타냈다 (P < 0.05)(Table 4).
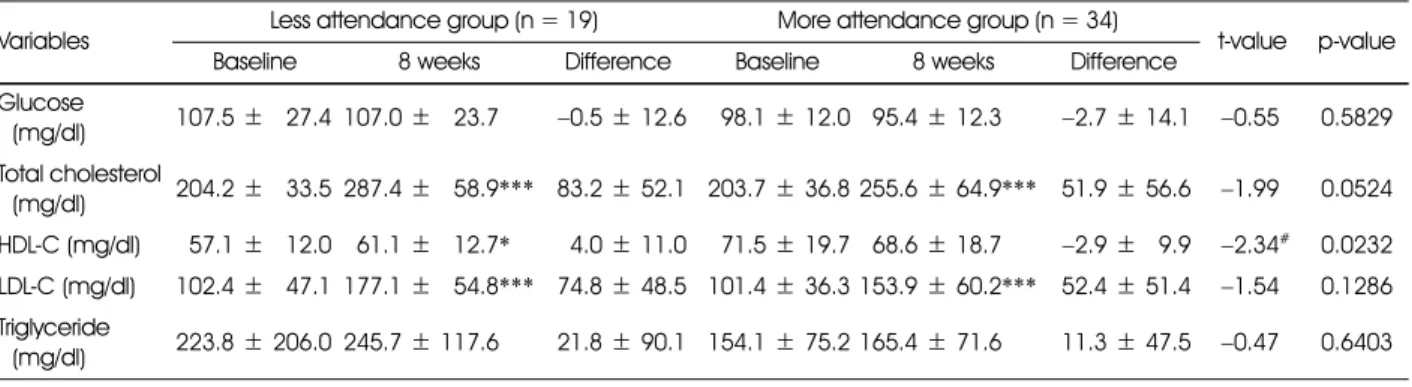
혈청콜레스테롤의 경우 MA군과 LA군 모두 교육 후 유의 하게 상승하였으나(P < 0.001) MA군은 상승 폭이 낮았다.
HDL-콜레스테롤의 경우 MA군은 교육 후 유의한 변화가 없었으나 LA군은 유의하게 상승하여 (P < 0.05) 두 군의
교육 후 변화 값 사이에 유의한 차이를 보였다(P <
0.05)(Table 5).
3. 영양교육 참여횟수에 따른 영양소 섭취량 및 음식섭취빈 도의 변화
MA군의 경우 영양교육 후 당질 섭취량이 259.3 g에서 234.3 g으로 유의하게 감소했으며(P < 0.05) 그밖에 철분 (P < 0.05), 아연(P < 0.05), 비타민B
6(P < 0.05), 나이아 신(P < 0.01) 등의 섭취량이 유의하게 감소했다. 그러나 LA 군의 경우 영양교육 후 영양소섭취량에 유의한 변화를 나타 내지 않았다.
단백질섭취량의 경우 MA군은 감소 경향을 보였고 LA군
Table 4. Changes of anthropometric characteristics during the nutrition education program between less attendance and more attendance groups
Variables Less attendance group (n = 19) More attendance group (n = 34)
t-value p-value Baseline 8 weeks Difference Baseline 8 weeks Difference
Height (cm) 158.07± 4.941) 156.56± 7.79 −0.86 0.3924
Weight (kg) 61.3±97.3 61.0±97.3 −0.49± 1.2 59.2±98.8658.7±68.7** −0.4 ±60.8 −0.19 0.8476 Soft lean mass (kg) 40.0±95.5 39.0±95.4 −0.04 ± 1.0 37.8±96.4638.1±66.3* 0.4±60.9 61.55 0.1263 Fat free mass (kg) 41.3±95.8 41.3±95.6 −0.01 ± 1.1 40.0±96.8640.4±66.6* 0.4±61.0 61.42 0.1611 Visceral fat area (cm2) 109.1± 16.4 108.1 ± 13.6 −1.09± 7.6 107.4 ± 27.2 103.1 ± 22.5 −4.3 ± 12.6 −1.20 0.2372 Skeletal muscle mass
(kg) 22.4±93.6 22.4±93.5 0.03± 0.6 24.6±94.0621.8±63.9* −2.8 ±60.6 61.30 0.1992 Body fat mass (kg) 20.0±93.5 19.7±93.6 −0.49± 1.3 19.2±95.2618.3±64.8*** −0.9 ±60.9 −1.62 0.1117 BMI (kg/m2) 24.5±91.9 24.2±91.9 −0.39± 0.5 24.1±92.5623.8±62.4*** −0.3 ±60.4 −0.60 0.5537 Percent body fat (%) 32.7±94.2 32.3±94.3 −0.49± 1.8 32.3±96.5631.0±66.1*** −1.2 ±61.4 −1.84 0.0719 SBP (mmHg) 130.6±99.7 128.4± 12.4 −2.39± 8.5 135.2 ± 15.7 125.9 ± 12.3*** −9.3 ± 12.0 −2.26# 0.0279 DBP (mmHg) 76.6±97.0 78.7±98.6 2.19± 7.1 79.0±99.8675.9±69.1* −3.1 ±68.2 −2.32# 0.0242 Pulse (bpm) 69.7± 10.9 71.6 ± 99.3 1.99± 8.4 73.7± 10.6670.5±69.9* −3.1 ±67.1 −2.32# 0.0244 1) Mean± SD
*: p < 0.05, **: p < 0.01, ***: p < 0.001 by paired t-test between baseline and 8 weeks within group
#: p < 0.05 by t-test between differences of less attendance and more attendance group
Table 5. Changes of biochemical characteristics during the nutrition education program between less attendance and more attendance groups
Variables Less attendance group (n = 19) More attendance group (n = 34)
t-value p-value
Baseline 8 weeks Difference Baseline 8 weeks Difference
Glucose
(mg/dl) 107.5±927.4 107.0±923.7 −0.5 ± 12.6 98.1± 12.0995.4± 12.3 −2.7 ± 14.1 −0.55 0.5829 Total cholesterol
(mg/dl) 204.2±933.5 287.4±958.9*** 83.2 ± 52.1 203.7 ± 36.8 255.6 ± 64.9*** 51.9 ± 56.6 −1.99 0.0524 HDL-C (mg/dl) 57.1±912.0961.1±912.7* 4.0± 11.0 71.5± 19.7968.6± 18.7 −2.9 ±99.9 −2.34# 0.0232 LDL-C (mg/dl) 102.4±947.1 177.1±954.8*** 74.8 ± 48.5 101.4 ± 36.3 153.9 ± 60.2*** 52.4 ± 51.4 −1.54 0.1286 Triglyceride
(mg/dl) 223.8± 206.0 245.7 ± 117.6 21.8± 90.1 154.1 ± 75.2 165.4 ± 71.6 11.3± 47.5 −0.47 0.6403 1) Mean± SD
*: p < 0.05, ***: p < 0.001 by paired t-test between baseline and 8 weeks within group
#: p < 0.05 by t-test between differences of less attendance and more attendance group
정 은 지·권 종 숙·안 소 현·손 숙 미 · 633
Table 6. Changes of nutrients intakes during the nutrition education program between less attendance and more attendance groupsVariables Less attendance group (n = 19) More attendance group (n = 34)
t-value p-value
Baseline 8 weeks Difference Baseline 8 weeks Difference
Energy (kcal) 1,590.5±1,292.61) 1,535.9±1,365.2** 19,−54.6 ±1,419.6 1,618.0±1,477.0 1,443.7±1,314.9*** 1,−174.3 ±1,471.6 −0.89 0.3770
(988.4)2) (984.6) (990.3) (979.7)
Protein (g) 19,58.5±19,14.71) 19,68.5±19,23.1** 1−9,10.0±19,26.7 19,64.7±19,22.6 19,57.9±19,15.4*** 1,22−6.8 ±19,24.4 −2.23# 0.0310
(127.6)1) (148.2) (141.7) (126.9)
Fat (g) 19,31.9±19,11.21) 19,38.4±19,14.9** 1,−226.5±19,17.9 19,37.3±19,22.0 19,31.8±19,11.9*** 1,22−5.4 ±19,25.4 −1.77 0.0836 Saturated f.a (g) 1,224.5±1,223.71) 1,226.3±1,224.7** 1,−221.8±1,226.1 1,225.4±1,224.1 1,225.4±1,223.6*** 1,22−0.0 ±1,225.6 −1.05 0.2982 Monounsaturated f.a (g) 1,226.0±1,226.31) 1,226.8±1,225.2** 1−,220.9±1,229.3 1,227.2±1,225.2 1,226.7±1,223.7*** 1,22−0.5 ±1,226.8 −0.59 0.5555 Polyunsaturated f.a (g) 1,225.2±1,224.31) 1,226.1±1,223.6** 1−,221.0±1,225.9 1,226.1±1,223.8 1,227.0±1,223.4*** 1,−221.0±1,225.9 −0.08 0.9380 Carbohydrate (g) 1,263.0±19,56.81) 1,233.3±19,61.2** 1,2−29.6 ±1,102.1 1,259.3±19,65.2 1,234.3±19,53.4*** 19,−25.0 ±19,61.1 0.18 0.8617 Fiber (g) 19,21.5±1,227.11) 19,23.2±19,10.4** −1,221.7±19,11.8 19,22.9±1,226.0 19,24.5±1,227.3*** −1,221.6±1,228.5 −0.03 0.9789 Calcium (mg) 1,560.1±1,300.81) 1,581.8±1,262.2** 1−9,21.7±1,323.1 1,535.1±1,202.5 1,546.2±1,187.8*** 1−9,11.1±1,236.7 −0.13 0.8960
(972.3)1) (976.0) (968.4) (969.6)
Phosphorus (mg) 1,914.2±1,273.81) 1,018.4±1,330.3** −1,104.2±1,414.1 1,977.7±1,286.5 1,918.9±1,226.8*** 19,−58.8 ±1,359.7 −1.43 0.1586
(130.6)1) (145.5) (139.7) (131.3)
Iron (mg) 19,12.7±1,223.51) 19,13.2±1,225.1** 1−,220.5±1,226.4 19,14.3±1,224.9 19,12.5±1,224.3*** 1,22−1.8 ±1,224.6 −1.44 0.1559
(136.1)1) (140.3) (155.2) (135.5)
K (mg) 2,861.8± 1,145.01) 2,968.5± 1,062.5** −1,106.7± 1,418.1 3,009.4 ±1,825.7 2,810.6±1,670.3*** 1,−198.8 ±1,825.2 −0.85 0.4048 Zinc (mg) 1,227.1±1,221.81) 1,228.1±1,222.3** −1,221.0±1,222.8 1,229.6±1,225.7 1,227.2±1,221.8*** 1,22−2.3 ±1,225.3 −2.82## 0.0073
(989.9)1) (101.5) (121.6) (992.3)
Vitamin A (R.E) 1,992.0±1,673.81) 1,837.9±1,593.8** 1,−154.1 ±1,701.0 1,966.3±1,593.2 1,823.0±1,399.4*** 1,−133.4 ±1,651.0 −0.10 0.9178
(161.3)1) (133.0) (158.9) (135.9)
Retinol (µg) 19,62.8±19,64.71) 19,97.4±19,96.6** −19,34.6±1,120.7 19,88.1±1,143.2 76.2±19,56.1*** 19,−11.8 ±1,153.3 −1.11 0.2740 Carotene (µg) 5,440.2± 3,880.01) 4,049.6±1,295.7** −1,390.6 ± 3,647.8 4,913.8 ± 3,419.5 4,210.1 ± 2,146.8*** 1,−709.7 ± 3162.3 −0.69 0.4958 Vitamin B1 (mg) 1,221.1±1,220.51) 1,221.1±1,220.5** −1,220.1±1,220.6 1,221.2±1,220.4 1,221.0±1,220.4*** 1,22−0.2 ±1,220.4 −1.29 0.2041
(995.9)1) (999.5) (103.9) (990.4)
Vitamin B2 (mg) 1,221.0±1,220.51) 1,221.1±1,220.4** 1−,220.1±1,220.6 1,221.1±1,220.5 1,221.0±1,220.4*** 1,22−0.1 ±1,220.4 −2.12# 0.0394
(977.7)1) (989.5) (990.7) (980.5)
Vitamin B6 (mg) 1,222.0±1,220.71) 1,221.9±1,220.8** 1,22−0.1 ±1,221.0 1,222.0±1,220.8 1,221.7±1,220.5*** 1,22−0.3 ±1,220.7 −0.76 0.4497
(141.3)1) (132.0) (142.6) (120.3)
Niacin (mg) 1,912.2±1,223.81) 19,13.7±1,224.5** −1,221.6±1,225.9 19,16.1±1,226.2 19,11.7± 3.6*** 1,22−4.4 ±1,226.4 −3.25## 0.0022
(985.2)1) (994.7) (113.0) (982.23)
Vitamin C (mg) 1,108.2±19,60.01) 1,101.1±1,271.6** 1,22−7.1 ±19,82.7 1,112.0±19,52.5 1,115.4±19,58.3*** 1−,223.5±19,61.2 −0.50 0.6165
(108.2)1) (101.1) (112.0) (115.4)
Folic acid (µg) 1,293.5±1,129.61) 1,269.9±19,96.7** 1,−23.65 ±1,141.3 1,328.0±1,107.5 1,283.9±19,74.5*** 19,−44.1 ±1,125.3 −0.52 0.6042 Cholesterol (mg) 1,142.7±19,74.81) 1,218.5±1,157.5** −19,75.8±1,184.3 1,190.1±1,224.3 1,168.6±1,137.1*** 19,−21.5 ±1,272.7 −1.36 0.1817 Recalled Na (mg) 3,988.8± 1,974.11) 3,544.5± 1,294.2** 1,−444.4 ± 2,045.9 3,713.9 ± 1,562.1 2,132.1 ± 1,152.0*** −1,581.8 ± 1,823.5 −6.29# 0.0159 DFQ Na (mg) 5,066.6± 1,904.61) 4,077.6± 2,056.8** 1,−988.9 ± 2,839.9 6,329.1 ± 4,160.0 3,633.9 ± 1,801.5*** −2,695.2 ± 3,955.8 −1.65 0.1043 Protein energy % 19,14.7±1,222.51) 1,917.7±1,223.2** −1,222.9±1,224.0 19,15.9±1,222.7 19,16.1±1,222.7*** 1,−220.1±1,223.9 −2.39# 0.0213 Fat energy % 19,17.9±1,225.51) 19,22.5±1,227.6** −1,224.5±19,10.1 19,19.9±1,227.1 19,19.6±1,225.6*** 1,22−0.2 ±1,229.2 −1.07 0.1010 Carbohydrate energy % 19,67.3±1,212.21) 19,60.9±1,228.9** 1,22−6.4 ±19,16.8 19,65.3±1,228.9 19,65.1±1,227.5*** 1,22−0.2 ±19,11.5 −1.50 0.1398 1) Mean± SD
2) Mean % of RNI(Recommended Nutrient Intake for Dietary Reference Intake for Koreans)
*: p < 0.05, **: p < 0.01, ***: p < 0.001 by paired t-test between baseline and 8 weeks within group
#: p < 0.05, ##: p < 0.01 by t-test between differences of less attendance and more attendance group
634 · 경계성 고혈 압환자 의 저 염식생 활 영 양교육 참여 정도 에 따른 혈압 , 나트 륨 섭취
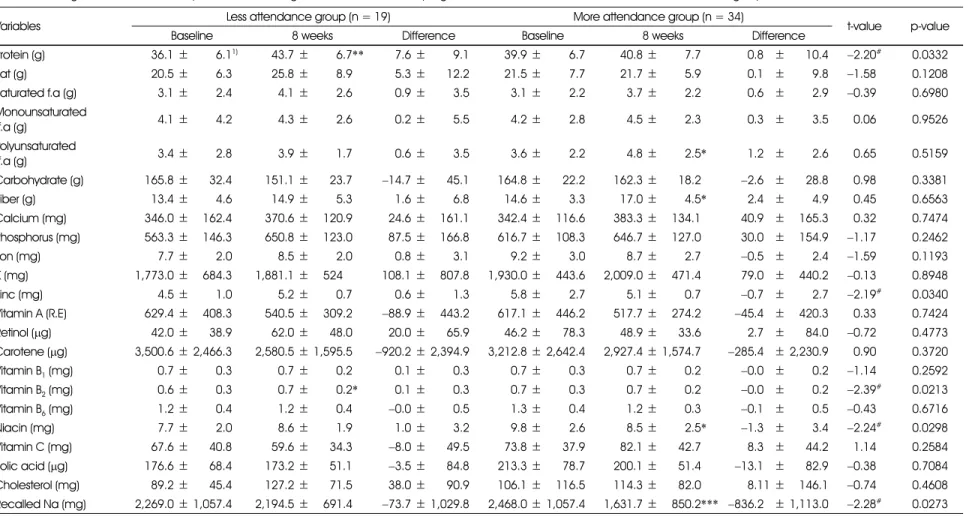
Table 7. Changes of Nutrients intakes per 1000kcal during the nutrition education program between less attendance and more attendance groups
Variables Less attendance group (n = 19) More attendance group (n = 34)
t-value p-value
Baseline 8 weeks Difference Baseline 8 weeks Difference
Protein (g) 36,36.1±369,6.11) 36,43.7±369,6.7** −997.6±369,9.1 36,39.9±369,6.7 36,40.8±369,7.7 −990.89±19,10.4 −2.20# 0.0332 Fat (g) 36,20.5±369,6.3 36,25.8±369,8.9 99−5.3±36,12.2 36,21.5±369,7.7 36,21.7±369,5.9 −990.19±199,9.8 −1.58 0.1208 Saturated f.a (g) 369,3.1±369,2.4 369,4.1±369,2.6 99−0.9±369,3.5 369,3.1±369,2.2 369,3.7±369,2.2 99−0.69±199,2.9 −0.39 0.6980 Monounsaturated
f.a (g) 369,4.1±369,4.2 369,4.3±369,2.6 99−0.2±369,5.5 369,4.2±369,2.8 369,4.5±369,2.3 99−0.39±199,3.5 −0.06 0.9526 Polyunsaturated
f.a (g) 369,3.4±369,2.8 369,3.9±369,1.7 99−0.6±369,3.5 369,3.6±369,2.2 369,4.8±369,2.5* 99−1.29±199,2.6 −0.65 0.5159 Carbohydrate (g) 3,165.8±36,32.4 3,151.1±36,23.7 9−14.7 ±36,45.1 3,164.8±36,22.2 3,162.3±36,18.2 99−2.69±19,28.8 −0.98 0.3381 Fiber (g) 36,13.4±369,4.6 36,14.9±369,5.3 −991.6±369,6.8 36,14.6±369,3.3 36,17.0±369,4.5* −992.49±199,4.9 −0.45 0.6563 Calcium (mg) 3,346.0±3,162.4 3,370.6±1,120.9 9−24.6±3,161.1 3,342.4±3,116.6 3,383.3±1,134.1 −940.99±1,165.3 −0.32 0.7474 Phosphorus (mg) 3,563.3±3,146.3 3,650.8±1,123.0 9−87.5±3,166.8 3,616.7±3,108.3 3,646.7±1,127.0 9−30.09±1,154.9 −1.17 0.2462 Iron (mg) 369,7.7±369,2.0 369,8.5±369,2.0 −990.8±369,3.1 369,9.2±369,3.0 369,8.7±369,2.7 99−0.59±199,2.4 −1.59 0.1193 K (mg) 1,773.0±3,684.3 1,881.1±1,524 −108.1±3,807.8 1,930.0±3,443.6 2,009.0±1,471.4 −979.09±1,440.2 −0.13 0.8948 Zinc (mg) 369,4.5±369,1.0 369,5.2±369,0.7 99−0.6±369,1.3 369,5.8±369,2.7 369,5.1±369,0.7 99−0.79±199,2.7 −2.19# 0.0340 Vitamin A (R.E) 3,629.4±1,408.3 3,540.5±1,309.2 9−88.9 ±3,443.2 3,617.1±3,446.2 3,517.7±1,274.2 9−45.49±1,420.3 −0.33 0.7424 Retinol (µg) 36,42.0±36,38.9 36,62.0±36,48.0 9−20.0±36,65.9 36,46.2±36,78.3 36,48.9±36,33.6 −992.79±19,84.0 −0.72 0.4773 Carotene (µg) 3,500.6± 2,466.3 2,580.5± 1,595.5 −920.2 ± 2,394.9 3,212.8± 2,642.4 2,927.4± 1,574.7 −285.49± 2,230.9 −0.90 0.3720 Vitamin B1 (mg) 369,0.7±369,0.3 369,0.7±369,0.2 99−0.1±369,0.3 369,0.7±369,0.3 369,0.7±369,0.2 99−0.09±199,0.2 −1.14 0.2592 Vitamin B2 (mg) 369,0.6±369,0.3 369,0.7±369,0.2* 99−0.1±369,0.3 369,0.7±369,0.3 369,0.7±369,0.2 99−0.09±199,0.2 −2.39# 0.0213 Vitamin B6 (mg) 369,1.2±369,0.4 369,1.2±369,0.4 99−0.0 ±369,0.5 369,1.3±369,0.4 369,1.2±369,0.3 99−0.19±199,0.5 −0.43 0.6716 Niacin (mg) 369,7.7±369,2.0 369,8.6±369,1.9 99−1.0±369,3.2 369,9.8±369,2.6 369,8.5±369,2.5* 99−1.39±199,3.4 −2.24# 0.0298 Vitamin C (mg) 36,67.6±36,40.8 36,59.6±36,34.3 99−8.0 ±36,49.5 36,73.8±36,37.9 36,82.1±36,42.7 99−8.39±19,44.2 −1.14 0.2584 Folic acid (µg) 3,176.6±36,68.4 3,173.2±36,51.1 99−3.5 ±36,84.8 3,213.3±36,78.7 3,200.1±36,51.4 9−13.19±19,82.9 −0.38 0.7084 Cholesterol (mg) 36,89.2±36,45.4 3,127.2±36,71.5 9−38.0±36,90.9 3,106.1±1,116.5 3,114.3±36,82.0 99−8.11±1,146.1 −0.74 0.4608 Recalled Na (mg) 2,269.0± 1,057.4 2,194.5±1,691.4 9−73.7 ± 1,029.8 2,468.0± 1,057.4 1,631.7±1,850.2*** −836.29± 1,113.0 −2.28# 0.0273 1) Mean± SD
*: p < 0.05, **: p < 0.01, ***: p < 0.001 by paired t-test between baseline and 8 weeks within group
#: p < 0.05 by t-test between differences of less attendance and more attendance group
정은진·권종숙·안소현·손숙미·635
은 증가경향을 보여 두 군의 단백질섭취량의 변화 값 간에는 유의한 차이가 있었으며(P < 0.05), 단백질에너지비의 경 우 LA군은 유의하게 증가한 반면(P < 0.01) MA군은 변화 가 없어 두 군의 교육 후 단백질 에너지비의 변화 값 사이에 도 유의한 차이가 있었다(P < 0.05)(Table 6)
1000 kcal당 영양소섭취량의 경우에는 MA군이 영양교 육후에 불포화지방산과 섬유소섭취량이 유의하게 증가하였 고(각각 P < 0.05) 나이아신(P < 0.05)과 24시간 회상법 에 의해 구한 나트륨섭취량이 유의하게 감소하였으나 LA군 은 이러한 변화가 관찰되지 않았으며 1000kcal당 단백질섭 취량이 유의하게 증가하였다(Table 7).
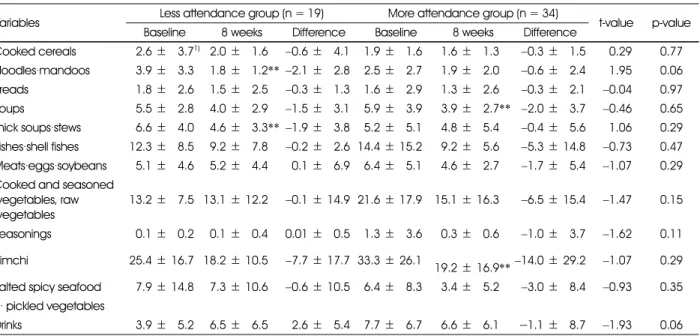
MA군의 경우 24시간 회상법에 의해 구한 나트륨 섭취량 이 교육전 3713.8 mg에서 교육 후 2132.1 mg으로 유의 하게 감소했으며(P < 0.001), 음식섭취빈도지로 구한 나트 륨 섭취량도 교육전 6329.1 mg에서 교육후 3633.9 mg으 로 대폭 감소했다(P < 0.01), 그렇지만 이러한 변화가 LA 군의 경우 발견되지 않았다. MA군의 경우 영양교육 후에 국 류(P < 0.01), 김치류의 섭취빈도가 유의하게 감소했으며 (P < 0.01), LA군의 경우 면류(P < 0.01), 찌개, 탕류의 섭 취횟수가 유의하게 감소했다(P < 0.05)(Table 8).
4. 영양교육 참여횟수에 따른 영양지식 식행동, 식태도 점 수의 변화
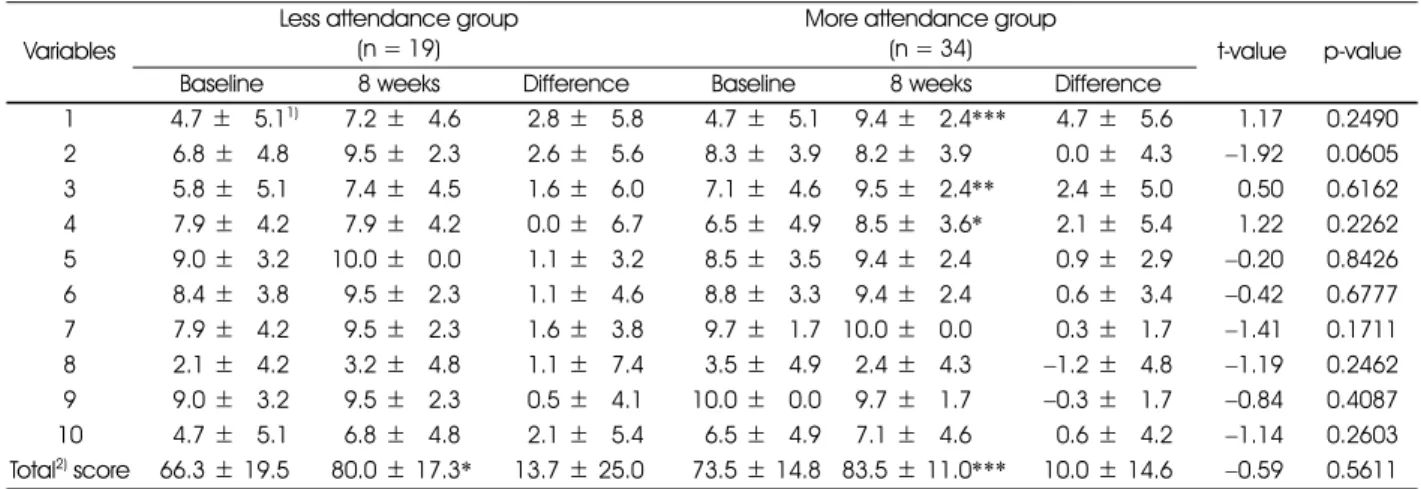
MA군과 LA군 모두에서 영양지식 총점이 교육 후에 유의
하게 증가했으나(각 P < 0.001, P < 0.05) 증가폭은 MA 군이 높았으며 각 문항별 영양지식에서는 변화에 차이를 나 타냈다. 즉 MA군의 경우 ‘나트륨에 대한 정보는 많은 가공 식품의 영양표시제에서 알 수 있다’(P < 0.001), ‘나트륨을 줄이기 위해 소금대신 식초, 겨자, 소스와 같은 향미식품을 이용 한다’(P < 0.01), ‘소금대용품은 나트륨섭취량을 줄일 수 있는 좋은 방법이다’(P < 0.05) 등의 영양지식 점수가 유 의하게 증가했으나 LA군은 각 항목의 영양지식 점수에서는 증가경향만 보였을 뿐 통계적으로 유의한 변화를 보이지 않 았다(Table 9).
소금섭취와 관련된 식행동의 경우 MA군(P < 0.001)과 LA군(P < 0.01) 모두 총 점수가 유의하게 낮아져서 소금의 과잉섭취를 유발하는 식행동이 개선된 것을 보여주었다. 각 항목에 있어서는 ‘국이나 찌개, 국수종류의 국물을 남김없이 먹는 다’(P < 0.05), ‘채소 요리 시 식초보다 간장을 주로 이 용 한다’(P < 0.05) 에서 MA군과 LA군 모두 식행동 점수 가 개선되었다(Table 10). 그밖에도 MA군의 경우 ‘김치류 나 장아찌류를 많이 먹는 편이다’에서 영양교육 후 유의하게 식행동 점수가 개선된 반면 (P < 0.001) LA군에서는 ‘반 찬은 간이 제대로 되어야(약간 짜야)한다고 생각 한다’ 에서 식행동 점수가 개선되었다(P < 0.01), ‘오징어 같은 건어물 이나 생선자반 같은 것을 좋아한다’는 항목에 대해서는 MA 군은 교육 후 개선되는 경향을 보였으나 LA군은 오히려 나 빠지는 경향을 보여 두 군의 변화 값 간에 유의한 차이가 있
Table 8. Changes of dish consumption frequencies during the nutrition education program for less attendance and more attendance groups
Variables Less attendance group (n = 19) More attendance group (n = 34)
t-value p-value Baseline 8 weeks Difference Baseline 8 weeks Difference
Cooked cereals 92.6±93.71)92.0±91.6 −0.6 ±94.1 91.9±91.6 91.6±91.3 −0.3 ±91.5 0.29 0.77 Noodles·mandoos 93.9±93.3 91.8±91.2**−2.1 ±92.8 92.5±92.7 91.9±92.0 −0.6 ±92.4 1.95 0.06 Breads 91.8±92.6 91.5±92.5 −0.3 ±91.3 91.6±92.9 91.3±92.6 −0.3 ±92.1 −0.04 0.97 Soups 95.5±92.8 94.0±92.9 −1.5 ±93.1 95.9±93.9 93.9±92.7** −2.0 ±93.7 −0.46 0.65 Thick soups·stews 96.6±94.0 94.6±93.3**−1.9 ±93.8 95.2±95.1 94.8±95.4 −0.4 ±95.6 1.06 0.29 Fishes·shell fishes 12.3±98.5 99.2±97.8 −0.2 ±92.6 14.4± 15.2 99.2±95.6 −5.3 ± 14.8 −0.73 0.47 Meats·eggs·soybeans 95.1±94.6 95.2±94.4 0.1±96.9 96.4±95.1 94.6±92.7 −1.7 ±95.4 −1.07 0.29 Cooked and seasoned
vegetables, raw vegetables
13.2±97.5 13.1± 12.2 −0.1 ± 14.9 21.6 ± 17.9 15.1 ± 16.3 −6.5 ± 15.4 −1.47 0.15
Seasonings 90.1±90.2 90.1±90.4 0.01±90.5 91.3±93.6 90.3±90.6 −1.0 ±93.7 −1.62 0.11 Kimchi 25.4± 16.7 18.2 ± 10.5 −7.7 ± 17.7 33.3 ± 26.1 19.2± 16.9** −14.0± 29.2 −1.07 0.29 Salted spicy seafood 97.9± 14.8 97.3± 10.6 −0.6 ± 10.5 96.4±98.3 93.4±95.2 −3.0 ±98.4 −0.93 0.35 · pickled vegetables
Drinks 93.9±95.2 96.5±96.5 2.6±95.4 97.7±96.7 96.6±96.1
−
1.1±98.7 −1.93 0.06 1) Mean± SD**: p < 0.01 by paired t-test between baseline and 8 weeks within group
636·경계성 고혈압환자의 저염식생활 영양교육 참여 정도에 따른 혈압, 나트륨 섭취
Table 9. Changes of nutrition knowledge related to hypertension or sodium intakes between less attendance and more attendance groups
Variables
Less attendance group (n = 19)
More attendance group
(n = 34) t-value p-value
Baseline 8 weeks Difference Baseline 8 weeks Difference
1 4.7±95.11) 97.2±94.6 2.8±95.8 4.7±95.1 99.4±92.4*** 4.7±95.6 1.17 0.2490 2 6.8±94.8 99.5±92.3 2.6±95.6 8.3±93.9 98.2±93.9 0.0±94.3 −1.92 0.0605 3 5.8±95.1 97.4±94.5 1.6±96.0 7.1±94.6 99.5±92.4** 2.4±95.0 0.50 0.6162 4 7.9±94.2 97.9±94.2 0.0±96.7 6.5±94.9 98.5±93.6* 2.1±95.4 1.22 0.2262 5 9.0±93.2 10.0±90.0 1.1±93.2 8.5±93.5 99.4±92.4 0.9±92.9 −0.20 0.8426 6 8.4±93.8 99.5±92.3 1.1±94.6 8.8±93.3 99.4±92.4 0.6±93.4 −0.42 0.6777 7 7.9±94.2 99.5±92.3 1.6±93.8 9.7±91.7 10.0±90.0 0.3±91.7 −1.41 0.1711 8 2.1±94.2 93.2±94.8 1.1±97.4 3.5±94.9 92.4±94.3 −1.2 ±94.8 −1.19 0.2462 9 9.0±93.2 99.5±92.3 0.5±94.1 10.0±90.0 99.7±91.7 −0.3 ±91.7 −0.84 0.4087 10 4.7±95.1 96.8±94.8 2.1±95.4 6.5±94.9 97.1±94.6 0.6±94.2 −1.14 0.2603 Total2) score 66.3± 19.5 80.0± 17.3* 13.7± 25.0 73.5± 14.8 83.5 ± 11.0*** 10.0± 14.6 −0.59 0.5611 1) Mean± SD
2) Summated score of each item. Full score = 100, the correct answer for each question was scored 10, incorrect answer 0
*: p < 0.05, **: p < 0.01, ***: p < 0.001 by paired t-test between baseline and 8 weeks within group 1. Nutrition labeling shows sodium contents of processed food
2. Canned foods and instant foods contain lots of sodium
3. Using spices such as vinegar, mustard or soybean sauce instead of salt can reduce sodium intake 4. Salt substitute is a good way to reduce sodium intake
5. Increased risk of hypertension is associated with high level of serum triglycerides
6. Having family history of hypertension can elevate incidence of hypertension to descendent 7. Lowering body weight can reduce blood pressure
8. All the elderly has high blood pressure 9. Stress can lead to elevate blood pressure
10. Pregnancy can lead to elevated blood pressure in females
Table 10. Changes of dietary behavior related to sodium intakes during the nutrition education program between less attendance and more attendance groups
Variables
Less attendance group (n = 19)
More attendance group
(n = 34) t-value p-value
Baseline 8 weeks Difference Baseline 8 weeks Difference
1 94.2±95.1 95.8±95.1 1.6±95.0 2.79±94.5 91.5±93.6 −1.2 ±94.8 11.26## 0.0015 2 92.6±94.5 92.1±94.2 −0.5 ±95.2 0.59±92.4 90.9±92.9 0.3±93.0 90.63 0.5363 3 93.2±94.8 94.2±95.1 1.1±96.6 3.89±94.9 92.7±94.5 −1.2 ±95.9 −1.26 0.2118 4 93.7±95.0 91.6±93.8* −2.1 ±94.2 3.29±94.8 91.2±93.3* −2.1 ±94.8 90.04 0.9719 5 90.5±92.3 90.0±90.0 −0.5 ±92.3 2.19±94.1 90.9±92.9 −1.2 ±94.1 −0.74 0.4621 6 93.2±94.8 92.1±94.2 −1.05 ±94.6 3.29±94.8 92.4±94.3 −0.9 ±93.8 90.15 0.8850 7 96.8±94.8 93.7±95.0 −3.2 ±96.7 5.69±95.0 92.4±94.3*** −3.2 ±94.8 −0.05 0.9612 8 92.2±94.2 90.5±92.3 −1.6 ±93.8 2.19±94.1 90.6±92.4 −1.5 ±94.4 90.09 0.9278 9 95.8±95.1 92.6±94.5** −3.2 ±94.8 2.79±94.5 91.2±93.3 −1.5 ±94.4 91.31 0.1973 10 97.4±94.5 94.2±95.1* −3.2 ±95.8 6.59±94.9 94.1±95.0* −2.4 ±96.5 90.46 0.6573 Total2)
score 39.5± 18.7 26.8± 13.8** −12.6 ± 18.8 32.49± 21.1 17.7 ± 15.8*** −14.7 ± 19.7 −0.37 0.7106 1) Mean± SD
2) Summated score of each item. Total score = 100, ‘yes' answer for each item was scored 10, 'no' answer 0
*: p < 0.05, **: p < 0.01, ***: p < 0.001 by paired t-test between baseline and 8 weeks within group
##: p < 0.01 by t-test between differences of less attendance and more attendance group 1. Enjoy dried seafood or seasoned fish
2. Enjoy salted fish such as salted spicy pollack roe
3. Enjoy cooked rice topped with seasoned meats/seafood or one-dish meal 4. Usually eat all the broth of soup or stew
5. Enjoy instant foods such as ramyon, canned food, or ham.
6. Eating-out or taking delivery dishes more than twice a week 7. Enjoy Kimchi and pickled vegetables
8. Adding lots of soy-sauce or vinegar-hot pepper paste to fried foods, pan-fried foods or sashimi 9. Enjoy salty taste and thinking that salty taste is important one
10. Usually us soy-sauce rather than vinegar when cooking vegetables
정은진·권종숙·안소현·손숙미·637
었다(P < 0.05)(Table 10).
영양교육 후 일반적인 식습관의 변화를 보면 MA군의 경 우 식습관 총점이 유의하게 증가하였고(P < 0.001) 각 항 목에서는 ‘콩 제품(두부, 두유 등)을 매일 먹는다’(P < 0.05),
‘채소반찬(김치제외)을 매끼 먹는다’(P < 0.05) ‘우유 또는 유제품을 매일 마신다’(P < 0.001) 에서 교육 후 유의하게 상승된 점수를 보여 개선된 것을 알 수 있었다(Table 11).
반면에 LA군은 ‘과일을 먹는다’ 에서 교육 후 유의하게 식 습관 점수가 증가했으나(P < 0.05) 총점과 다른 항목에서 는 유의한 변화를 보이지 않았다.
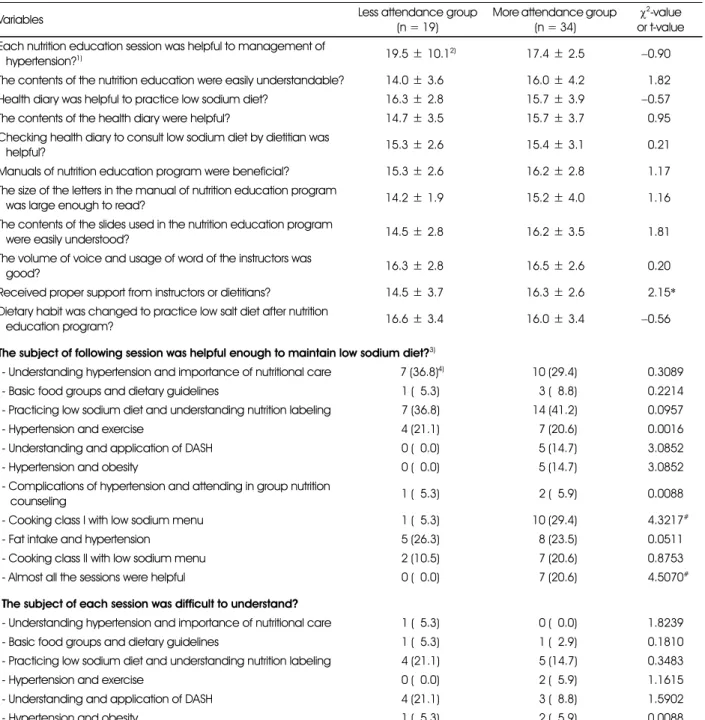
5. 영양교육 참여횟수에 따른 영양교육프로그램 평가
MA군의 경우 '강사나 영양사로부터 적절한 도움을 받았 는지' 물어보는 문항에서 16.3점을 받아 ‘그렇다’와 ‘매우 그 렇다’사이에 있었으며 LA군에 비해 유의하게 높은 점수를 보였다(P < 0.05). 각 세션이 저염식생활 유지에 충분히 도 움이 되었는지 물어보는 설문항목에 대해서 MA군은 29.4%
가 저염메뉴 조리실습시간이 도움이 되었다고 답하여 LA군 의 5.3%에 비해 유의하게 높았으며 거의 모든 주제가 도움 이 되었다고 답한 경우도 MA군이 20.6%로 LA군의 0%에 비해 유의하게 높았다(P < 0.05)(Table 12).
Table 11. Changes of general dietary habits during the nutrition education program between less attendance and more attendance groups
Variables Less attendance group (n = 19) More attendance group (n = 34)
t-value p-value Baseline 8 weeks Difference Baseline 8 weeks Difference
1 93.6± 1.91) 994.0± 1.7 0.4± 1.3 4.6± 0.9 94.8± 0.7 0.2± 0.9 −0.85 0.3983 2 93.6± 2.1 993.8± 1.9 0.3± 1.8 4.4± 1.4 94.7± 1.1 0.3± 1.5 90.07 0.9469 3 94.7± 0.8 994.7± 0.8 0.0± 0.8 4.8± 0.7 94.8± 1.0 0.0± 0.9 90.00 1.0000 4 91.8± 2.0 992.4± 1.8 0.5± 1.8 2.8± 2.4 93.1± 2.0 0.3± 2.2 −0.39 0.6958 5 92.4± 2.4 992.6± 2.0 0.3± 2.5 2.9± 2.1 92.5± 2.2 −0.4 ± 2.2 −0.95 0.3477 Total score2) 16.1± 4.7 917.5± 4.6 1.5± 4.2 19.5± 4.1 19.9± 3.5 0.4± 3.5 −1.00 0.3198 6 94.1± 1.7 994.1± 1.5 0.0± 2.6 4.6± 1.0 94.6± 0.9 0.1± 1.4 90.11 0.9113 7 91.8± 1.6 991.7± 1.5 −0.1 ± 1.7 1.7± 1.8 91.7± 1.7 0.0± 1.8 90.26 0.7938 8 92.9± 1.5 992.4± 1.6 −0.5 ± 1.6 2.6± 1.7 92.6± 1.4 0.0± 1.4 91.27 0.2108 9 93.6± 1.3 992.9± 1.9 −0.7 ± 1.4 3.8± 1.4 94.3± 1.3* 0.5± 1.2 93.21## 0.0023 10 94.2± 1.2 994.1± 1.7 −0.1 ± 1.3 4.1± 1.6 94.6± 1.2* 0.4± 1.2 91.66 0.1037 11 91.1± 1.3 991.6± 1.2 0.5± 1.3 1.5± 1.5 91.8± 1.7 0.4± 1.8 −0.34 0.7338 12 92.2± 1.8 993.0± 1.6 0.8± 1.7 2.4± 2.3 94.0± 1.6*** 1.5± 2.2 91.29 0.2035 13 94.1± 1.2 994.6± 0.9* 0.5± 1.1 4.2± 1.2 94.3± 1.3 0.1± 1.3 −1.30 0.2006 14 93.4± 1.7 993.6± 1.3 0.1± 1.3 3.2± 1.9 93.6± 1.7 0.4± 1.9 90.49 0.6272 Total score3) 27.4± 5.7 927.9± 6.5 0.5± 5.3 28.0± 6.4 31.4± 6.4*** 3.4± 5.3 94.66# 0.0356 1) Mean± SD
2) Summated score of each item. Full score of general dietary habits = 25 3) Summated score of each item. Full score of well-balanced dietary habits = 45
'yes' answer for each item (except 4 and 5) was scored 5, 'no' answer 0 'no' answer for each item 4 and 5 was scored 5, 'yes' answer 0
*: p < 0.05, ** : p < 0.01, *** : p < 0.001 by paired t-test between baseline and 8 weeks within group
#: p < 0.05, ##: p < 0.01 by t-test between differences of less attendance and more attendance group 1. Having 3 meals a day without missing any meal
2. Having breakfast everyday 3. Having enough time when eating 4. Having meals often after 10 PM.
5. Eating until feeling full.
6. Having cereals such as rice, breads, noodles, potatoes every meal.
7. Having meats or eggs more than once a day.
8. Having fishes more than once a day
9. Having soybean products such as tofu or soymilk everyday 10. Having vegetable dishes (except kimchi) everyday 11. Having dishes cooked with oils every meal 12. Having milk or dairy products everyday 13. Having fruits everyday
14. Trying to have various foods in a day
638·경계성 고혈압환자의 저염식생활 영양교육 참여 정도에 따른 혈압, 나트륨 섭취
—————————————————————————
고 찰
—————————————————————————
우리나라 30세 이상 성인의 고혈압 유병율은 2008년 26.9%에서 2009년 30.3%, 2010년 28.9%로 증가추세
에 있어(MOHW/KCDC 2011) 보건소를 통한 고혈압의 예 방 및 관리가 한층 더 중요한 시점이다. 보건소에서 영양교 육을 실시할 때 몇 주에 걸쳐 몇 회로 할 것인지는 대상자들 의 나이, 생활환경, 임상결과가 나타나기까지 소요되는 일자 등 여러 가지요인에 의해 좌우된다. 교육기간을 너무 짧게 하
Table 12. Evaluation for the nutrition education program between less attendance and more attendance groups
Variables Less attendance group
(n = 19)
More attendance group (n = 34)
χ2-value or t-value Each nutrition education session was helpful to management of
hypertension?1) 19.5± 10.12) 17.4± 2.5 −0.90
The contents of the nutrition education were easily understandable? 14.0± 3.6 16.0± 4.2 −1.82 Health diary was helpful to practice low sodium diet? 16.3± 2.8 15.7± 3.9 −0.57
The contents of the health diary were helpful? 14.7± 3.5 15.7± 3.7 −0.95
Checking health diary to consult low sodium diet by dietitian was
helpful? 15.3± 2.6 15.4± 3.1 −0.21
Manuals of nutrition education program were beneficial? 15.3± 2.6 16.2± 2.8 −1.17 The size of the letters in the manual of nutrition education program
was large enough to read? 14.2± 1.9 15.2± 4.0 −1.16
The contents of the slides used in the nutrition education program
were easily understood? 14.5± 2.8 16.2± 3.5 −1.81
The volume of voice and usage of word of the instructors was
good? 16.3± 2.8 16.5± 2.6 −0.20
Received proper support from instructors or dietitians? 14.5± 3.7 16.3± 2.6 −2.15*
Dietary habit was changed to practice low salt diet after nutrition
education program? 16.6± 3.4 16.0± 3.4 −0.56
The subject of following session was helpful enough to maintain low sodium diet?3)
- Understanding hypertension and importance of nutritional care 7 (36.8)4) 10 (29.4) −0.3089
- Basic food groups and dietary guidelines 1 (−5.3) 3 (−8.8) −0.2214
- Practicing low sodium diet and understanding nutrition labeling 7 (36.8) 14 (41.2) −0.0957
- Hypertension and exercise 4 (21.1) 7 (20.6) −0.0016
- Understanding and application of DASH 0 (−0.0) 5 (14.7) −3.0852
- Hypertension and obesity 0 (−0.0) 5 (14.7) −3.0852
- Complications of hypertension and attending in group nutrition
counseling 1 (−5.3) 2 (−5.9) −0.0088
- Cooking class I with low sodium menu 1 (−5.3) 10 (29.4) −4.3217#
- Fat intake and hypertension 5 (26.3) 8 (23.5) −0.0511
- Cooking class II with low sodium menu 2 (10.5) 7 (20.6) −0.8753
- Almost all the sessions were helpful 0 (−0.0) 7 (20.6) −4.5070#
The subject of each session was difficult to understand?
- Understanding hypertension and importance of nutritional care 1 (−5.3) 0 (−0.0) −1.8239
- Basic food groups and dietary guidelines 1 (−5.3) 1 (−2.9) −0.1810
- Practicing low sodium diet and understanding nutrition labeling 4 (21.1) 5 (14.7) −0.3483
- Hypertension and exercise 0 (−0.0) 2 (−5.9) −1.1615
- Understanding and application of DASH 4 (21.1) 3 (−8.8) −1.5902
- Hypertension and obesity 1 (−5.3) 2 (−5.9) −0.0088
1) Strongly disagree: 0, moderately disagree: 5, neutral: 10. moderately agree: 15, strongly agree: 20 2) Mean± SD
3) Numbers of the subjects who responded 'yes' 4) N (%)
*: p < 0.05 by t-test between groups
#: p < 0.05 by χ2-test between groups