D I A B E T E S & M E T A B O L I S M J O U R N A L
This is an Open Access article distributed under the terms of the Creative Commons At- tribution Non-Commercial License (http://creativecommons.org/licenses/by-nc/3.0/) which permits unrestricted non-commercial use, distribution, and reproduction in any medium, provided the original work is properly cited.
The Relationship between Diabetes Mellitus and Health-Related Quality of Life in Korean Adults:
The Fourth Korea National Health and Nutrition Examination Survey (2007–2009)
Yong Jun Choi1, Min Suk Lee1, So Yeon An1, Tae Ho Kim2, Seung Jin Han1, Hae Jin Kim1, Yoon-Sok Chung1, Kwan Woo Lee1, Dae Jung Kim1
1Department of Endocrinology and Metabolism, Ajou University School of Medicine, Suwon,
2Division of Endocrinology, Department of Internal Medicine, Myongji Hospital, Kwandong University College of Medicine, Goyang, Korea
Background: Diabetes is a major health problem in Korea. However, interest in the quality of life in patients with diabetes is low.
We examined the effects of diabetes on health-related quality of life (HRQoL) and compared it with HRQoL in the general Kore- an population using the Fourth Korea National Health and Nutrition Examination Survey (KNHANES IV) (2007–2009).
Methods: Using KNHANES IV data, we compared EuroQol (EQ)-5D and EQ-visual analogue scale (VAS) scores after adjust- ing for sociodemographic and psychosocial factors as well as for comorbidities (hypertension, heart disease, stroke, arthritis, and chronic renal disease). Logistic regressions were used to explore determinants for the lowest quintile HRQoL scales in the diabe- tes group.
Results: The mean age of the 14,441 enrolled subjects (6,129 men and 8,312 women) was 52.5±14.5 years. The mean EQ-5D and EQ-VAS scores were significantly lower in the diabetes group (EQ-5D. 0.87; EQ-VAS, 71.94) than in the non-diabetes group (EQ-5D, 0.94; EQ-VAS, 77.40) (P<0.001). Self-reported depressive symptom had a significant effect on lowering the EQ-VAS (odds ratio [OR], 1.7; 95% confidence interval [CI], 1.1 to 2.6) in the diabetes group. Stress level had a significant effect in lower- ing both the EQ-5D (OR, 2.0; 95% CI, 1.3 to 2.9) and the EQ-VAS (OR, 1.9; 95% CI, 1.3 to 2.9). HbA1c, diabetes duration, and treatment modalities had no significant effect on lowering HRQoL.
Conclusion: Diabetes was clearly associated with impaired HRQoL compared with the non-diabetic population regardless of comorbidities. Therapeutic approaches should focus much more on the subjective perception of health in patients with diabetes.
Keywords: Diabetes; EQ-5D; Health-related quality of life; Korea National Health and Nutrition Examination Survey
Corresponding author: Dae Jung Kim
Department of Endocrinology and Metabolism, Ajou University School of Medicine, San 5 Woncheon-dong, Yeongtong-gu, Suwon 443-721, Korea E-mail: [email protected]
INTRODUCTION
Diabetes is not yet a curable disease. Dietary restrictions, medi- cations including insulin injections, and diabetes-associated morbidities seriously deteriorate the quality of life (QoL) of patients with diabetes [1]. The World Health Organization de-
fines health as not only the absence of disease and infirmity, but also the presence of physical, mental, and social well-being [2]. If the purpose of medicine is to make patients healthy, the aim of diabetes treatment should not be limited to controlling glycemia, and more focus should be placed on improving QoL for patients with diabetes.
pISSN 2233-6079 · eISSN 2233-6087
Many recent studies have reported on health-related quality of life (HRQoL) in diabetes patients. HRQoL is poorer in pa- tients with diabetes than in the general population [2,3]. A re- cent multinational study showed that diabetes has a notable impact on general health [4], and poor HRQoL in patients with diabetes is associated with adverse outcomes, including in- creased mortality [5].
Diabetes is a major health problem in Korea. The prevalence of diabetes was estimated to be 9.1% in 2005 [6] with a diabe- tes-related mortality rate of 24.5 per 100,000 persons in 2005, which is double that of a decade earlier [7]. Although there is growing interest in diabetes, interest in the QoL of patients with diabetes is relatively low, and few studies have reported on HRQoL in Korean patients with diabetes. In the present study, we examined the effects of diabetes on HRQoL and compared it with HRQoL in the general Korean population using data from the Fourth Korea National Health and Nutrition Exami- nation Survey (KNHANES IV) (2007–2009).
METHODS
The Ministry of Health and Welfare of Korea began conduct- ing KNHANES in 1998 to examine the general health and nu- tritional status of Koreans [6,8]. KNHANES IV was conducted from July 2007 to December 2009. The survey used a stratified multistage probability sampling design for the South Korean population and a two-stage stratified systematic sampling meth- od. Clusters of households were selected from each district, each including an average of 20 to 23 households. KNHANES con- sists of four different measures: a health interview, a health be- havior survey, a health examination, and a nutrition survey. In KNHANES IV, 31,705 individuals aged >1 year were sampled by the health interview and examination (6,455 in 2007, 12,528 in 2008, and 12,722 in 2009); these individuals represented 9,421 households in 200 districts (1,739 in 2007, 3,707 in 2008, and 3,975 in 2009). From the initial 31,705 individuals sam- pled, 24,871 participated in the survey (4,594 in 2007, 9,744 in 2008, and 10,533 in 2009), for a response rate of 78.4% (71.2%
in 2007, 77.8% in 2008, and 82.8% in 2009). In the present study, we analyzed data from 14,441 subjects aged ≥30 years (6,129 men and 8,312 women), after excluding 1,461 individuals (964 non-respondents on diabetes status and EuroQol [EQ]-5D, 497 participants who had a cancer history). We excluded sub- jects with a history of malignancy because malignancies have obvious deleterious effects on QoL.
Presence of diabetes and measurement of QoL
The presence of diabetes was based on a self-reported question- naire asking if the participants had ever been diagnosed with diabetes; undiagnosed patients who reported diabetes on the health examination survey were not included in this study be- cause we assumed that self-perceived diabetes itself could af- fect HRQoL. Participants with diabetes were asked what year they were diagnosed and what treatment modalities they had experienced (no care, lifestyle modifications, oral hypoglyce- mic agents, and insulin). We calculated the duration of diabe- tes using the year of diabetes diagnosis and divided partici- pants into groups based on that number: ≤10 years, 10 to 20 years, and ≥20 years.
The EuroQol was used evaluate HRQoL. The EuroQol con- sists of two parts, the health-status descriptive system (EQ-5D) and a visual analogue scale (EQ-VAS). The EQ-5D records the level of self-reported problems according to five dimensions (mobility, self-care, usual activities, pain/discomfort, and anx- iety/depression) [9,10]. Each of the dimensions is assessed based on a single question with three response levels (no prob- lems, some problems, and extreme problems). Using a combi- nation of these items, a single health index score was calculat- ed using the Korea valuation set developed by the Korean Centers for Disease Control and Prevention [11]. Scores on the EQ-5D index range from -0.171 to 1, where 1 indicates no problems in any of the five dimensions, zero indicates death, and negative values indicate a health status worse than death.
Next, respondents described their own health status using a VAS ranging from 0 (worst imaginable health) to 100 (best imaginable health) [10].
Covariates
Participants were requested to provide information on house- hold income (divided into quartiles), education level, current job status (employed or not), marital status (single, married, divorced, widow, or widower), current smoker (yes or no), fre- quency of alcohol consumption per week (more than or less than twice per week), level of psychological stress (none, low, moderate, extreme), continuous depressive symptoms during the past 2 weeks (yes or no). Participants also reported wheth- er they had ever had comorbidities including malignancies, hypertension, heart diseases (acute myocardial infarction or angina), stroke, arthritis, and/or chronic renal disease.
Glycated hemoglobin (HbA1c) measurements
Subjects were instructed to fast after 7 PM on the day before blood sampling and to drink only bottled water after 7 PM The next morning, blood (2 mL) was collected from each par- ticipant into a NaF container. Samples were properly processed, refrigerated, and transported in cold storage to the Central Testing Institute at Seoul, Korea on the same day. HbA1c was measured using high-performance liquid chromatography.
We divided HbA1c results into three categories (≤6.5%, 6.5%
to 8.0%, and ≥8.0%).
Statistical analysis
All sample and weight variables were stratified, and the PASW complex-samples procedure was used for all statistical analy- ses. We used the stratification variables and sampling weights designated by the Korean Centers for Disease Control and Prevention for prevalence calculations, which were based on the sample design for each survey year. Sampling weights were adjusted for non-response according to demographic factors after the surveys were completed. The frequencies procedure was performed with cluster as a sampling-district variable, and prevalence was reported with a 95% confidential interval (CI).
The descriptive procedure was used to evaluate the distribu- tion of sociodemographic and clinical variables and QoL mea- surements. The crosstabs procedure was used to compare cat- egorical or ordinal variables in participants with and without diabetes. The general linear model was used to compare con- tinuous variables. Additionally, a sensitivity analysis was used to determine whether including undiagnosed patients with diabetes in the non-diabetes group would significantly alter the HRQoL score. We excluded undiagnosed patients with di- abetes using the health examination survey in the non-diabe- tes group and compared the mean EQ-5D and EQ-VAS scores.
General linear model analyses were also performed using the results of the EQ-5D and EQ-VAS for each chronic disease (diabetes, hypertension, heart diseases, stroke, arthritis, chron- ic renal disease) as dependent variables after controlling for age, gender, survey year, household income, educational level, current job, marital status, current smoking status, frequency of alcohol consumption, level of stress, self-reported depres- sive symptom, and other comorbidities. The survey year was also included as a controlled variable because the EQ-5D and EQ-VAS scores were significantly different according to survey year (data not shown). The EQ-5D and EQ-VAS scales were divided into quintiles, and the odd ratios (ORs) of the lowest
quintile of these scales in the diabetes group were compared with those in the non-diabetic group after adjusting for age, gender, survey year, household income, educational level, cur- rent job, marital status, current smoking status, frequency of alcohol consumption, stress level, self-reported depressive symptoms, and other comorbidities (such as hypertension, heart diseases, stroke, arthritis, and chronic renal disease) us- ing the logistic regression procedure. Four models were con- structed. The ORs in model 1 were analyzed without adjust- ment. The ORs in model 2 were adjusted for age and gender.
In model 3, ORs were further adjusted for survey year, house- hold income, education level, marital status, percentage of current smokers, frequency of drinking, and level of stress and self-reported depressive symptom. In model 4, ORs were fur- ther adjusted for chronic diseases. Subsequently, we also per- formed subgroup analyses for participants with diabetes. Us- ing the logistic regression procedure, the ORs of the lowest quintile of the EQ-5D and EQ-VAS scales for the level of HbA1c (≤6.5%, 6.5% to 8.0%, ≥8.0%), diabetes duration (≤10 years, 10 to 20 years, ≥20 years), treatment modalities (no care, life- style modification, oral hypoglycemic agents, insulin), self-re- ported depressive symptom, the level of stress, and other co- morbidities were obtained after adjusting for age, gender, sur- vey year, household income, educational level, current job, marital status, current smoking, and the frequency of alcohol consumption. All statistical analyses were conducted using PASW Statistics version 18.0 (SPSS Inc., Chicago, IL, USA). P values of less than 0.05 were considered statistically signifi- cant.
RESULTS
Of the 14,441 respondents, 1,240 (8.6%) reported that they had been diagnosed with diabetes. Characteristics of partici- pants with and without diabetes are shown in Table 1.
The mean age for patients with diabetes was significantly higher than that of subjects without diabetes. Household in- come, education level, marital status, employment state, per- centage of current smokers, and drinking frequency were also significantly different between the two groups. The level of psychological stress was similar between the two groups; how- ever, self-reported depressive symptoms were significantly higher in the diabetes group than that in the non-diabetes group. The prevalence of chronic diseases such as hyperten- sion, stroke, heart diseases, chronic renal disease, and arthritis
without diabetes (P<0.001). In the sensitivity analysis to de- termine whether the inclusion of undiagnosed patients with diabetes in the non-diabetes group would significantly alter the HRQoL score, no significant change was observed (0.87 vs. 0.94 for EQ-5D, 71.94 vs. 76.95 for EQ-VAS, P<0.01).
The percentages of subjects who had problems in each scale Table 1. Subject characteristics and EQ-5D and EQ-visual analogue scale (VAS) index scores
Characteristic Diabetes (n=1,240) Non-diabetes (n=13,201) P value
Age, yr 60.1 (59.3-60.9) 48.5 (48.1-48.9) <0.001
Gender, male % 51.8 (48.4-55.2) 49.1 (48.4-49.9) 0.145
Quartile of household income, %
Lowest 31.8 (28.6-35.2) 15.4 (14.3-16.6) <0.001
Lower intermediate 27.4 (24.1-30.9) 24.4 (23.2-25.7)
Higher intermediate 20.5 (17.7-23.5) 29.6 (28.3-30.9)
Highest 20.4 (17.4-23.7) 30.6 (28.7-32.5)
Education level, %
Primary 46.5 (43.1-50.0) 22.8 (21.6-24.1) <0.001
Middle 16.0 (13.6-18.8) 12.2 (11.5-12.9)
High 23.8 (20.9-26.9) 36.1 (34.8-37.4)
College 13.7 (11.4-16.4) 28.9 (27.2-30.6)
Marital status, %
Single 1.2 (0.6-2.2) 5.6 (5.1-6.2) <0.001
Married 75.8 (72.6-78.8) 81.2 (80.1-82.2)
Divorced/widow/widower 23.0 (20.1-26.2) 13.2 (12.4-14.0)
Employed, % 47.8 (44.0-51.6) 64.6 (63.4-65.7) <0.001
Current smoker, % 26.4 (25.6-27.3) 21.3 (18.4-24.4) 0.002
Alcohol consumption (≥2/w), % 21.8 (19.1-24.9) 25.4 (24.4-26.4) 0.034
Level of stress, %
Moderate or extreme 27.5 (24.7-30.5) 28.5 (27.6-29.4) 0.525
None or low 72.5 (69.5-75.3) 71.5 (70.6-72.4)
Depressive symptoms, % 18.7 (16.4-21.2) 14.5 (13.8-15.3) <0.001
Body mass index, kg/m2 25.1 (24.9-25.3) 23.8 (23.7-23.8) <0.001
Waist circumference, cm 87.6 (87.0-88.3) 81.7 (81.5-82.1) <0.001
Hypertension, % 52.4 (49.0-55.7) 16.9 (16.1-17.7) <0.001
Heart disease, % 6.2 (4.8-7.9) 1.7 (1.5-1.9) <0.001
Chronic renal disease, % 1.8 (1.2-2.7) 0.2 (0.2-0.3) <0.001
Stroke, % 6.5 (5.0-8.4) 1.5 (1.3-1.8) <0.001
Arthritis, % 30.0 (27.0-33.2) 15.5 (14.7-16.3) <0.001
HbA1c, % 7.41 (7.31-7.52) - -
Quality of life
EQ-5D 0.87 (0.86-0.88) 0.94 (0.94-0.94) <0.001
EQ-VAS 71.94 (68.33-75.54) 77.40 (76.18-78.62) <0.001
Values are presented as mean (95% confidence intervals).
was also significantly higher in the diabetes group than in the non-diabetic group. The mean EQ-5D index score was 0.87 (95% CI, 0.86 to 0.88) for those with diabetes and 0.94 (95%
CI, 0.94 to 0.94) for those without diabetes (P<0.001). The mean EQ-VAS score was 71.94 (95% CI, 68.33 to 75.54) for those with diabetes and 77.40 (95% CI, 76.18 to 78.62) for those
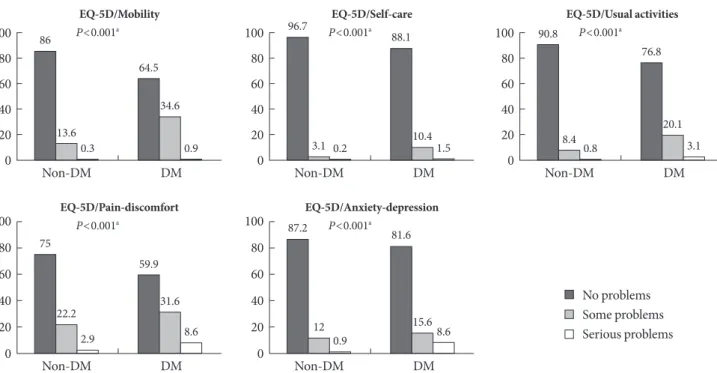
of the EQ-5D index are shown in Fig. 1. In total, 35.5% of those with diabetes had problems with mobility, 11.9% with self-care, 23.2% with usual activities, 40.2% with pain/discomfort, and 18.4% with anxiety/depression. For subjects without diabetes, the percentages were 13.9%, 3.3%, 9.2%, 25.1%, and 13.1%, re- spectively.
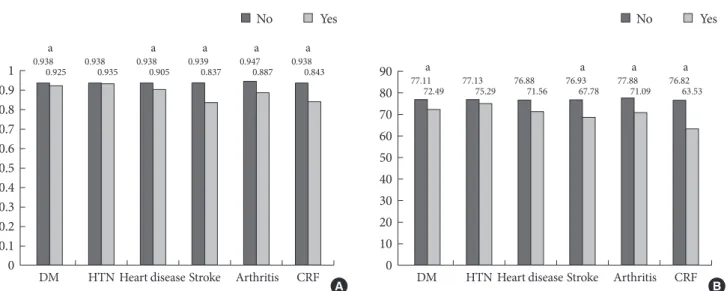
The mean EQ-5D index and EQ-VAS score were signifi- cantly lower in the diabetes group than in the group without diabetes. When we compared the mean EQ-5D index and EQ- VAS scores after adjusting for socio-demographic and psycho- social factors and for the presence of chronic diseases using a general linear model (Fig. 2), diabetes was still associated with deficits in HRQoL, with decreases of 0.013 units on the EQ- 5D index and 4.62 units on the EQ-VAS compared with sub- jects without diabetes (P<0.05). However, the decreases in HRQoL were smaller than those for other chronic diseases (heart diseases, stroke, arthritis, and chronic renal disease), except hypertension, when controlling for other comorbidities.
The ORs for the lowest quintile of the EQ-5D index and EQ-VAS score for the diabetes group compared with the non- diabetes group are shown in Table 2. In model 1, the OR for the lowest quintile of the EQ-5D index was 3.20 (95% CI, 2.76 to 3.72). Even in model 4, after adjusting for other factors in-
Non-DM DM
100 80 60 40 20 0
P<0.001a EQ-5D/Mobility 86
13.60.3
64.5 34.6
0.9
Non-DM DM
100 80 60 40 20 0
P<0.001a
EQ-5D/Pain-discomfort 75
22.2 2.9
59.9
31.6 8.6
Non-DM DM
100 80 60 40 20 0
P<0.001a
EQ-5D/Anxiety-depression 87.2
12 0.9
81.6
15.68.6
Non-DM DM
100 80 60 40 20 0
P<0.001a EQ-5D/Self-care 96.7
3.1 0.2
88.1
10.41.5
Non-DM DM
100 80 60 40 20 0
P<0.001a
EQ-5D/Usual activities 90.8
8.4 0.8
76.8
20.1 3.1
Fig. 1. Distribution of perceived problem levels in each of the dimensions of the EQ-5D descriptive system for the diabetes (DM) and non-DM groups.
aSignificance level between with and without diabetes by chi-square test.
No problems Some problems Serious problems
cluding comorbidities, the significance did not change (OR, 1.27; 95% CI, 1.04 to 1.55). Similarly, the OR for the lowest quintile of the EQ-VAS score in model 1 was 2.21. In model 4, the OR for the lowest quintile of the EQ-VAS score was 1.52 (95% CI, 1.28 to 1.81).
We performed a subgroup analysis for patients with diabe- tes to examine the impacts of the HbA1c level, diabetes dura- tion, treatment modalities, presence of depressive symptom, stress level, and comorbidities on impaired HRQoL (data not shown). The results indicated that HbA1c level, diabetes dura- tion, and treatment modalities did not have significant effects on the HRQoL. Self-reported depressive symptom had a sig- nificant effect only on lower EQ-VAS (OR, 1.7; 95% CI, 1.1 to 2.6; P<0.05). However, the level of stress significantly lowered both EQ-5D (OR, 2.0; 95% CI, 1.3 to 2.9, P<0.01) and EQ- VAS (OR, 1.9; 95% CI, 1.3 to 2.9; P<0.01). Among the comor- bidities tested, only stroke and heart diseases had significant effects on both EQ-5D and EQ-VAS.
DISCUSSION
Our results demonstrated that patients with diabetes had sig- nificantly lower HRQoL than those without diabetes. Our data
are consistent with previous population-based studies that have demonstrated the considerable impact of diabetes on lower HRQoL [4,12,13]. Numerous demographic and psycho- social factors such as age, gender, depressive symptom, and psychological stress influence QoL. Diabetic complications are among the most important disease-specific determinants of QoL [1]. Actually, OR was largely attenuated in models 2, 3, and 4 (from 3.20 to 1.27) indicating that differences in age, in- come, education and diabetes complications play a large role in the observed difference in HRQoL. However, we also found that HRQoL scores remained low in patients with diabetes even after adjusting for many socio-demographic and psycho-
social factors and comorbidities. Therefore, diabetes itself might lower HRQoL compared with that in the general population regardless of complications and other related factors.
In this study, patients with diabetes reported better HRQoL than did people with a variety of other chronic diseases (such as heart disease, stroke, arthritis, and chronic renal disease).
Previous studies [14-16] have reported that patients suffering from stroke or heart disease had lower HRQoL than those with diabetes, and HRQoL in those with hypertension was higher than that for patients with diabetes [15]. Our finding that the HRQoL in Korean patients with diabetes was better than that in patients with other diseases was also consistent Table 2. Multivariate-adjusted odd ratios for the lowest quintile of the EQ-5D and EQ-visual analogue scale (VAS) scores for the diabetes group compared with the non-diabetes group
Model
EQ-5D EQ-VAS
OR (95% CI)
P value OR (95% CI)
P value
Non-diabetes Diabetes Non-diabetes Diabetes
Model 1 1 3.20 (2.76-3.72) <0.001 1 2.21 (1.91-2.56) <0.001
Model 2 1 1.68 (1.41-1.99) <0.001 1 1.68 (1.44-1.96) <0.001
Model 3 1 1.46 (1.21-1.77) <0.001 1 1.63 (1.38-1.93) <0.001
Model 4 1 1.27 (1.04-1.55) 0.018 1 1.52 (1.28-1.81) <0.001
Model 1, no adjustments; Model 2, adjusted for age and gender; Model 3, adjusted for age, gender, year, household income, education level, marital status, occupational status, smoking, alcohol, stress, and presence of depression; Model 4, adjusted for age, gender, year, household in- come, education level, marital status, occupational status, smoking, alcohol, stress, presence of depression, and other chronic diseases (hyper- tension, heart diseases, stroke, arthritis, and chronic renal disease).
OR, odds ratio; CI, confidence interval.
Fig. 2. Multi-variables adjusted means of (A) EQ-5D scores and (B) EQ-visual analogue scale (VAS) according to chronic diseas- es; diabetes (DM), hypertension (HTN), heart diseases, stroke, and chronic renal failure (CRF). aSignificant difference between those with and without the chronic disease (P<0.05).
a a a a a
DM HTN Heart disease Stroke Arthritis CRF 1
0.9 0.8 0.7 0.6 0.5 0.4 0.3 0.2 0.1 0
0.938
0.925 0.938
0.935 0.938
0.905 0.939
0.837 0.947
0.887 0.938
0.843 a a a a
DM HTN Heart disease Stroke Arthritis CRF 90
80 70 60 50 40 30 20 10 0
77.11
72.49 77.13
75.29 76.88
71.56 76.93
67.78 77.88
71.09 76.82 63.53
No Yes No Yes
A B
with previous studies.
QoL in patients with diabetes could be affected by various factors. Of these factors, we examined diabetes duration, HbA1c level, treatment modalities, depressive symptom, psy- chological stress, and comorbidities in a subgroup analysis of patients with diabetes. Our results demonstrated that subjec- tive factors such as depressive symptom and psychological stress affected HRQoL. In contrast, objective factors related to diabetic status did not appear to affect HRQoL. In particular, HbA1c, an indicator of glycemic control, was not associated with impaired HRQoL. Thus, glycemic control itself may not necessarily translate to better QoL [17], and a subjective per- ception of well-being could be more important for the HRQoL of patients with diabetes than objective diabetic status.
There are some preference-based instruments, such as the Rosser Index, the 15D, the Quality of Well-Being scale, the Health Utility Index (HUI) versions II and III, the EQ-5D, and the SF-6D, which are based on the generic SF-36 health survey [18]. It has been suggested in some reports that the SF-36-based SF6D is more sensitive than the EQ5D in healthy people and for detecting small health changes, particularly at the extremes of the scale [19,20]. However, in the ADVANCE trial, algo- rithms based on survey instruments including more compre- hensive aspects of HRQoL did not appear to measure greater variations in utility than those based on simpler instruments such as the EQ-5D. Moreover, the EQ-5D is easier to use and less time-consuming [21]. Therefore, the EQ-5D has some ad- vantages, particularly for large population studies such as the KNHANES.
In this study, the presence of diabetes was based on a self- reported questionnaire, so the reliability of the diagnosis may be arguable. However, the mean HbA1c level for self-reported diabetes was 7.41% and showed clear differences between pa- tients with diabetes and healthy subjects. Moreover, we origi- nally thought that a subjective perception of disease could be more important for HRQoL than an objective diagnosis, and the results were not significantly different in the sensitivity analysis.
The strength of our study was that these data were obtained from a nationwide population with a high response rate and therefore provided representative information on the Korean population. Nevertheless, several study limitations should be considered. First, although diabetes complications were close- ly related to individual HRQoL level [1], we did not assess all diabetic complications because KNHANES is not a survey only
for diabetes and does not provide all data related to diabetes complications. We did control for other comorbidities, includ- ing heart diseases (acute myocardial infarction and angina) and stroke, which are macrovascular complications, and for chronic renal disease, which is a microvascular complication.
Although it is possible that uncontrolled diabetic complica- tions could have affected the lower HRQoL observed in the diabetic group, the possibility that diabetes itself affects QoL still exists regardless of diabetes complications. To examine this possibility, further studies on HRQoL in patients with dia- betes are needed, including a complete investigation of diabet- ic complications. Second, we did not determine whether the patients with diabetes had type 1 or type 2 diabetes. However, only 35 patients may have had type 1 diabetes (about 3% among all diabetes diagnoses) based on a diagnosis before the age of 30 years in this survey. Therefore, we considered that most pa- tients in the study population had type 2 diabetes. Third, we could not measure HRQoL using a diabetes-specific quality of life tool [22-24] as none have been validated in Korea, and only EQ-5D was measured in KNHANES. Studies are needed that use disease-specific QoL tools to assess the association between diseases and HRQoL [25].
In conclusion, we found that diabetes was clearly associated with impaired HRQoL compared with a population without diabetes. This association may be independent of other co- morbidities. In patients with diabetes, subjective factors such as depression and psychological stress, rather than objective factors such as glycemic control, were related to impaired HRQoL, suggesting that objectively well-controlled diabetes does not necessarily translate to a better QoL. Therapeutic ap- proaches should focus more on the subjective perception of health by patients with diabetes, and further studies on HRQoL are needed for Korean patients with diabetes.
CONFLICTS OF INTEREST
No potential conflict of interest relevant to this article was re- ported.
ACKNOWLEDGMENTS
This study was supported by a grant of the Korea Healthcare technology R&D Project, Ministry of Health and Welfare, Re- public of Korea (A102065).
REFERENCES
1. Rubin RR, Peyrot M. Quality of life and diabetes. Diabetes Metab Res Rev 1999;15:205-18.
2. Constitution of the World Health Organization. Handbook of basic documents. 5th ed. Geneva: Palais des Nation; 1952. p3- 20.
3. Saito I, Inami F, Ikebe T, Moriwaki C, Tsubakimoto A, Yone- masu K, Ozawa H. Impact of diabetes on health-related quality of life in a population study in Japan. Diabetes Res Clin Pract 2006;73:51-7.
4. Alonso J, Ferrer M, Gandek B, Ware JE Jr, Aaronson NK, Mosconi P, Rasmussen NK, Bullinger M, Fukuhara S, Kaasa S, Leplege A; IQOLA Project Group. Health-related quality of life associated with chronic conditions in eight countries: re- sults from the International Quality of Life Assessment (IQO- LA) Project. Qual Life Res 2004;13:283-98.
5. Kleefstra N, Landman GW, Houweling ST, Ubink-Veltmaat LJ, Logtenberg SJ, Meyboom-de Jong B, Coyne JC, Groenier KH, Bilo HJ. Prediction of mortality in type 2 diabetes from health- related quality of life (ZODIAC-4). Diabetes Care 2008;31:932-3.
6. Choi YJ, Kim HC, Kim HM, Park SW, Kim J, Kim DJ. Preva- lence and management of diabetes in Korean adults: Korea National Health and Nutrition Examination Surveys 1998-2005.
Diabetes Care 2009;32:2016-20.
7. Korea National Statistical Office. 2005 statistical results about cause of death. Daejeon: Korea National Statistical Office; 2006.
8. Kim SM, Lee JS, Lee J, Na JK, Han JH, Yoon DK, Baik SH, Choi DS, Choi KM. Prevalence of diabetes and impaired fast- ing glucose in Korea: Korean National Health and Nutrition Survey 2001. Diabetes Care 2006;29:226-31.
9. The EuroQol Group. EuroQol--a new facility for the measure- ment of health-related quality of life. Health Policy 1990;16:
199-208.
10. Brooks R. EuroQol: the current state of play. Health Policy 1996;
37:53-72.
11. Nam HS, Kim KY, Kwon SS, Koh KW, Poul K. EQ-5D Korean valuation study using time trade of method. Seoul: Centers for Disease Control and Prevention; 2007.
12. Ware JE Jr, Sherbourne CD. The MOS 36-item short-form health survey (SF-36). I. Conceptual framework and item se- lection. Med Care 1992;30:473-83.
13. Smith DW. The population perspective on quality of life among
Americans with diabetes. Qual Life Res 2004;13:1391-400.
14. Stewart AL, Greenfield S, Hays RD, Wells K, Rogers WH, Ber- ry SD, McGlynn EA, Ware JE Jr. Functional status and well-be- ing of patients with chronic conditions. Results from the Med- ical Outcomes Study. JAMA 1989;262:907-13.
15. Vickrey BG, Hays RD, Rausch R, Sutherling WW, Engel J Jr, Brook RH. Quality of life of epilepsy surgery patients as com- pared with outpatients with hypertension, diabetes, heart dis- ease, and/or depressive symptoms. Epilepsia 1994;35:597-607.
16. Naess S, Midthjell K, Moum T, Sorensen T, Tambs K. Diabetes mellitus and psychological well-being. Results of the Nord- Trondelag health survey. Scand J Soc Med 1995;23:179-88.
17. Ali S, Stone M, Skinner TC, Robertson N, Davies M, Khunti K.
The association between depression and health-related quality of life in people with type 2 diabetes: a systematic literature re- view. Diabetes Metab Res Rev 2010;26:75-89.
18. Kontodimopoulos N, Pappa E, Papadopoulos AA, Tountas Y, Niakas D. Comparing SF-6D and EQ-5D utilities across groups differing in health status. Qual Life Res 2009;18:87-97.
19. Kopec JA, Willison KD. A comparative review of four prefer- ence-weighted measures of health-related quality of life. J Clin Epidemiol 2003;56:317-25.
20. Longworth L, Bryan S. An empirical comparison of EQ-5D and SF-6D in liver transplant patients. Health Econ 2003;12:
1061-7.
21. Glasziou P, Alexander J, Beller E, Clarke P; ADVANCE Col- laborative Group. Which health-related quality of life score? A comparison of alternative utility measures in patients with type 2 diabetes in the ADVANCE trial. Health Qual Life Out- comes 2007;5:21.
22. Influence of intensive diabetes treatment on quality-of-life outcomes in the diabetes control and complications trial. Dia- betes Care 1996;19:195-203.
23. Boyer JG, Earp JA. The development of an instrument for as- sessing the quality of life of people with diabetes. Diabetes-39.
Med Care 1997;35:440-53.
24. Polonsky WH, Anderson BJ, Lohrer PA, Welch G, Jacobson AM, Aponte JE, Schwartz CE. Assessment of diabetes-related distress. Diabetes Care 1995;18:754-60.
25. El Achhab Y, Nejjari C, Chikri M, Lyoussi B. Disease-specific health-related quality of life instruments among adults diabet- ic: a systematic review. Diabetes Res Clin Pract 2008;80:171-84.