1. Introduction
The axial offset anomaly (AOA), which is also known as the CRUD induced power shift (CIPS), is one of the key issues in maintaining stable pressurized water reactor (PWR) plant operations, especially in plants with long-pe- riod cycle operations [1]. The AOA is caused by boron accumulating on the fuel rod surface under sub-cooled boiling conditions in the PWR primary coolant and anom- alous neutron absorption due to the boron accumulating during the plant’s operation.
The NPP in Korea have experienced AOA several times.
The root cause of AOA has not been clearly understood until now. Even though plants have similar operation con- dition (i.e., similar thermos hydraulic conditions, water chemistry, and structural materials), the AOA behavior of each plant is different from other plants. In order to understand the plant’s specific behavior and to have coun- termeasures against AOA, the mechanism of the CRUD deposition should be clarified [2].
The economics of power generation demand that PWRs
are driven to higher duty cycles and longer cycle durations. As a consequence, some plants may experience boiling in the upper regions of high duty cores. Among other effects, the boiling duty facilitates the enhanced dep- osition of corrosion products on high power, which are mostly first load fuel rods. Such CRUD deposits on the fuel surfaces can provide the substrate with large concen- trations of boron, thereby causing the depression of ther- mal neutron flux via the 10B(n,α)7Li reaction [3]. Large amounts of boron deposited on fuel in an axially asym- metric fashion can give rise to the depression of a thermal neutron flux in the upper part of a reactor. With such anomalous flux depressions, AOA has been observed in increasing numbers in high-duty PWRs that use high burn-up fuel operating at high temperatures and long fuel cycles [4]. The affected plants typically undergo local sub-cooled nucleate boiling in the highest-power channels, which leads to an enhanced susceptibility to AOA. Until recently, the root cause of AOA has been attributed to the hiding of lithium metaborate (γ-LiBO2) in highly po- rous CRUD deposits [5,6].
However, this compound has retrograde solubility and has never been directly observed in PWR fuel deposits.
Plant-to-plant and cycle-to-cycle variations in the extent of AOA also suggest that other factors are involved in
A Study on the Crystalline Boron Analysis in CRUD in Spent Fuel Cladding Using EPMA X-ray Images
Yang Hong Jung†, Seung-Je Baik, and Young-Gwan Jin
Korea Atomic Energy Research Institute, 111- Daedeok-daero, 989 Beon-gil, Yuseong-gu, Daejeon, 34057, Republic of Korea (Received November 13, 2019; Revised February 13, 2020; Accepted February 13, 2020)
Chalk River Unidentified Deposits (CRUDs) were collected from the Korean pressurized water reactor (PWR) plant (A, B, and C) where the axial offset anomaly (AOA) occurred. AOA, also known as a CRUD-induced power shift, is one of the key issues in maintaining stable PWR plant operations. CRUDs were sampled from spent nuclear fuel rods and analyzed using an electron probe micro-analyzer (EPMA). This paper describes the characteristics of boron-deposits from the CRUDs sampled from twice-burnt assemblies from the Korean PWR. The primary coolant of a PWR contains boron and lithium. It is known that boron deposition occurs in a thick CRUD layer under substantial sub-cooled nucleate boiling (SNB). The results of this study are summarized as follows. Boron was not found at the locations where the existence was confirmed in simulated CRUDs, in other words, the cladding and CRUD boundaries. Nevertheless, we clearly observed the presence of boron and confirmed that boron existed as a lump in crystalline form. In addition, the study confirmed that CRUD existed in a crystal form with a unique size of about 10 μm.
Keywords: CRUD, PWR, Ultrasonic cleaner, X-ray image mapping, Shielded - EPMA
†Corresponding author: [email protected]
Yang Hong Jung: Senior Research Engineer, Seung-Je Baik:
Researcher, Young-Gwan Jin: General Manager
the root cause, including characteristics of CRUD sources, reactor coolant system (RCS) chemistry, and especially nickel, iron, boron and lithium concentrations. Thus, too little is known about the nature of these deposits and the mechanism of their deposition to fully understand the root cause of AOA [7-11]. It was confirmed that the chemical form of boron in deposits on the simulated fuel rod surface just after removal from the boiling surface was Li2B4O7
[12]. Unfortunately, the existence of Li2B4O7 in deposits on the fuel surface has not been confirmed yet. Its resi- dence time on the fuel surface is too short to be measured and there is a hideout return of boron into the primary cooling water during the plant shutdown [13].
The purpose of this study is to investigate boron in the CRUD from AOA Korean power plants. We also demon- strate that it is possible to analyze the morphology and composition of boron by faithfully observing x-ray image mappings using EPMA as a technique for analyzing the very small amount of boron. Until now, the shape of boron present in CRUD has not been proved, but in this study, the existence and morphology of boron will be confirmed experimentally.
2. Samples and Methods
Two types of CRUD and one kind of cladding were sampled from Korean PWR plant-A, B, C, in which AOA occurred. The morphology and composition of boron in the prepared CRUD samples were analyzed using EPMA.
There are several methods to collect CRUD samples from high-burn-up nuclear fuel cladding. First, in the hot-cell space, where the fuel rod can be handled, an analysis of the fuel cladding tube and observation of the CRUD in the mounted cladding specimens. Next, there is the meth- od of collecting a sample to analyze the composition and state of the CRUD with respect to the nuclear fuel bundle, which can be obtained from a nuclear fuel storage rack or reactor refueling cavity, where spent fuel bundles can be handled. However, it is difficult to obtain accurate ana- lytical information in comparison with specimens sampled in a hot-cell space. In this study, a CRUD was sampled from the reactor refueling cavity and then results from the CRUD analysis were determined using an EPMA.
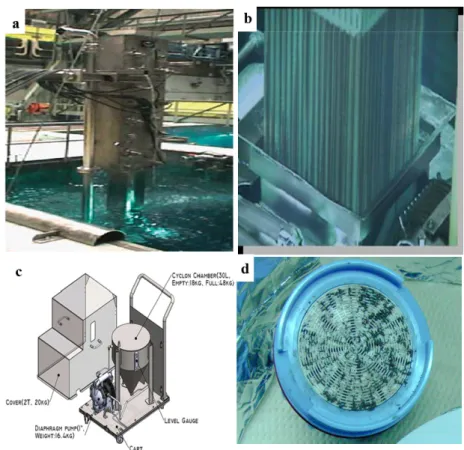
2.1 Sampling CRUD using an ultrasonic cleaner As shown in Fig. 1, an ultrasonic cleaning device that
Fig. 1 Ultrasonic cleaner in a reactor refueling cavity (a, b), CRUD sampling device(c), filter paper for sampling (d) plant A and C.
effectively removes radioactive solids in the plant A and C, such as CRUD or scale fuel, uses an ultrasonic wave [14]. A highly radioactive CRUD layer may be easily dis- lodged, resulting in a radiological concern in which fuel rods may need to be cleaned. This cleaning process is usually carried out by a number of means such as ultra- sonically or chemically cleaning the exterior of the fuel rods to remove the loose CRUD buildup.
The CRUD collection suction pipe head gets as close to the fuel bundle as possible because substances such as floating substances in the reactor refueling cavity water tank remained. The ultrasonic cleaning device was oper- ated with all of the preparations completed. At the same time, a CRUD collection pump was operated.
2.2 EPMA
The shielded EPMA used in this study was fabricated to be able to conduct highly irradiated fuels. In order to reduce the influence of radioactivity on the specimen’s mounting area as well as the Wavelength dispersive spec- trometry (WDS) and column, appropriate parts were shielded with lead and tungsten. In addition 15 kV and 20 nA were used for CRUD specimens because the speci- men’s thickness was extremely thin. A CRUD sampled paper filter cut with scissors was attached to the specimen holder using adhesive carbon tape. Although CRUD speci- mens were attached to a conductive carbon tape, carbon evaporation was performed for 10 seconds that considered the electrical conductivity.
3. Results and Discussion
3.1 Analysis on CRUD of plant-A
Fig. 2a presents the simulated CRUD by J. Denshon [15] that was analyzed using a secondary ion mass spec-
trometry (SIMS) analyzer. This explains the effect of bor- on on AOA and the background of the research using simulated CRUD to analyze the shape of boron, which has not been proved yet. Fig. 2a shows the distribution of Zr, Fe, and B with cladding boundaries. They ex- perimentally proved that boron can be deposited at a thick- ness of several μm, as shown in the figure. Fig. 2b shows a CRUD image of a small fragment and an x-ray image of iron obtained from J. A. Sawicki [16]. There was an attempt to find evidence of Ni2FeBO5 in this picture, but there was no x-ray image of boron.
As already mentioned in the Introduction, it was con- firmed that the chemical form of boron in deposits on the simulated fuel rod surface just after removal from the boiling surface was Li2B4O7. Unfortunately, the existence of Li2B4O7 in deposits on the fuel surface has not been confirmed yet [13].
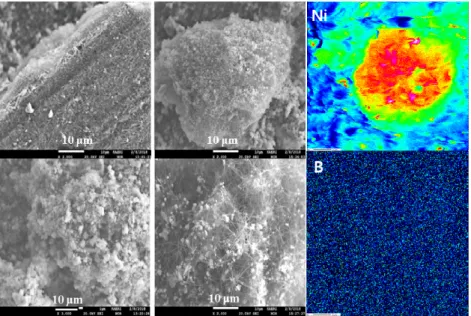
Fig. 3 shows the CRUD shape extracted from the nuclear fuel cladding where the AOA occurred. The same Korean PWR plant site has experienced several AOAs. The CRUD was sampled twice on a power plant where the AOA occurred and was analyzed using EPMA. Fig. 3 shows the sample taken at plant-A, and Fig.s 4 and 5 show the results of sampling at plant-B. The AOAs sam- pled from the analytical specimens had an axial offset anomaly of 4.2% and 3.7% in the high upper span, respectively. In Fig. 3, the first figure on the left shows the shape of the Flake-CRUD side. Fig. 3 shows a large amount of needle-like CRUD, which is known as the com- position of Ni2FeBO5, among the typical CRUD shapes.
The needle-shaped CRUD, as shown in Fig. 2b, which Jerzy and others attempted to identify, is present in the form of NiO oxidized Ni, which is the main material of the steam generator. The deposited boric acid is bonded and deposited. We tried to confirm the presence of boron
Fig. 2 (a) Simulated crud analyzed using SIMS (b) Scanning TEM image of a small fragment and x-ray image of iron and nickel obtained [15,16].
by using EPMA in the prepared sample, but even a trace amount of boron was not confirmed as shown in the figure. Some say it is difficult to confirm the presence of boron in a wavelength spectrometer (WDS) attached to EPMA. However, we are confident that WDS will be able to identify the boron present in the CRUD and ana-
lyze another form of CRUD, as shown in Fig. 5.
3.2 Analysis on CRUD of plant-B
However, we prepared and analyzed the specimen shown in Fig. 4 with a conviction that boron will remain in oxides containing boric acid in any form. Fig. 4 shows Fig. 3 SEM of a crud flake sampled with ultrasonic cleaner in an AOA PWR plant-A. Cladding-side of flake and x-ray image mapping of Ni and B.
Fig. 4 PWSCC fracture profile of steam generator tube plug (hot leg) and x-ray image mapping of boron according to fracture position from plant-B. ; (a) tube plug cross section and PWSCC mark. (b) A tube plug and internal crack photo. (c-c’) B-2 'Inside fracture photograph of crack and boron concentration. (d-d’) B-2 'crack at mid-section and boron concentration. (e-e’) B-2 'Outside crack image and boron concentration.
the PWSCC (Primary water stress corrosion cracking) fracture profile of the steam generator tube plug and the x-ray image mapping of boron according to the fracture position. Currently, boric acid is widely used as a materi- al to suppress the PWSCC generated in the primary cool- ant of the steam generator. Several experimental results have shown that the addition of boric acid effectively in- hibits the growth of IGA/IGSCC (Intergranular attack/
Intergranular stress corrosion cracking) against Inconel 600 alloys. Fig. 4-A is a cross-sectional photograph of the fracture segment of PWSCC. Fig. 4-A-1 is the nar- rowed areas for tube plug and tube connection, as shown in Fig. 4-B-1. Fig. 4-A-2 is the site where four PWSCC fractures occurred. When expanded it as shown in Fig.
4-B, a shape like Fig. 4-B-2'can be observed. Fig.
4-B-2-c' site was cleaved to confirm the presence of bor- on in the fracture plane. Fig. 4-C is the shortest time in- side the Fig. 4-B-2'-c' region, ie, the shortest crack oc- curred, Fig. 4-D is the midpoint, and E is the beginning of the PWSCC fracture inside the tube plug. Fig. 4-E is the longest contact with the primary coolant that flowed inside the tube and its shape is as shown at Fig. 4-E'.
And Fig.s 4-C', D' represents the relative values of boron present at each site. In this way, the boron was able to observe a change in the concentration depending on the point at which the crack occurred. The morphology of boric acid-containing oxides, as shown in the figure, re- sembles SEM shape of needle-like CRUD Ni2FeBO5, which is J. A. Sawicki [16].
In the Fig. 4, there is an SEM shape of needle-like CRUD Ni2FeBO5, which J. A. Sawicki [15] and others
tried to analyze. Also, the number 1 was the area where the contact with the primary coolant was the shortest, and the shape shows Fig. 4-B-1'. As can be seen from this figure, it was confirmed that the remnants of the primary coolant that penetrated into the damaged tube seemed to be significantly different depending on the depth that pe- netrated into the tube. We determined that the boric acid added to the primary coolant would be remaining in the oxides containing boric acid, and x-ray image mapping was conducted under the same conditions as c, d, and e. As you know, quantitative analysis of boron, a very light element, is difficult. However, the analysis used to determine the existence of boron at a relative ratio, as shown in the figure was useful.
The conditions for introducing boric acid into the pri- mary coolant are as follows. The concentration of boron is maintained at approximately 1,200 to 2,000 ppm at the initial startup of the reactor, although there is a slight dif- ference depending on the degree of the nuclear fuel’s enrichment. The boron concentration is maintained at 0 ppm at the end of the cycle when the reactor is shut off.
Thereafter, the temperature is lowered and the concen- tration of boron in the shutdown is increased to 2,150 ppm in order to completely suppress the nuclear reaction.
Thus, it can be seen that the boron concentration of the primary coolant is significantly higher than that of the secondary.
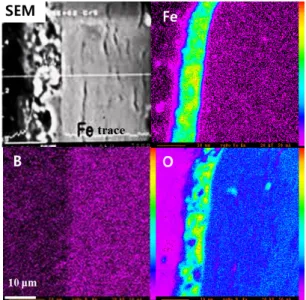
Fig. 5a shows the specimen of CRUD sampled by an ultrasonic cleaner in PWR plant-B. The existence and shape of boron were not confirmed in the figure. Fig. 5b shows the result of analyzing the specimen mounted by cutting the cladding from the fuel rod transferred from Korean PWR plant-B
The SEM image of the CRUD deposited on the cladding was observed in the figure. It was also confirmed clearly in the x-ray image mapping of Fe and O, which are the main elements of CRUD. However, according to the ex- perimental results of the simulated CRUD shown in Fig.
2a, we think that the existence of boron should exist in some shape. The existence of boron was not confirmed as shown in the figure, although the existence of boron was considered to be in any form if the shape of the CRUD and the corresponding distribution of Fe and O were correctly observed, as shown in SEM.
3.3 Analysis on CRUD of plant-C
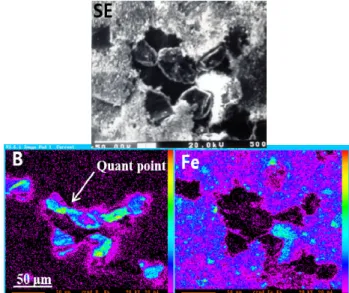
Fig. 6 shows a specimen analyzing the CRUD taken with an ultrasonic cleaner, as shown in Fig. 5a. The pres- ence of boron was clearly observed on the left side of Fig. 6. Also, as shown on the right side of Fig. 6, it was confirmed that boron was found to exist as a lump in Fig. 5 SEM of cross-section of fuel rod and x-ray image mapping
of (a) Fe, (b) O, (c) B from plant-B.
a crystalline form. It was not known why the boric acid injected into the primary coolant crystallized into the same mass as the figure, but we succeeded in confirming the shape of the CRUD, as shown in Fig. 6, while exchanging a large number of CRUD specimens.
We talked with many researchers about the boron mass produced as shown in the figure. There was an opinion that the colloid could have come off the control rod and that it could not be excluded from the spent fuel pool storage tank (SFP) next to a reactor with a high boric acid concentration, not inside the reactor. However, there is no known major cause of generation as shown in the figure.
We did not focus on the quantitative analysis of boron.
Instead, we focused on confirming the existence of boron, as shown in the figure. Although many researchers have studied the presence and composition of boron, it was un- fortunately confirmed that the chemical form of boron in deposits on the simulated fuel rod surface just after removal from the boiling surface was Li2B4O7. Unfortunately, the existence of Li2B4O7 in deposits on the fuel surface has not been confirmed yet [13]. However, as already men- tioned, the quantitative analysis of boron, which is a very light element, lacks the ability to be accurately analyzed and experimented on. We attempted quantitative analysis by stoichiometry where indicated in the figure. This method performs qualitative analysis with WDS and then finds possible elements. Afterwards, the composition was de- termined to be an easily oxidizable form of each element, and the elements observed were quantitatively analyzed.
As shown in the figure, the total amount of oxidized ele- ments was 16 wt%. As a result, it can be concluded that the value of about 84 wt%, the fraction (or ratio) of Li and B is unknown, so there is no way to determine which Li and B contain compounds. which excluded the sum of the minor elements of 16 wt% in the picture of boron x-ray image mapping.
Researchers have attempted to confirm the presence of boron in Ni2FeBO5, a constituent of needle-like Simulated-CRUD [14], but have rarely confirmed the presence of boron. As shown Fig. 7, we would say that these present values exist in the form of various com- pounds containing boron.
So far, we have conducted an analytical test on the mor- phology and composition of boron remaining in the CRUD. As a result, boron existed in the form of com- pounds such as Li2B4O7 at the boundary between CRUD and cladding, but this was not observed experimentally.
We conducted an empirical analysis of the presence of boron in needle-like CRUD, but unfortunately, the pres- ence of boron was not identified. It is consistent with the fact that many other researchers have not identified it.
4. Conclusions
Two types of CRUD and one kind of cladding were sampled from Korean PWR plant-A,B,C in which AOA occurred and the shape of the boron was observed using x-ray image mapping. The morphology and composition of boron in the prepared CRUD samples were analyzed Fig. 6 SEM of a crud flake sampled with ultrasonic cleaner
in an AOA PWR plant-C. X-ray image mapping of (a) Fe, (b) O, (c) B.
Fig. 7 SEM of a crud flake sampled with ultrasonic cleaner in an AOA PWR plant-C. X-ray image mapping of (a) Fe, (b) B, (c) Quantitative analysis.
using EPMA.
The needle-shaped CRUD sampled PWR plant-A was present in the form of NiO oxidized Ni, which is the main material of the steam generator and was investigated. We tried to confirm the presence of boron, but even a trace amount of boron was not confirmed.
The CRUD deposited on the cladding sampled PWR plant-B was observed and clearly confirmed in the x-ray image mapping of Fe and O, which are the main elements of CRUD. But the existence of boron was not confirmed on the mounted cladding specimen.
The CRUD taken from an ultrasonic cleaner sampled PWR plant-C was investigated. The presence of boron was clearly observed and it was confirmed that boron was found to exist as a lump in a crystalline form. It was not known why the boric acid injected into the primary coolant crystallized into the same mass.
As a result, boron existed in the form of compounds such as Li2B4O7 at the boundary between CRUD and clad- ding, but this experiment did not observe yet. Another form of boron present in CRUD is known as Ni2FeBO5. We conclude that we can confirm acceptable results for the existence of boron sampled with an ultrasonic cleaner CRUD. These results will help in understanding the nu- clear, chemical and hydrothermal phenomena in borated fuel CRUD.
References
1. E. Décossin, O. Bremnes, and A. Tigeras, Proc.
International Conference on Water Chemistry of Nuclear Reactor Systems, Paper L14-4, Berlin, Germany (2008).
2. W. Y. Maeng, B. S. Min, H. M. Kwon, I. K. Choi, J. W. Yeon, J. I. Kim, H. S. Woo, Y. K. Kim, and J. Y. Park, Proc. International Conference on Water Chemistry of Nuclear Reactor Systems, Paper L14-1, Berlin, Germany (2008).
3. H. Bichsel and T. W. Bonner, Phys. Rev., 108, 1025 (1957). https://doi.org/10.1103/PhysRev.108.1025 4. P. L. Frattini and T. Moser, Ultrasonic fuel cleaning-EPRI
technology for efficient removal of corrosion products from, Nuclear Energy International (2000).
5. G. P. Sabol, J. R. Secker, J. Kormuth, H. Kunishi, and
D. L. Nuhfer, EPRI Report, TR-108320 (1997).
6. G. P. Sabol, J. R. Secker, H. Kunishi, and B. Cheng, Proc. Fontevraud IV International Symposium, pp. 1159 - 1172, Water Reactors, Lake Tahoe (NV), USA (1998).
7. J. A. Sawicki, Proc. Axial Offset Anomaly (AOA) Science Workshop, Palo Alto, EPRI Report.1000137, Palo Alto, CA (2000).
8. M. Foucault, A. Long, P. Combrade, I. Rodet, and M.
Bouchacourt, Proc. International Conference Water Chemistry in Nuclear Reactors Systems, Avignon, France (2002).
9. Y.-K. Kim, T. -J. Kwon, G. -H. Kim, O. -H. Kim, W. -B. Kim, J. -W. Kim, J. -S. Kim, J. -W. Kim, J.
-H. Kim, H. -J. Kim, H. -J. Kim, H. -J. Kim, G. -I.
Nam, I. -I Ryu, J. -S. Ryu, C. -H. Ryu, J. -E. Moon, S. -G. Park, E. -J. Park, J. -Y. Park, H. -Y. Park, H.
-G. Bae, G. -B. Seong, S. -R. Son, S.-G. Yang, J. -J.
Oh, H. -S. Woo, S. -G. Yoo, S. -N. Lee, S. -G. Lee, E. -J. Lee, J. -K. Lee, J. -S. Lee, H. -C. Lee, J. -S.
Lim, D. -I. Jang, S. -G. Jeong, G. -C. Jeong, Y. -C.
Cho, Y. -H. Joo, C. -W. Joo, G. -H. Choi, J. -H. Choi, and J. -S. Choi, Technology Development Resolve Axial Offset Anomaly (AOA), Korea Nuclear Fuel Co., Ltd., Report KNFC-007/2006 (2006).
10. H. M. Kwon, Proc. High burn up UO2 nuclear fuel performance Workshop (2004).
11. W. A. Byers, J. Deshon, G. P. Gray, J. F. Small, and J. B. Mcinvale, Proc. Int. Conf. on Water Chemistry of Nuclear Reactor Systems 2006, Paper No. 7-3, Jeju, Korea (2006).
12. J. Chen, AOA studies at Studsvik, Proc. Int. Conf.
Water Chemistry of Nuclear reactor Systems, Jeju, Korea, Korean Atomic Energy Research Institute (in CD) (2006).
13. S. Uchidaa, Y. Asakura, and H. Suzuki, Nucl. Eng. Des., 241, 2398 (2011). https://doi.org/10.1016/ j.nucengdes.
2011.04.009
14. H. Kato, K. H. Heki, S. Komura, and E. Okamura, Ultra Cleaning Method and Device Therefor, US Patent Number 5,467,791 (1995).
15. J. Deshon, Boron-induced Offset Anomaly (BOA) Risk Assessment Tool, Version 3.0, 1021227, EPRI (2010).
16. J. A. Sawicki, J. Nucl. Mater., 374, 248 (2008).
![Fig. 2a presents the simulated CRUD by J. Denshon [15] that was analyzed using a secondary ion mass](https://thumb-ap.123doks.com/thumbv2/123dokinfo/5403474.217992/3.892.224.681.828.1048/fig-presents-simulated-crud-denshon-analyzed-using-secondary.webp)