ABSTRACT
Purpose: High intake of cholesterol leads to cardiovascular disruption. Estimating the actual intake of cholesterol can be beneficial for nutrition intervention. This research aimed to develop Semi-Quantitative Food Frequency Questionnaire (SQ-FFQ) to estimate cholesterol intake and analyze its reliability and validity.
Methods: SQ-FFQ was developed by sorting high cholesterol food items in Indonesian food database and food items' availability. A total of 30 older adults were randomly chosen from Public Health Center in Jagir District, Surabaya, Indonesia to test its validity. Reliability test was done by measuring the same developed SQ-FFQ in one-month period, while validity test was done by comparing SQ-FFQ results with 6-days food record. Statistical analysis used for reliability test was paired t-test, the Intra-class Correlation Coefficient (ICC), and Cronbach's α to measure the internal consistency. Meanwhile, validity of developed SQ-FFQ was analyzed using paired t-test and Bland-Altman.
Results: Reliability of 2 administered SQ-FFQs showed a good agreement based on paired t-test analysis (p = 0.200), ICC (0.609), and Cronbach's α (0.757). Strong agreement was found in most of food items, but agreements for egg yolk and fried duck were poor.
Significant difference was found between those food items (p = 0.001 vs. p < 0.001, respectively) with mean difference were −25.3 mg and 46.2 mg. Validity of developed SQ- FFQ2 compared to 6-days food diary records also found a strong agreement based on paired t-test and the Bland-Altman analysis.
Conclusion: This baseline research provides a reasonably valid and repeatable measure of cholesterol intake estimation that can be widely used in nutrition and public health study, especially in Indonesia. No study has been conducted in Indonesia on the development of tools to estimate the cholesterol intake.
Keywords: cholesterol, elderly, food frequency, hypercholesterol, nutrition assessment
INTRODUCTION
One of the Human Development Index (HDI) indicators is determined by life expectancy.
In 2018, HDI of Indonesia reported to be 0.707, increased from the last decade but lower compared to HDI of China, Philippines, East Asia and the Pacific [1]. This increase can be associated with the increase in life expectancy which is in line with the increase in the elderly
Research Article
Received: Mar 9, 2020 Revised: Nov 11, 2020 Accepted: Feb 8, 2021 Correspondence to Qonita Rachmah
Department of Nutrition, Faculty of Public Health, Universitas Airlangga, Fakultas Kesehatan Masyarakat, Kampus C, Mulyorejo, Kec. Mulyorejo, Surabaya 60115, Indonesia.
Tel: +62-31-5964808
E-mail: [email protected]
© 2021 The Korean Nutrition Society This is an Open Access article distributed under the terms of the Creative Commons Attribution Non-Commercial License (http://
creativecommons.org/licenses/by-nc/3.0/) which permits unrestricted non-commercial use, distribution, and reproduction in any medium, provided the original work is properly cited.
ORCID iDs Triska Susila Nindya
https://orcid.org/0000-0003-0870-5630 Trias Mahmudiono
https://orcid.org/0000-0002-3128-2173 Qonita Rachmah
https://orcid.org/0000-0002-6094-4885 Funding
This research was supported by grants from Faculty of Public Health, Universitas Airlangga, Indonesia (Grant No. 91/UN3.1.10/2017).
Conflict of Interest
There are no financial or other issues that might lead to conflict of interest.
Triska Susila Nindya 1,2, Trias Mahmudiono 1,2, and Qonita Rachmah 1,2
1Department of Nutrition, Faculty of Public Health, Universitas Airlangga, Surabaya 60115, Indonesia
2Center for Health and Nutrition Education, Counselling, and Empowerment, Surabaya 60115, Indonesia
The estimation of cholesterol intake
in elderly: reliability and validity
of short, Semi-Quantitative Food
Frequency Questionnaire (SQ-FFQ)
population. In Indonesia, there is an increase in the percentage of the elderly population in the last 20 years from 1994 to 2017 seen from the population pyramid [2]. To date, total population of older adult in Indonesia reached 19,000 people (8% of total population) and predicted to increase twice in the next 10 years [3]. Elderly is an age group sensitive to nutrition because of changes in nutritional needs due to a decrease in metabolic function. An increase in the elderly population can be associated with an increase in the prevalence of diet-related chronic diseases, such as heart disease to stroke. World Health Organization reported 4 out of 10 deaths in the elderly caused by cardiovascular disease [4]. In Indonesia, the same epidemiological trend was seen where an increase in the prevalence of degenerative diseases began to be seen, for example in stroke from 8.3 per 1,000 in 2007 to 12.1 per 1,000 in 2013 [5].
One of the causes of heart disease and stroke is the condition of hypercholesterolemia [6]. Hypercholesterolemia is a metabolic disorder characterized by an increase in blood cholesterol levels more than 200 mg/dL [7]. This condition is often not realized by most elderly people without regular blood tests, whereas, hypercholesterolemia can cause narrowing of blood vessels [8]. Basically, human body naturally produce cholesterol for 60%–75% and 25%–45% accounted from dietary cholesterol [9]. However, excessive consumption of cholesterol and fat can cause cholesterol accumulation in the blood [8,10].
Further studies proved that the condition of hypercholesterolemia can also cause an increase in systolic blood pressure [11,12]. La Torre et al. [13] in a case control study even found that hypercholesterolemia was proven to be an independent and significant factor in the occurrence of pancreatic cancer. The prevalence of hypercholesterolemia in Indonesia tends to be increased every year. A study in Bandung among 132 elders aged > 55 years showed that the prevalence of hypercholesterolemia (> 200 mg/dL) in urban areas was at 26.7%
and 13.6% in rural areas [14]. Another study in Padang, West Sumatra, Indonesia found the prevalence of hypercholesterolemia (> 240 mg/dL) reached 56.1% among elders aged 55–85 years old [15], while studies at the Public Health Center (Puskesmas) of North Solo found the prevalence of hypercholesterolemia in the elderly up to 77.3% [16].
Based on our preliminary study, it was found that hypercholesterolemia is number 1 disease among the elderly group. One possible cause is the consumption of high cholesterol foods [8,10]. Assessments for estimating cholesterol intake tend to be less easy and less visible only by conducting 24 hours food recall in one day, especially if the interviews are conducted when the individuals do not consume high cholesterol foods. A study explained that at least a food record for 3 days can be done as an assessment of food consumption but the method is often not feasible to do, especially in the elderly group, because that method need a good respondent's literacy [7]. The Semi-Quantitative Food Frequency Questionnaire (SQ-FFQ) validity study compared to the 12 × food record in the Mediterranean elderly population in Spain found good validity in cholesterol intake (Intra-class Correlation Coefficient [ICC] = 0.74), with over-estimation of SQ-FFQ compared to food records [17].
Jackson et al. [18] also validated Food Frequency Questionnaire (FFQ) compared to 12 × 24-hours food recall and biomedical marker, as well as serum cholesterol. The results of the study demonstrated results that were not significantly different from cholesterol intake by using FFQ with food recall and the analytical results showed moderate validity (Kw = 0.43), whereas compared to serum cholesterol, FFQ also showed good accuracy (0.24). The accuracy of estimation of cholesterol intake is important especially in understanding the level of intake among hypercholesterolemic individual. This depends on the diet measurement instrument used. The estimation method for intake of FFQ is mostly carried out for the
assessment of consumption of certain foods in long term, especially in the exposure factor of degenerative diseases (epidemiological study). The use of FFQ is also useful in diet assessment because other methods such as food recall or records cannot describe past intake and are generally more expensive [19]. In Indonesia alone, there is no specific instrument for estimating cholesterol intake. For this reason, developing an instrument or tool that can easily measure patterns and the amount of cholesterol consumption in a certain period of time is very necessary to determine the level of individual cholesterol consumption and support diet therapy given especially to the elderly with hypercholesterolemia condition.
METHODS
Study design and sampling
This research was a descriptive study using cross sectional study design. It was done in Jagir Public Health Center working area, Surabaya City, Indonesia. The population was all elderly with history of hypercholesterolemia (total cholesterol > 200 mg/dL). Elderly is defined as people aged ≥ 60 years based on national health board policy (No. 25 of 2015). Then, sample was selected using simple random sampling technique which was previously screened by inclusion and exclusion criteria. The inclusion criteria include elderly who have at least one caretaker (family or non-family). Meanwhile, the exclusion criteria include elderly who previously diagnosed by physician of having other diseases that needs special diet (i.e., kidney disease, diabetes, liver disease, etc.).
Based on the results of the literature review, a sample of 30 people was sufficiently used in conducting validation study [19]. Therefore, in this study, 30 elderly people were taken as subjects with an additional of 20% to anticipate a high dropout rate because the research was conducted in a relatively long time so that a total of 36 elderly people was used as the research samples.
Development process of SQ-FFQ
This study conducted in 2 phases; first phase focusing on the development of SQ-FFQ tool and the second phase objected the reliability and validity of the questionnaire. To develop the SQ-FFQ to estimate cholesterol intake, we collected several food items that contain high cholesterol based on Indonesian Food Composition Database, then sorted it out using survey of food availability. We eliminated the food item that was not available around the study site.
Hereafter, pre-test was conducted to test the first developed SQ-FFQ. If the intake of one or more food items was zero (0), the food item(s) was deleted. The result of developed SQ-FFQ is shown in the result section.
In the first phase, the development of SQ-FFQ was done using 3 different approaches in collecting cholesterol-rich foods, first, by analyzing the cholesterol content in the Indonesian Food Composition Database, observing the availability of high cholesterol foods in the study site, and a preliminary study on 10 elderly with hypercholesterolemia condition to get an idea of their habit regarding the cholesterol-rich foods consumption. After SQ-FFQ was developed, the initial pre-test was carried out as a screening of which types of food were consumed more frequently and which never consumed in order to modify the initial SQ-FFQ and get an accurate picture of the type of high cholesterol food list. After the pre-test, we deleted food items that have never been consumed by the respondents. Then, results of the SQ-FFQ pre-test were tested for its validity and reliability.
In the second phase, a validation study was conducted on 30 selected elderly people.
Validation was done by comparing developed SQ-FFQ with 6-days food diary records. Food diary record was one type of methods of measuring food intake where the subject or caregiver wrote down the type and amount of food consumed in one day because older adults might have impaired cognitive function that interfere food record administration. Food records are considered the gold standard in food intake assessment, especially the type of weighted food record [19]. This method is also recommended because it does not require memory so it can minimize errors. Each elderly person was provided a food diary book to write down all food consumed. In addition to food diary books, respondents were given food photographed book that can help them estimate the amount of food consumed. The researcher also reminded respondents to write down the food consumed through short text messages (SMS). The second phase of validation study took approximately 4 weeks to be finished. In the first week, first SQ-FFQ was administered, followed by the administration of 3-days food diary in the upcoming weeks and another 3-days food records in the third week. In the fourth week, second SQ-FFQ was done to check reliability of developed SQ-FFQ. The scheme below illustrates the process of validity studies (Fig. 1).
Assessment of blood cholesterol level
Blood cholesterol level was assessed by direct method (homogenous assay). Respondents were asked to fast for 12 hours before the blood collection. The blood was taken from vena, done by medical analyst. Then, analysis was performed by Prodia Laboratory (Indonesia).
Data analysis
To analyze the result, Shapiro-wilk test was performed to check the normality of the data.
Descriptive data analyses included: age, weekly expense, cholesterol level, gender, medical history, education level, and number of family members. Test-retest reliability of the
developed SQ-FFQ was tested using paired t-test to determine the level of intake difference of 2 SQ-FFQs with significance level < 0.5. Furthermore, the ICC test was also conducted for the analysis of the level of agreement between 2 SQ-FFQ repetitions, in which ICC values < 0.40 indicating “poor reliability”, 0.40–0.76 indicating “good reliability” and > 0.76 indicating
“excellent reliability” [20]. Internal consistency reliability was tested using Cronbach α, in which α <0.50 indicating poor reliability, α = 0.50–0.70 indicating moderate reliability, and α
= 0.70–0.90 indicating good reliability [21]. Validity test was used to analyze the differences in estimated cholesterol collected using SQ-FFQ and food diary records. The statistical paired t-test was used to determine the level of difference in intake of SQ-FFQ2 and food diary records. Significance level of 0.05 was used to interpret the findings. The accuracy of SQ- FFQ in estimating cholesterol intake was analyzed using Bland-Altman test to measure the aggregate strength and relative validity between SQ-FFQ and food diary records [22].
This study was ethically approved by the Health Research Ethics Committee, Faculty of Public Health, Universitas Airlangga (Institutional Review Board [IRB] number: 372-KEPK).
Informed consent was obtained from all participants before the study conducted.
3-days food records 3-days food records SQ-FFQ2 SQ-FFQ1
2nd week 3rd week 4th week
1st week
Fig. 1. Validity test process. Process of SQ-FFQ reliability and validity study. For reliability test, first administered was assessed in 1st week the followed 2nd SQ-FFQ in the 4th week. During one-month period, 6-days food diary record was done and used as a tool to validate the developed SQ-FFQ.
SQ-FFQ, Semi-Quantitative Food Frequency Questionnaire.
RESULTS
Development of SQ-FFQ to estimate cholesterol intake
Development of SQ-FFQ to estimate cholesterol intake was done using 2 different approaches. First, we compiled 30 food items that high in cholesterol level based on Indonesian food database and related research. Second, we assessed the availability of food items around the study area and eliminated foods that were not available. Twenty-six food items were compiled from the second phase. At the end, 25 food items were collected to measure the cholesterol intake. List of food items added in SQ-FFQ questionnaire is presented in Table 1.
Baseline characteristics
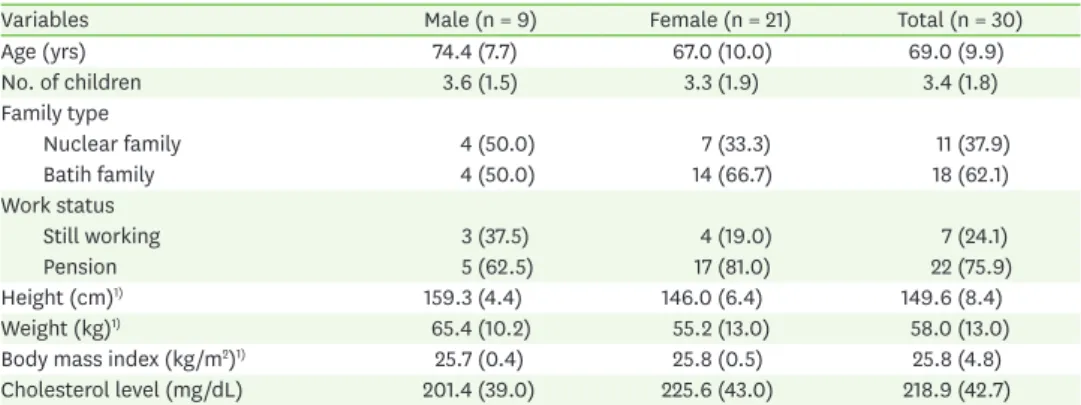
Table 2 presents characteristic of the subjects. The mean of subject's age was 69.0 years and the mean number of children was 3.4. Of these, 62.1% were the extended family meaning that most of the elderlies were still living with their children-in-law and grandchildren. In addition, most of the older adults were retired (75.9%), only 24.1% that still independently working. Age, number of children, family type, and working status were not significantly different between male and female subjects. However, height and weight were significantly higher in male subjects while body mass index was significantly higher in female subjects.
Blood cholesterol level was higher in female elderlies (225.6 mg/dL) compared to male elderlies (201.4 mg/dL) but not statistically different.
Table 1. List of food items in developed SQ-FFQ
No. Food item No. Food item
1 Egg yolk 14 Cow's milk (UHT)
2 Chicken liver 15 Squid
3 Chicken gizzard 16 Shrimp
4 Chicken lymph 17 Quail eggs
5 Chicken heart 18 Ote-ote (shredded vegetables fritter)
6 Chicken skin 19 Tahu isi (fried filled tofu)
7 Butter/shortening 20 Tempe menjes (fried tempeh)
8 Cow lungs 21 Fried duck
9 Beef tripe 22 Fried tofu
10 Gravel 23 Fried tempe
11 Meatball 24 Fried animal protein
12 Lamb 25 Fried vegetables
13 White clam
SQ-FFQ, Semi-Quantitative Food Frequency Questionnaire; UHT, ultra-high temperature.
Table 2. Baseline characteristics of subjects
Variables Male (n = 9) Female (n = 21) Total (n = 30)
Age (yrs) 74.4 (7.7) 67.0 (10.0) 69.0 (9.9)
No. of children 3.6 (1.5) 3.3 (1.9) 3.4 (1.8)
Family type
Nuclear family 4 (50.0) 7 (33.3) 11 (37.9)
Batih family 4 (50.0) 14 (66.7) 18 (62.1)
Work status
Still working 3 (37.5) 4 (19.0) 7 (24.1)
Pension 5 (62.5) 17 (81.0) 22 (75.9)
Height (cm)1) 159.3 (4.4) 146.0 (6.4) 149.6 (8.4)
Weight (kg)1) 65.4 (10.2) 55.2 (13.0) 58.0 (13.0)
Body mass index (kg/m2)1) 25.7 (0.4) 25.8 (0.5) 25.8 (4.8)
Cholesterol level (mg/dL) 201.4 (39.0) 225.6 (43.0) 218.9 (42.7)
Values are presented as mean (standard deviation) for continuous variables and number of subjects (%) for categorical variables.
1)Statistically significant at p-value < 0.05.
Reliability
Reliability of the developed SQ-FFQ was assessed using several statistical analyses namely paired t-test, ICC and Cronbach's α. Paired t-test analysis (Table 3) showed that there was no significant difference between first and second administered SQ-FFQ, the mean daily intake of cholesterol at first SQ-FFQ was 150.5 mg and 135.2 mg at the second SQ-FFQ. These results indicated that the developed SQ-FFQ has a good reliability.
Strength of agreement between 2 administered SQ-FFQ using ICC (Table 4) showed the result of 0.609 meaning that our developed SQ-FFQ showed a good reliability, in other words, the level of agreement between 2 administration was good. The Cronbach's α analysis scored 0.757, which indicate the good internal consistency between 2 administered SQ-FFQs (Table 4). Based on further ICC analysis of test-retest reliability, strength agreement was found in most of food items, but agreement for egg yolk and fried duck were poor. Significant difference was found between those food items (p = 0.001 vs. p < 0.001, respectively) with mean difference was −25.3 mg and 46.2 mg.
Validity
We measured the validity of our questionnaire using paired t-test and the Bland-Altman analysis. Paired t-test resulting in p-value of 0.162 indicates that there was no significant difference of cholesterol intake assessment using our developed SQ-FFQ and 6 days food diary records (Table 5). The Bland-Altman analysis was done to identify strength of agreement between cholesterol intakes derived from SQ-FFQ2 and the repeated food diary records. The result showed that cholesterol intake assessed using repeated food diary records has higher estimation than SQ-FFQ2. Good agreement was found in estimated mean cholesterol intake (p = 0.928) (Table 6).
Table 3. Reliability of developed SQ-FFQ using paired t-test1)
Variable SQ-FFQ1 (n = 29) SQ-FFQ2 (n = 29) p-value
Cholesterol 150.5 ± 130.5 135.2 ± 127.6 0.200
Values are presented as mean ± SD.
SQ-FFQ, Semi-Quantitative Food Frequency Questionnaire.
1)Statistically significant at p-value < 0.05 using paired t-test.
Table 4. Strength of agreement and internal consistency between mean daily cholesterol intakes derived from SQ-FFQ1 and SQ-FFQ2
Variable ICC Cronbach's α
Daily cholesterol intakes 0.609 0.757
ICC, Intra-class Correlation Coefficient; SQ-FFQ, Semi-Quantitative Food Frequency Questionnaire.
Table 5. Validity of developed SQ-FFQ using paired t-test
Variable SQ-FFQ2 (n = 29) 6D FDR (n = 29) p-value1)
Cholesterol 135.2 ± 127.6 137.6 ± 53.4 0.162
Values are presented as mean ± SD.
SQ-FFQ, Semi-Quantitative Food Frequency Questionnaire; 6D FDR, 6 days false discovery rate.
1)Statistically significant at p-value < 0.05 using paired t-test.
Table 6. Strength of agreement using the Bland-Altman method between cholesterol intakes derived from SQ-FFQ2 and the food diary record
Variable Mean ± SD1) Limit of agreement p-value
Lower Upper
Cholesterol 2.44 ± 121.8 −52.9 57.9 0.928
SQ-FFQ, Semi-Quantitative Food Frequency Questionnaire.
1)Mean difference of cholesterol intake (food diary record − SQ-FFQ2).
DISCUSSION
Based on several statistical analysis, our study success in revealing a good reliability and validity of developed SQ-FFQ to estimate daily cholesterol intake among elderly. National Cholesterol Education Program (NCEP) Expert Panel on Detection, Evaluation, and
Treatment of High Blood Cholesterol in Adults categorizes plasma cholesterol level 200–239 mg/dL included as borderline high and ≥ 240 mg/dL defines as high [23]. This health problem can be treated by eliminating several high cholesterol food items [24]. Otherwise, long exposure of hypercholesterolemia can lead to heart disease and stroke [6]. Our study aimed to evaluate the test-retest reliability and the validity of SQ-FFQ. Our present study evaluated the reliability and validity of SQ-FFQ to estimate the cholesterol intake of the elderly. In the future, this tool can be used as a short tool to understand patients' cholesterol intake and evaluate their diet.
Testing the test-retest reliability of the developed questionnaire is important to detect whether the same measurement taken in different time could give the similar results.
The repeatability of the cholesterol SQ-FFQ was fair in major foods tested. Chicken liver, chicken gizzard, chicken lymph, chicken heart, chicken skin, cow lungs, beef tripe, gravel, meatball, lamb, white clam, cow's milk (ultra-high temperature), squid, shrimp, quail eggs, ote-ote (shredded vegetables fritter), tahu isi (fried filled tofu), tempe menjes, fried tofu, fried tempeh, fried animal protein (fried chicken, fried beef, fried egg), and fried vegetables showed a good repeatability with ICC between 0.4–0.75 and butter/shortening showed an excellent repeatability (ICC > 0.75). However, egg yolk and fried duck showed a poor repeatability with ICC < 0.4. This result was explainable because we hypothesize that older adults in our study previously known that egg yolk and fried duck should be avoided. The 2 repeated SQ-FFQ was done 4-weeks apart, during first to fourth week, the respondents might sometimes still consume those foods, resulting low consistency in the analysis.
One important factor that could affect repeatability of developed SQ-FFQ was the test-retest interval between the 2 administered SQ-FFQ. Shorter interval between 2 of those may cause the respondent to memorize their intake then it can lead to overestimation of the intake because of memory bias. On the other hand, if the interval is too long, the dietary pattern may have actually changed, which can lead to an underestimation of reproducibility [24].
Based on a comprehensive review, the time interval in published reports ranges from 2 hours to 15 years for test-retest reliability [25]. Our results showed that the first SQ-FFQ showed a higher cholesterol intake compared to the second one but it was not different statistically.
This can indicate that one-month test-retest of SQ-FFQ cholesterol is suitable.
To measure our developed SQ-FFQ validity, we used second SQ-FFQ instead of the first administered SQ-FFQ because the former covers the same time period (i.e., previous month) as the 6 days false discovery rate (FDR) used as the reference for the first-time usage. Our SQ-FFQ tended to report lower cholesterol intake than the diary records, which indicates that the former method may underestimate cholesterol intake to some degree. On the other hand, this may just be reflecting that the diary record overestimates the cholesterol intake.
The Bland-Altman plot showed the relationship between difference in the daily intake of cholesterol estimated with the second FFQ (SQ-FFQ2) and 6 days dietary records (FDR), and mean daily intake estimated by the 2 methods. Mean intake of cholesterol was found to be higher while estimation using 6-days food diary record compared to estimation using SQ- FFQ2. However, the difference was not significantly different (p > 0.05) and the SQ-FFQ2 still
showed a good agreement to estimate the daily cholesterol intake. Different from our result, study among Mediterranean elderly confirmed a general overestimation of the consumption of food groups and of nutrient intake by the SQ-FFQ compared to 12 days food records [17].
To our knowledge, there was no previous study published aimed to develop and validate dietary assessment method SQ-FFQ to estimate daily cholesterol intake so that the novelty can be guaranteed. A major strength of this study is that the SQ-FFQ developed for elderly using a visualized portion size of foods which ease the elderly to estimate and answer their intake, also allowing them to point a finger at a particular portion size when asked to estimate consumption of a food. However, several limitations were also pointed out.
First, the sample size was quite small and study done in Surabaya city only, which might not applicable for other cities in Indonesia. A further study in other cities would be needed to validate our developed SQ-FFQ. Another limitation noted is that the SQ-FFQ sources of error such as being reliant on subjects' memory, and may be biased due to underestimation or overestimation should also take into account [26].
SUMMARY
Our developed Semi-Quantitative Food Frequency Questionnaire (SQ-FFQ) for assessing cholesterol intake proves to have good reliability and validity and can be used as a useful instrument. However, its validity can be improved by eliminating food items which was scarcely consumed. Further study to validate this SQ-FFQ to different age group population by using biochemical indicator (total cholesterol, triglyceride, high density lipoprotein and low density lipoprotein level) can be done for a better understanding.
REFERENCES
1. United Nations Development Programme. Human development report 2019. The next frontier: human development and the anthropocene. Briefing note for countries on the 2020 human development report [Internet]. New York (NY): United Nations Development Programme; 2019 [cited 2019 Feb 15]. Available from: http://hdr.undp.org/sites/all/themes/hdr_theme/country-notes/IDN.pdf.
2. Ministry of Health of Indonesia. Indonesia health profile. Jakarta: Ministry of Health of Indonesia; 2017.
3. The Central Bureau of Statistics. Statistic of elderly population 2019 [Internet]. Jakarta: The Central Bureau of Statistics; 2019 [cited 2019 Feb 15]. Available from: https://www.bps.go.id/
publication/2019/12/20/ab17e75dbe630e05110ae53b/statistik-penduduk-lanjut-usia-2019.html.
4. World Health Organization. Global status report on non-communicable diseases 2010. Geneva: World Health Organization; 2011.
5. Ministry of Health of Indonesia. Basic health research report 2013. Jakarta: Ministry of Health of Indonesia; 2014.
6. Sorganvi V, Kulkarni MS, Kadeli D, Atharga S. Risk factors for stroke: a case control study. Int J Curr Res Rev 2014; 6(3): 46-52.
7. Stang J, Story M. Guidelines for adolescent nutrition services. Minneapolis (MN): Center for Leadership, Education, and Training in Maternal and Child Nutrition; 2005.
8. Almatsier S. The basic principles of nutrition. Jakarta: PT Gramedia Pustaka Utama; 2011.
9. García-Llatas G, Rodríguez-Estrada MT. Current and new insights on phytosterol oxides in plant sterol- enriched food. Chem Phys Lipids 2011; 164(6): 607-624.
PUBMED | CROSSREF
10. Iriani F. Factors related to hypercholesterolemia on elderly [dissertation]. Semarang: Universitas Diponegoro; 2005.
11. Sakurai M, Stamler J, Miura K, Brown IJ, Nakagawa H, Elliott P, et al. Relationship of dietary cholesterol to blood pressure: the INTERMAP study. J Hypertens 2011; 29(2): 222-228.
PUBMED | CROSSREF
12. Sposito AC. Emerging insights into hypertension and dyslipidaemia synergies. Eur Heart J Suppl 2004; 6:
G8-G12.
CROSSREF
13. La Torre G, Sferrazza A, Gualano MR, de Waure C, Clemente G, De Rose AM, et al. Investigating the synergistic interaction of diabetes, tobacco smoking, alcohol consumption, and hypercholesterolemia on the risk of pancreatic cancer: a case-control study in Italy. BioMed Res Int 2014; 2014: 481019.
PUBMED | CROSSREF
14. Ellya RD, Sijani P, Utju R, Edhiwan P. Dyslipidemia among the elderly in Lembang Bandung. Kesmas Natl Public Health J 2001; 1(1): 39-53.
15. Kamso S. Dyslipidemia and central obesity among the elderly in the city of Padang. Kesmas Natl Public Health J 2007; 2(2): 73-7.
16. Sukma Dewandaru E. Relationship between total fat, cholesterol intake and blood cholesterol level in elderly in Aisyiyah integrated health service of Surakarta [dissertation]. Surakarta: Universitas Muhammadiyah Surakarta; 2015.
17. Fernández-Ballart JD, Piñol JL, Zazpe I, Corella D, Carrasco P, Toledo E, et al. Relative validity of a semi- quantitative food-frequency questionnaire in an elderly Mediterranean population of Spain. Br J Nutr 2010; 103(12): 1808-1816.
PUBMED | CROSSREF
18. Jackson MD, Walker SP, Younger NM, Bennett FI. Use of a food frequency questionnaire to assess diets of Jamaican adults: validation and correlation with biomarkers. Nutr J 2011; 10(1): 28.
PUBMED | CROSSREF
19. Willet W. Nutritional epidemiology. 2nd ed. New York (NY): Oxford University Press; 1998.
20. Fleiss JL. Design and analysis of clinical experiments: Hoboken (NJ): John Wiley & Sons; 2011.
21. Bruin J. Newtest: command to compute new test [Internet]. Los Angeles (CA): UCLA Statistical Consulting Group; 2006 [cited 2018 Aug 15]. Available from: http://www.ats.ucla.edu/stat/stata/ado/analysis/.
22. Allan C, Abdul Kader UH, Ang JY, Muhardi L, Nambiar S. Relative validity of a semi-quantitative food frequency questionnaire for Singaporean toddlers aged 15–36 months. BMC Nutr 2018; 4(1): 42.
PUBMED | CROSSREF
23. Expert Panel on Detection, Evaluation, and Treatment of High Blood Cholesterol in Adults. Executive summary of the third report of The National Cholesterol Education Program (NCEP) Expert Panel on Detection, Evaluation, and Treatment of High Blood Cholesterol in Adults (Adult Treatment Panel III).
JAMA 2001; 285(19): 2486-2497.
PUBMED | CROSSREF
24. Kelly RB. Diet and exercise in the management of hyperlipidemia. Am Fam Physician 2010; 81(9): 1097-1102.
PUBMED
25. Tsubono Y, Nishino Y, Fukao A, Hisamichi S, Tsugane S. Temporal change in the reproducibility of a self- administered food frequency questionnaire. Am J Epidemiol 1995; 142(11): 1231-1235.
PUBMED | CROSSREF
26. Horiuchi Y, Kusama K, Sar K, Yoshiike N. Development and validation of a food frequency questionnaire (FFQ) for assessing dietary macronutrients and calcium intake in Cambodian school-aged children. Nutr J 2019; 18(1): 11.
PUBMED | CROSSREF