J Korean Surg Soc 2012;83:69-74
http://dx.doi.org/10.4174/jkss.2012.83.2.69
ORIGINAL ARTICLE
Journal of the Korean Surgical Society
JKSS
pISSN 2233-7903ㆍeISSN 2093-0488
Received October 4, 2011, Revised April 15, 2012, Accepted April 22, 2012 Correspondence to: Oh Jung Kwon
Department of Surgery, Hanyang University Seoul Hospital, Hanyang University College of Medicine, 222 Wangsimni-ro, Seongdong-gu, Seoul 133-791, Korea
Tel: +82-2-2290-8444, Fax: +82-2-2281-0224, E-mail: [email protected]
cc Journal of the Korean Surgical Society is an Open Access Journal. All articles are distributed under the terms of the Creative Commons Attribution Non-Commercial License (http://creativecommons.org/licenses/by-nc/3.0/) which permits unrestricted non-commercial use, distribution, and reproduction in any medium, provided the original work is properly cited.
Comparison of serum cystatin C and creatinine as a marker for early detection of decreasing glomerular filtration rate in renal transplants
Young Jae Jung, Hyang Ran Lee, Oh Jung Kwon
Department of Surgery, Hanyang University College of Medicine, Seoul, Korea
Purpose: We wished to compare the clinical effectiveness of cystatin C (CyC) and serum creatinine (sCr) to assess renal func- tion in renal transplantation patients. Methods: We compared the clinical effectiveness of CyC with that of the sCr to estimate 24-hour urine creatinine clearance (CrCl) in 72 adult recipients who underwent renal transplantation from January 2001 to December 2008. We analyzed the data in terms of accuracy, bias, precision and sensitivity as a function of length of time post- transplantation and CrCl value. Results: The patients were divided into four groups according to CrCl value <30, <60, <90, and ≥90 mL/min/1.73 m2. The corresponding Cr-based glomerular filtration rate (GFR) estimates had accuracies of 0.71, 0.906, 0.963, and 1.00 within 50% of the reference, with biases (mean percentage errors) of 4.7, 5.32, -5.79, -31.33 mL/min/1.73 m2, and precisions (mean absolute percentage errors) of 7.57, 10.03, 14.52, and 31.33 mL/min/1.73 m2, respectively. The CyC-based GFR estimates had accuracies of 0.35, 0.79, 0.93, and 0.67 within 50% of the reference, respectively, with biases of 15.03, 13.37, -5.58, and -34.79 mL/min/1.73 m2 and precisions of 15.03, 14.80, 17.91, and 34.79 mL/min/1.73 m2. The sensitivity for detecting GFR below 60 mL/min/1.73 m2 was higher for CyC (0.96, 1, and 0.95) than for Cr (0.77, 0.75, and 0.82).
Conclusion: CyC is a more sensitive indicator of low GFR (CrCl <60 mL/min/1.73 m2) than sCr. However, CyC-based GFR estimates are restrictive data, and are neither accurate nor specific. Therefore, to evaluate renal function, we may need a re- vised CyC-based GFR formula and close monitoring of sCr.
Key Words: Kidney transplantation, Creatinine, Cystatin C
INTRODUCTION
Kidney transplantation is the treatment of choice for end stage renal disease, because it improves quality of life, and is more cost-effective than dialysis [1]. Recently, with the development of many new immunosuppressive regi- mens, the incidence of acute rejection after renal trans-
plantation has declined considerably. However, the rate of chronic rejection has not decreased. It is hard to prevent early graft loss, because one cannot detect defective renal function until serum creatinine (sCr) has risen above base- line [1]. Assessment of renal function is a fundamental as- pect of the management of kidney transplant recipients, as well as essential for evaluating living kidney donors.
The most common surrogate of glomerular filtration rate (GFR) is the sCr concentration. However, sCr level has many limitations for evaluating renal function because it is affected by many factors, such as muscle mass and turn- over rate, sex, diet, race, liver function, and medications.
Furthermore, it yields an inaccurate estimate of GFR be- cause of the effect of tubular secretion, and reabsorption of creatinine, and non-renal factors [1].
Cystatin C (CyC) has been used in clinical research studies for more than 20 years and serum CyC (sCyC) has been introduced into clinical practice as an endogenous marker of GFR [2,3]. However it is not always a reliable marker of renal function, as its synthesis is increased in smokers, patients with hyperthyroidism, and those on glucocorticoid therapy [4]. Nevertheless, according to a re- cent meta-analysis data and many other studies, CyC may be superior to sCr for detecting of mild impairment of re- nal function [4-8].
We therefore conducted this study to compare the clin- ical effectiveness of CyC and sCr for early detection of im- paired renal function in renal transplantation patients.
METHODS
Seventy-two adult renal transplant recipients who were operated on and could be followed in our transplantation center were enrolled from 2001 to 2008. The data was col- lected prospectively and analyzed retrospectively by medical record review. 24-hour urine Cr clearances (CrCl) was measured on preoperation day 1, postoperation day 2, and after 1, and 4 weeks. Blood samples for measurement of sCr were collected on preoperation day 1 and everyday for 2 weeks, and those for measurement of CyC were col- lected on preoperation day 1, postoperation days 4, and 7, after 2 weeks. After discharge, blood samples and urine samples were checked at monthly, six monthly and yearly intervals. Measurement of CyC started in Hanyang University Hospital from 2005.
sCr was determined with Jaffé’s colorimetric method, and CyC with a particle enhanced immunonephelometric immunoassay. The upper reference limits prescribed are 1.2 mg/dL for sCr, 0.94 mg/L for CyC [9].
CrCl was assessed using the 24-hour urine formula:
CrCl = urine creatinine (uCr) × urine volume (UV) / sCr Cr-based GFR was estimated from the Modification of Diet in Renal Disease II (MDRD II) equation:
GFR estimates (mL/min/1.73 m2) = 186 × (Cr)-1.154 × (age)-0.203 × 0.742 (if female) × 1.212 (if Afro-American)
CyC-based GFR was estimated from the formula of Thierry Le Bricon:
GFR estimates (mL/min/1.73 m2) = 78 × (1/CyC) + 4
Statistics
Data were analyzed with SPSS ver. 13.0 (SPSS Inc., Chicago, IL, USA). Mean values, ranges and standard de- viations were calculated and correlation coefficients, accu- racy within 30% and 50% of reference, bias, precision, sen- sitivity and specificity for detecting GFR below 60 mL/
min/1.73 m2, were compared.
Then, a sub analysis was performed after stratifying pa- tients according to posttransplantation period (within one month, from one month to one year, and after one year) and CrCl level (<30, <60, <90, ≥90 mL/min/1.73 m2).
Pearson’s correlation coefficient was used to define the correlation between 24-hour urine CrCl, the reciprocal of sCr and CyC. Spearman’s rank correlation coefficient was used for defining the correlation between 24-hour urine CrCl, sCr, and CyC. Regression levels and coefficient were analyzed by linear regression plot. Accuracy was defined as the percentage of Cr-based GFR and CyC-based GFR, lying within 30 and 50% of the 24-hour urine CrCl value.
Bias was defined as the estimated value (Cr-based GFR or CyC-based GFR) minus the true value (24-hour urine CrCl) and precision was defined as the absolute value of the bias. Values of P < 0.05 were considered statistically significant.
RESULTS
A total of 72 renal transplant patients were enrolled in this study. There were 33 (46%) females and 39 (54%) males. The age of patients ranged from 17 to 60 years (median, 44 years). The baseline characteristics of the pa- tients are presented in Table 1.
Table 1. Patient characteristics
Characteristic Value
Age (yr) 44 (17-60)
Sex
Male 39 (54.0)
Female 33 (46.0)
Height (cm) 161.2 (149-181.4)
Weight (kg) 58.2 (44.8-90.4)
Donor
Living donor 63 (87.5)
Deceased donor 9 (12.5)
No. of transplantation
Primary transplantation 67 (93.0) Secondary transplantation 5 (7.0) Cause of renal disease
Glomerulonephritis 11 (15.3)
Hypertension 9 (12.5)
Diabetes 6 (8.3)
Immunoglobulin A nephropathy 2 (2.8) Polycystic kidney disease 1 (1.4)
Others 3 (4.2)
Unknown 40 (55.6)
Rejection
Hyperacute rejection 1 (1.4) Acute rejection 4 (5.6) Chronic rejection 3 (4.2)
Total 72 (100)
Values are presented as median (range) or number (%).
Table 2.Measured and estimated GFR of paired Cr, CyC, and CrCl samples
Range GFRa) Mean ± SD, (median, range) Total 24-hour CrCla) 44.79 ± 21.73 (45.8, 0.9-108.4)
Cr-GFRa) 46.53 ± 21.74 (49.04, 3.36-123.64) Crb): 2.21 ± 1.98 (1.50, 0.70-14.80) CyC-GFRa) 54.21 ± 19.86 (52.75, 15.64-100.30)
CyCc): 1.89 ± 1.04 (1.60, 0.81-6.70) CrCla)< 30 24-hour CrCla) 17.25 ± 8.47 (19.2, 0.9-29.40)
Cr-GFRa) 21.89 ± 14.62 (19.32,3.36-64.32) Crb): 4.39 ± 2.86 (3.40, 1.10-14.80) CyC-GFRa) 34.31 ± 13.22 (31.37, 15.64 -63.54) CyCc): 3.09 ± 1.42 (2.85, 1.31-6.70) CrCla)< 60 24-hour CrCla) 45.13 ± 8.90 (46.2, 29.6-59.40)
Cr-GFRa) 50.55 ± 14.89 (50.21, 13.47-96.13) Crb): 1.55 ± 0.55 (1.40, 0.80-4.00) CyC-GFRa) 57.03 ± 16.64 (52.75, 31.18-96.86)
CyCc): 1.61 ± 0.49 (1.60, 0.84-2.87) CrCla)< 90 24-hour CrCla) 70.22 ± 8.0 (68.5, 60.00-88.80)
Cr-GFRa) 64.32 ± 16.69 (62.37, 29.26-123.64) Crb): 1.27 ± 0.40 (1.20, 0.70-2.80) CyC-GFRa) 65.22 ± 17.39 (63.09, 38.51-100.30)
CyCc): 1.38 ± 0.40 (1.32, 0.81-2.26) CrCla)≥ 90 24-hour CrCla) 95.02 ± 5.48 (93.45, 90.10-108.4)
Cr-GFRa) 66.30 ± 15.24 (60.97, 49.04-89.86) Crb): 1.16 ± 0.19 (1.20, 0.80-1.40) CyC-GFRa) 64.75 ± 23.06 (62.64, 42.81-88.78)
CyCc): 1.42 ± 0.55 (1.33, 0.92-2.01) GFR, glomerular filtration rate; Cr, creatinine; CyC, cystatin C;
CrCl, creatinine clearance.
a)Values are presented as mL/min/1.73 m2, b)mg/dL, c)mg/L.
Table 3.Correlation coefficient with 24-hour urine CrCla) Correlation
coefficient P-value
Crb) -0.709 <0.001
CyCb) -0.659 <0.001
1/Crc) 0.707 <0.001
1/CyCc) 0.567 <0.001
Cr-based GFRc) 0.763 <0.001
CyC-based GFRc) 0.567 <0.001
CrCl, creatinine clearance; Cr, creatinine; CyC, cystatin C; GFR, glomerular filtration rate.
a)Values are presented as mL/min/1.73 m2. b)Spearman’s rank correlation coefficient test. c)Pearson’s correlation coefficient test.
The mean, median, and range of GFR based on the dif- ferent prediction equations are shown in Table 2. The mean 24-hour values of urine CrCl, sCr-based GFR, and sCyC-based GFR in our patients were 44.79 mL/min/1.73 m2, 46.53 mL/min/1.73 m2, and 54.21 mL/min/1.73 m2, respectively.
Statistically significant correlations were found be- tween 24-hour urine CrCl and sCr-based GFR (R = 0.763, P
< 0.0001), the reciprocal of sCr (R = 0.707, P < 0.0001), sCr (R = -0.709, P < 0.0001), sCyC (R = -0.659, P < 0.0001), the reciprocal of sCyC (R = 0.567, P < 0.0001), and sCyC- based GFR (R = 0.567, P < 0.0001), respectively (Table 3).
Linear regression plots yielded the following correla- tions with 24-hour urine CrCl: sCr-based GFR (slope = 0.761, R2 = 0.583, P < 0.001), sCyC-based GFR (slope = 0.638, R2 = 0.322, P < 0.001), reciprocal of sCr (slope = 52.263, R2 = 0.499, P < 0.001), and reciprocal of sCyC (slope
= 49.725, R2 = 0.322, P < 0.001).
Accuracy was defined as the proportion of values that
were within 30% and 50% of the 24-hour urine CrCl. It was estimated after various posttransplant periods, namely
<1 month, 1 month to 1 year, and >1 year, and the sCr-based GFR had accuracies of 0.643, 0.611, and 0.685 within 30% of CrCl respectively, at these times and accu-
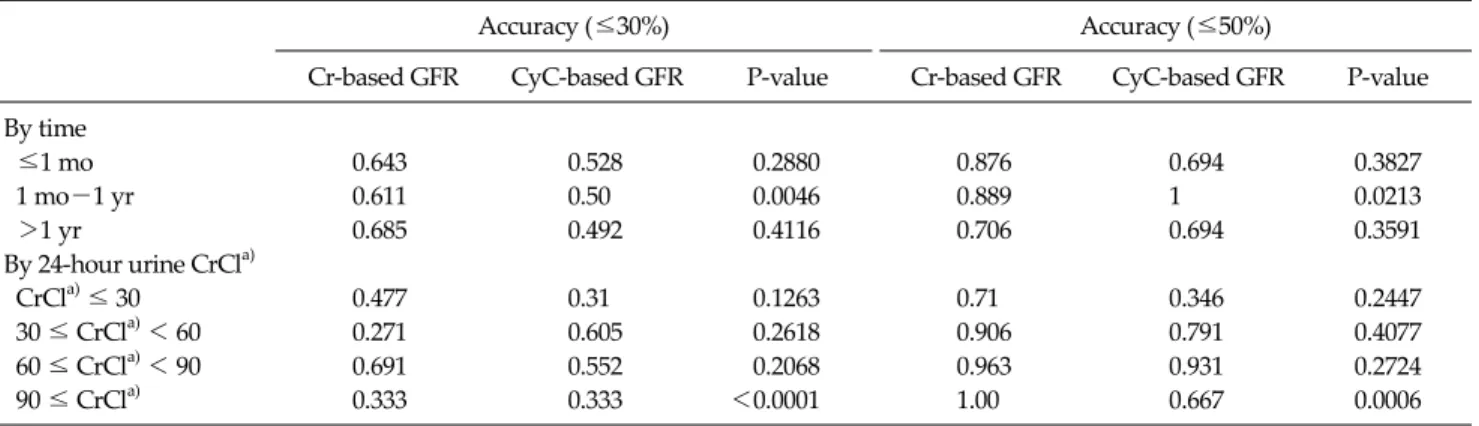
Table 4. Accuracy of Cr-based GFR and CyC-based GFR, within 30% and 50% of 24-hour urine CrCla)
Accuracy (≤30%) Accuracy (≤50%)
Cr-based GFR CyC-based GFR P-value Cr-based GFR CyC-based GFR P-value By time
≤1 mo 0.643 0.528 0.2880 0.876 0.694 0.3827
1 mo-1 yr 0.611 0.50 0.0046 0.889 1 0.0213
>1 yr 0.685 0.492 0.4116 0.706 0.694 0.3591
By 24-hour urine CrCla)
CrCla) ≤ 30 0.477 0.31 0.1263 0.71 0.346 0.2447
30 ≤ CrCla) < 60 0.271 0.605 0.2618 0.906 0.791 0.4077
60 ≤ CrCla) < 90 0.691 0.552 0.2068 0.963 0.931 0.2724
90 ≤ CrCla) 0.333 0.333 <0.0001 1.00 0.667 0.0006
Cr, creatinine; GFR, glomerular filtration rate; CyC, cystatin C; CrCl, creatinine clearance.
a)Values are presented as mL/min/1.73 m2.
racies of 0.876, 0.889, and 0.706 within 50%, respectively at the same times. The sCyC-based GFR values had accu- racies of 0.528, 0.5, and 0.492 within 30% of CrCl, respec- tively, and of 0.694, 1.00, and 0.694 within 50% of CrCl, re- spectively (Table 4).
The accuracies of sCr-based GFR and sCyC-based GFR within 30% or 50% of CrCL were also stratified according to 24-hour urine CrCl <30, <60, <90, ≥90 mL/min per 1.73 m2. The accuracies of the Cr-based GFR within 30%
were 0.477, 0.271, 0.691, and 0.333, respectively, and those within 50% were 0.71, 0.906, 0.963 and 1.00, respectively.
Accuracies of CyC-based GFR within 30% were 0.31, 0.605, 0.552, and 0.333 respectively, and those within 50% were 0.346, 0.791, 0.931, and 0.667, respectively (Table 4).
The mean bias (bias = [sCr-based GFR or sCyC-based GFR] - [24-hour urine CrCl]) was calculated according to Bland and Altman. The mean bias of sCr-based GFR was 1.92 ± 14.94 mL/min/1.73 m2 (P < 0.001, t-test). The biases were 0.65, 3.79 and 3.32 mL/min/1.73 m2 within the first month, from the first month to the first year, and after the first year, respectively. Similarly, the mean biases of sCr-based GFR were 4.47, 5.32, -5.79, and -31.33 mL/
min/1.73 m2, respectively, and the mean bias of sCyC- based GFR was 6.92 ± 19.7 mL/min/1.73 m2 (P < 0.001, t-test), with biases of 1.25, 6.40, and 10.44 mL/min/1.73 m2 at the three posttransplantation times points. The mean biases of sCyC-based GFR were 15.03, 13.37, -5.58, and -34.79, respectively.
The mean precision (absolute value of bias) between
sCr-based GFR and 24-hour urine CrCl was 10.78 ± 10.5 mL/min/1.73 m2, and 10.69, 10.00, and 11.11 mL/min/1.73 m2, respectively, at the three posttransplantation times points. Based on 24-hour urine CrCl levels, the biases of sCr-based GFR values were 7.57, 10.03, 14.52, and 31.33, respectively. The mean precision was 16.35 ± 12.96 mL/
min/1.73 m2 (P < 0.001, t-test), with precisions of 17.17, 8.34, and 16.66 mL/min/1.73 m2 at the three posttransplan- tation times, respectively, and the mean bias of sCyC-based GFR were 15.03, 14.80, 17.91, and 34.79, respectively.
The sensitivities for detecting a GFR below 60 mL/min/
1.73 m2 were higher for CyC (0.96, 1, and 0.95) than for sCr (0.77, 0.75, and 0.82) (P = 0.0165, P = 0.3985, and P = 0.0350).
But the specificities for detecting a GFR below 60 mL/min/
1.73 m2 were higher for sCr (0.57, 0.5, and 0.56) than for sCyC (0.19, 0.5, and 0.25) (P = 0.0001, P = 0.6592, and P = 0.0002).
DISCUSSION
The accurate detection of changes of GFR to prevent fur- ther damage to the graft may be most important in those kidney transplantation patients with the least progressive graft damage.
Both sCr and CyC are widely used as markers for meas- uring GFR. Many studies have indicated that CyC is supe- rior to sCr as a GFR marker, especially in patients with ear- ly and moderate reductions of GFR [5-8]. However, it is
very important to understand the advantages and limi- tations of these markers in clinical practice.
We compared sCr, CyC, Cr-based GFR (MDRD-II for- mula) and CyC-based GFR (Thierry Le Bricon’s formula) with 24-hour urine CrCl. We assume that 24-hour urine CrCl reflects closely the true GFR. However it has many limitations because it is based on sCr, uCr and UV, and sCr is underestimated due to free filtration by the proximal tu- bules while uCr is overestimated. Because of the different ways of measuring sCr, as well as patient urine collection errors such as, incomplete bladder emptying, and high co- efficients of variation in uCr excretion etc, 24-hour urine CrCl tends to overestimate GFR both in transplant pa- tients and the general populations [10-12].
Therefore, 24-hour urine CrCl has fallen into disfavor and may not provide more accurate information about kidney function than other Cr-based methods. However, it remains the preferred method of assessing GFR for evalu- ating kidney function in prospective kidney donors.
Hence, one should bear in mind that GFR measured by 24-hour urine CrCl may be an overestimate of the true GFR [10-12].
This study has main findings: first, in terms of mean and bias, Cr-based GFR (MDRD-II formula), and CyC-based GFR (Thierry Le Bricon’s formula) were underestimated at CrCl ≥ 60 mL/min/1.73 m2, and overestimated at CrCl < 60 mL/min/1.73 m2.
The reason why the Cr-based GFR is overestimated at CrCl < 60 mL/min/1.73 m2 is that 16 to 66% of sCr is elimi- nated extraglomerularly, depending on the extent of GFR reduction. Tubular secretion and intestinal elimination ap- pear to reach their maximum levels when GFR falls to ≤15 mL/min/1.73 m2. Hence when, real GFR falls, sCr may in- crease less than expected and Cr-based GFR would be overestimated.
In chronic renal disease, the sCr increase is only 30 to 50% of what would be expected from the prevailing GFR.
Therefore, monitoring GFR is very important when CrCl is
< 60 mL/min/1.73 m2 [13]. In other words, the tendency of Cr-based GFR and CyC-based GFR to be underestimated when 60 ≤ CrCl < 90 mL/min/1.73 m2 can make early de- tection of decreasing GFR difficult, and it appears to lead to overestimation of the prevalence of chronic kidney dis-
ease in the general population [14].
Second, we found better correlation, accuracy, pre- cision, and less bias when using the Cr-based equation than the CyC-based equation. However, the sensitivity for detecting a GFR below 60 mL/min/1.73 m2 was higher when CyC was used than when sCr was used.
Because Cr-based GFR formulae and 24-hour urine CrCl formulae frequently use reciprocal Cr as the variable, Cr-based GFR values are more highly correlated and are more accurate and precise, than 24-hour urine CrCl, itself and have less bias. Therefore, the development of another CyC-based GFR formula may be needed to yield measures of GFR closer to actual GFR measurements.
There have been several studies comparing the accu- racy of CyC with that of sCr. Li et al. [15] reported that CyC-based GFR yielded less accurate results than the MDRD formula, in diabetic patients. Whereas, Sterner et al. [16], Yeo et al. [17], and Gourishankar et al. [18] reported that CyC-based GFR was as accurate as Cr-based GFR.
The sensitivity of CyC for early detection of decreasing GFR observed in our study is clinically relevant in the light of previous research evaluating renal function. For in- stance, Hojs et al. [3], Kyhse-Andersen et al. [19], El-Shafey et al. [20], Xu et al. [21], Thomas and Thomas [4], Yashiro et al. [6], Mojiminiyi and Abdella [22], Maillard et al. [23], and Qutb et al. [8] all found that the diagnostic accuracy of CyC for reduced GFR was superior to that of sCr based on ROC curves. El-Shafey et al. [20] reported that CyC was more sensitive than Cr for detecting early and moderate deterioration of GFR in adult renal transplant recipients and in patients with type 2 diabetes mellitus and renal im- pairment. A meta-analysis of 24 studies examining the clinical utility of CyC revealed that CyC was superior to sCr for detecting impaired GFR [5].
In conclusion, CyC is a more sensitive indicator of low GFR than sCr (CrCl < 60 mL/min/1.73 m2). However CyC-based GFR is restrictive data, and is neither accurate nor specific for detecting CrCl. Therefore, to evaluate renal function after renal transplantation more accurately, we may need a new CyC-based GFR formula and close mon- itoring of sCr.
CONFLICTS OF INTEREST
No potential conflict of interest relevant to this article was reported.
REFERENCES
1. White CA, Knoll GA, Poggio ED. Measuring vs estimating glomerular filtration rate in kidney transplantation. Trans- plant Rev (Orlando) 2010;24:18-27.
2. Newman DJ. Cystatin C. Ann Clin Biochem 2002;39(Pt 2):89-104.
3. Hojs R, Bevc S, Ekart R, Gorenjak M, Puklavec L. Serum cystatin C as an endogenous marker of renal function in patients with mild to moderate impairment of kidney function. Nephrol Dial Transplant 2006;21:1855-62.
4. Thomas C, Thomas L. Renal failure--measuring the glo- merular filtration rate. Dtsch Arztebl Int 2009;106:849-54.
5. Dharnidharka VR, Kwon C, Stevens G. Serum cystatin C is superior to serum creatinine as a marker of kidney func- tion: a meta-analysis. Am J Kidney Dis 2002;40:221-6.
6. Yashiro M, Kamata T, Segawa H, Kadoya Y, Murakami T, Muso E. Comparisons of cystatin C with creatinine for evaluation of renal function in chronic kidney disease. Clin Exp Nephrol 2009;13:598-604.
7. Mojiminiyi OA, Abdella N, George S. Evaluation of serum cystatin C and chromogranin A as markers of nephropathy in patients with type 2 diabetes mellitus. Scand J Clin Lab Invest 2000;60:483-9.
8. Qutb A, Syed G, Tamim HM, Al Jondeby M, Jaradat M, Tamimi W, et al. Cystatin C-based formula is superior to MDRD, Cockcroft-Gault and Nankivell formulae in esti- mating the glomerular filtration rate in renal allografts.
Exp Clin Transplant 2009;7:197-202.
9. Le Bricon T, Thervet E, Froissart M, Benlakehal M, Bousquet B, Legendre C, et al. Plasma cystatin C is superi- or to 24-h creatinine clearance and plasma creatinine for estimation of glomerular filtration rate 3 months after kid- ney transplantation. Clin Chem 2000;46(8 Pt 1):1206-7.
10. El-Minshawy O, Saber RA, Osman A. 24-hour creatinine clearance reliability for estimation of glomerular filtration rate in different stages of chronic kidney disease. Saudi J Kidney Dis Transpl 2010;21:686-93.
11. Perrone RD, Madias NE, Levey AS. Serum creatinine as an index of renal function: new insights into old concepts.
Clin Chem 1992;38:1933-53.
12. Poge U, Gerhardt T, Palmedo H, Klehr HU, Sauerbruch T, Woitas RP. MDRD equations for estimation of GFR in renal transplant recipients. Am J Transplant 2005;5:1306-11.
13. Xie D, Joffe MM, Brunelli SM, Beck G, Chertow GM, Fink JC, et al. A comparison of change in measured and esti- mated glomerular filtration rate in patients with nondia- betic kidney disease. Clin J Am Soc Nephrol 2008;3:1332-8.
14. Shankar A, Lee KE, Klein BE, Muntner P, Brazy PC, Cruickshanks KJ, et al. Estimating glomerular filtration rate in a population-based study. Vasc Health Risk Manag 2010;6:619-27.
15. Li HX, Xu GB, Wang XJ, Zhang XC, Yang JM. Diagnostic ac- curacy of various glomerular filtration rates estimating equations in patients with chronic kidney disease and diabetes. Chin Med J (Engl) 2010;123:745-51.
16. Sterner G, Bjork J, Carlson J, Grubb A, Nyman U.
Validation of a new plasma cystatin C-based formula and the Modification of Diet in Renal Disease creatinine-based formula for determination of glomerular filtration rate.
Scand J Urol Nephrol 2009;43:242-9.
17. Yeo Y, Han DJ, Moon DH, Park JS, Yang WS, Chang JW, et al. Suitability of the IDMS-traceable MDRD equation meth- od to estimate GFR in early postoperative renal transplant recipients. Nephron Clin Pract 2010;114:c108-17.
18. Gourishankar S, Courtney M, Jhangri GS, Cembrowski G, Pannu N. Serum cystatin C performs similarly to tradi- tional markers of kidney function in the evaluation of do- nor kidney function prior to and following unilateral nephrectomy. Nephrol Dial Transplant 2008;23:3004-9.
19. Kyhse-Andersen J, Schmidt C, Nordin G, Andersson B, Nilsson-Ehle P, Lindstrds V, et al. Serum cystatin C, de- termined by a rapid, automated particle-enhanced turbidi- metric method, is a better marker than serum creatinine for glomerular filtration rate. Clin Chem 1994;40:1921-6.
20. El-Shafey EM, El-Nagar GF, Selim MF, El-Sorogy HA, Sabry AA. Is serum cystatin C an accurate endogenous marker of glomerular filteration rate for detection of early renal impairment in patients with type 2 diabetes mellitus?
Ren Fail 2009;31:355-9.
21. Xu H, Lu Y, Teng D, Wang J, Wang L, Li Y. Assessment of glomerular filtration rate in renal transplant patients using serum cystatin C. Transplant Proc 2006;38:2006-8.
22. Mojiminiyi OA, Abdella N. Evaluation of cystatin C and beta-2 microglobulin as markers of renal function in pa- tients with type 2 diabetes mellitus. J Diabetes Complicati- ons 2003;17:160-8.
23. Maillard N, Mariat C, Bonneau C, Mehdi M, Thibaudin L, Laporte S, et al. Cystatin C-based equations in renal trans- plantation: moving toward a better glomerular filtration rate prediction? Transplantation 2008;85:1855-8.