서 론
여성의 사회진출, 핵가족 및 유아교육에 대한 국가적인 관 심이 증가하면서(Jo CY & Han JS 2018) 전국의 어린이집 수 가 2007년 기준 30,856개소에서 2017년 기준 40,238개소로 10 년 동안 약 76.7%가 증가하였으며, 어린이집 보육아동 수 또 한 2007년 1,099,933명에서 2017년 1,450,243명으로 약 75.8%
증가하였다(Ministry of Health and Welfare 2017). 어린이집에
서는 급식, 간식이 반일제, 종일제, 시간연장형 등에 따라 제 공되고 있으며, 영유아는 면역체계가 완전히 발달하지 않았기 때문에 다른 연령대에 비해 쉽게 식중독, 감염성 질환 등에 취 약하다(Kim JB 등 2011; Cho SH 등 2014; Moon HK 2017).
이러한 영유아를 대상으로 급식을 제공할 경우 위생의 품질 관리가 중요하나(Paik JE 등 2015), 어린이집의 양적 증가에 비해 어린이 급식의 질적인 수준이 상대적으로 미흡한 실정 이다(Lee YM & Oh YJ 2005; Song ES & Kim EG 2010; Lee JY 2016). 또한 영유아들에게 위생적이고 안전한 급식을 제공 하기 위해 급식 관리자 및 조리종사자의 위생․안전 교육이 필 요하다(Park NY 등 2011; Seo YJ & Jeon MS 2015).
칠곡군 일부 지역의 어린이급식소 위생․안전관리 개선 효과 분석
박 숙 현1,2․정 현 아1,3†
1칠곡군어린이급식관리지원센터, 2대구한의대학교 대학원 한방식품학과,
3대구한의대학교 한방식품조리영양학부
Analysis of Sanitary Safety Management Improvement for Children’s Food service in Chilgok-gun Area
Suk-Hyeon Park1,2 and Hyeon-A Jung1,3†
1Chilgok-gun Center for Children’s Foodservice Management, Gyeongbuk 39905, Republic of Korea
2Dept. of Herbal Food Scienece, Graduate School of Daegu Haany University, Gyeongbuk 38610, Republic of Korea
3Faculty of Herbal Foood Cuisine and Nutrition, Daegu Haany University, Gyeongbuk 38610, Republic of Korea
ABSTRACT
This study evaluated the effectiveness of hygiene management improvement through visiting instruction for the sanitary safety of children's foodservice centers in some areas of Chilgok-gun and to provide basic data for customized sanitary safety management for registered children's foodservice centers. For the execution rate of sanitary safety management, the execution rate increased in the items depending on whether the pre-treatment and cooking area had been separated or not in the facility environment area as the number of instructional visits increased (p<0.05). The number of instructional visits differed depending on whether there were facilities, such as cooking, washing, and hand washing facilities (p<0.05). In personal hygiene, the health checkup of performing annual medical examinations increased as the number of instructional visits increased (p<0.01).
In the preparation management, the execution rate was higher in the items included in internal hygienic management, such as raw material storage room, indication of the origin of ingredients, an whether, knife cutting board is used separately or not, as the number of instructional visits increased (p<0.01). The execution rate of chlorine disinfection for non-cooked food increased as the number of instructional visits increased (p<0.001). Whether food was managed properly in accordance with the storage standards in the storage management area differed according to the number of instructional visits (p<0.01). A comparison of the total points by the sanitary safety management area the revealed an rage score of the facility environment by visit of 20.90 points and personal hygiene of 6.11 points; there was a difference between visitations (p<0.001). The average score of food management was 21.10 points: 23.36 points for preparation management (p<0.001), 4.85 points for food storage (p<0.05), and 12.19 points for others. The overall average score of the total score by visit was 88.51 points (p<0.01). The total score by visit increased with increasing number of instructional visits (p<0.01). Instructional visits from the center are believed to contribute to the improvement of the sanitary safety management execution rate of children's foodservice centers and continuous instruction and training material development are needed to improve the execution rate of all items.
Key words: sanitary, safety, foodservice, chidren's foodservice centers, sanitary safety management
†Corresponding author : Hyeona Jung, Tel: +82-53-819-1593, E-mail:
이러한 문제점을 개선하고자 2008년에 어린이식생활안전 관리특별법을 제정하였으며, 5장 21조에 어린이급식관리지 원센터의 설치․운영에 대해 명시되어 있다(Ministry of Go- vernment Legislation 2018). 식품의약품안전처에서는 2011년 12개 어린이급식관리지원센터를 개소하여 전국적으로 확대 되어 현재 2018년 8월 기준 217개 어린이급식관리지원센터 가 운영되고 있다(Ministry of Food and Drug Safety 2018a).
어린이급식관리지원센터는 영양사가 없는 100명 미만 어린 이 급식소를 대상으로 어린이 급식소에 방문하여 영양 및 위 생․안전관리 순회방문, 어린이․조리원․원장 등 대상별 영 양 및 위생․안전교육을 실시한다. 또한 어린이 맞춤형 식단, 레시피 개발, 가정통신문 제작 등의 정보제공도 실시한다 (Ministry of Food and Drug Safety 2018b). Kim SH 등(2014) 의 연구와 같이 칠곡군어린이급식관리지원센터에 등록되어 있는 시설은 100인 미만의 영양사 고용 의무가 없는 어린이 급식소이며, 조리종사자가 있거나 원장이 겸임으로 위생관 리를 하고 있다. 조리 담당자가 자격증이 없거나 전문적인 위생․안전교육 및 훈련을 할 수 있는 전문가가 없어 위생관 리 수행률이 낮은 것으로 연구결과가 보고되었다.
어린이급식관리지원센터에 관련된 연구를 살펴보면, 유아 당류 섭취 줄이기 영양교육 실태 및 요구도(Kim MH 등 2017), 영양 및 위생․안전관리 방문교육지원 효과(Lee JH 2016), 등록 시설 국물음식의 염도 모니터링(Park HN & Kim SM 2016), 영양교육 프로그램의 개발 및 효과에 대한 연구(Jo CY 등 2015), 부산 일부 지역의 위생․안전관리 지원 효과 (Kim SH 등 2014), 센터지원에 대한 메뉴관리 및 식사다양 성 효과 평가(Kim HY 등 2013), 위생순회방문지도를 통한 조리원 위생지식 변화 평가(Kim JA & Lee YM 2014), 위생 관리 실태 조사 및 위생관리 개선 효과 분석(Paik JE 등 2015), 맞춤형 위생 관리 매뉴얼 개발 및 효과평가(Cho SH 등 2014), 어린이 급식소 기구의 위생점검 결과와 ATP 청결 도 비교(Moon HK 2017) 등에 대한 연구가 보고되었으나, 어 린이 급식소 회차별 순회방문지도에 따른 위생․안전관리 개선 효과분석에 대한 연구가 부족하다.
이에 본 연구에서는 칠곡군어린이급식관리지원센터에 등 록된 50인 이상 100인 미만 어린이 급식소를 대상으로 하여, 위생․안전 순회방문 지도를 통해 위생관리 개선 효과를 평 가하며, 등록 어린이 급식소의 맞춤형 위생․안전관리 방안 모색을 위한 기초자료를 제공하고자 한다.
연구 방법
1. 조사대상 및 기간
본 연구에서 위생․안전관리 순회방문 지원의 효과를 분
석하기 위하여, 칠곡군어린이급식관리지원센터에 등록되어 있는 50인 이상 100인 미만 어린이 급식소 32개소를 대상으 로 하였다. 2016년 1월부터 2016년 12월까지 12개월간 어린 이급식관리지원센터의 영양사가 2달에 1번씩 6회에 걸쳐 순 회방문 지도를 실시하였다.
2. 연구 내용 및 방법
본 연구에 사용된 위생․안전관리 평가 도구는 식품의약 품안전처에서 제공하는 2016년 어린이급식관리지원센터 가 이드라인(Ministry of Food and Drug Safety 2016)의 어린이 급식소 위생․안전관리 체크리스트를 사용하였다. 조사내용 및 문항 수는 다음과 같다. 일반사항은 배식형태, 교사 수, 조리원수, 조리원 경력, 평가인증의 총 5문항, 위생․안전관 리 평가항목은 시설환경영역 12문항, 개인위생영역 3문항, 원료사용영역 8문항, 공정관리영역 14문항, 보관관리영역 3 문항, 기타 사항영역 5문항으로 총 45문항으로 구성되었다.
위생․안전관리 수준 변화를 영역별로 비교하여 평가하기 위해 체크리스트에 제시되어진 항목별 관리기준에 따라 점 수를 부여하였으며, 관리기준에 따라 항목별 점수가 만점일 경우 적합하다(1)와 관리기준 중에 1개라도 미흡할 경우 부 적합하다(0)로 환산하여 각 항목별 준수 비율을 비교하였다.
위생․안전관리 평가는 칠곡군어린이급식관리지원센터의 전 문 영영사가 직접 관찰하거나, 어린이 급식소의 담당자와 면 담을 통해 평가하였다.
3. 통계분석
수집된 자료는 SPSS 23.0 for Windows Program을 이용하 여 분석하였다. 조사대상의 일반사항에 대해서는 빈도분석을 실시하였고, 위생․안전관리 항목별 수행률을 알아보기 위해 교차분석을 실시하였다. 위생․안전 순회방문 점수의 회차별 차이를 파악하고자 일원배치 분산분석(사후분석 Duncan’s multiple range test)을 실시하였다.
결과 및 고찰
1. 조사대상자의 일반사항
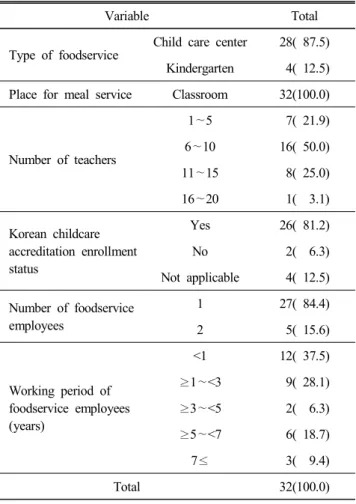
조사대상자인 어린이수 50인 이상 100인 미만 집단급식소 등록 어린이 급식소의 일반사항은 Table 1과 같다. 어린이집 은 28개소(81.2%), 유치원은 4개소(12.5%)이며, 어린이 급식 소의 32개소(100.0%) 모두 교실에서 배식하는 것으로 조사되 었으며, 교사 수는 6∼10명인 곳이 16개소(50.0%), 11∼15명 8 개소(25.0%), 1∼5명 7개소(21.9%), 16∼20명 1개소(3.1%) 순으로 나타났다. 평가인증 대상이 아닌 급식소가 4개소 (12.5%)였으며, 81.2%의 대부분의 급식소가 평가인증을 받은
Table 1. Characteristics of foodservice facilitieses n(%)
Variable Total
Type of foodservice
Child care center 28( 87.5) Kindergarten 4( 12.5) Place for meal service Classroom 32(100.0)
Number of teachers
1∼5 7( 21.9)
6∼10 16( 50.0)
11∼15 8( 25.0) 16∼20 1( 3.1) Korean childcare
accreditation enrollment status
Yes 26( 81.2)
No 2( 6.3)
Not applicable 4( 12.5) Number of foodservice
employees
1 27( 84.4)
2 5( 15.6)
Working period of foodservice employees (years)
<1 12( 37.5)
≥1∼<3 9( 28.1)
≥3∼<5 2( 6.3)
≥5∼<7 6( 18.7) 7≤ 3( 9.4)
Total 32(100.0)
것으로 조사되었다. 조리원이 1명인 곳이 27개소(84.4%)로 높았으며, 2명인 곳은 5개소(15.6%)로 나타났으며, 조리원 경 력이 1년 미만인 어린이급식소가 12개소(37.55%)로 가장 높 았으며, 1∼3년 미만이 9개소(28.1%), 5∼7년 미만이 6개소 (18.7%), 7년 이상 3개소(9.4%), 3∼5년 미만이 2개소(6.3%)로 조사되었다. Sohn CY & Park HO(2011)의 연구에서도 88.7%
가 교실에서 배식하는 것으로 조사되었으며, 교차오염이 발 생하지 않도록 위생적인 관리가 필요할 것으로 사료된다.
2. 어린이급식관리지원센터의 순회방문 지도에 따른 어린이 급식소 위생․안전관리 수행률
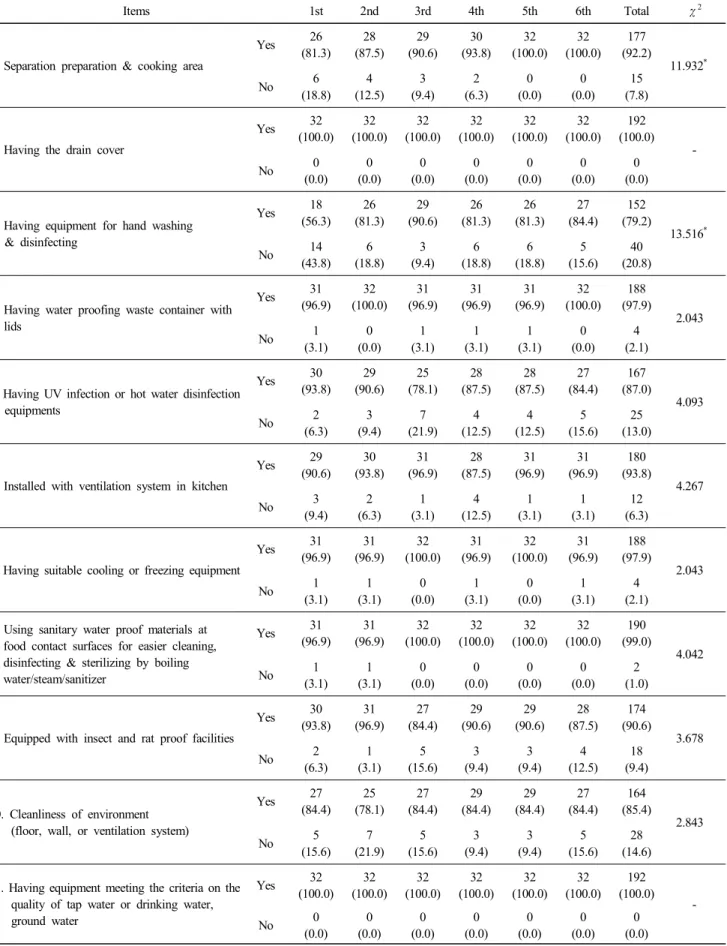
1) 위생․안전관리 점검 결과: 시설환경
어린이수 50인 이상 100인 미만 집단급식소 등록 어린이 급식소의 위생․안전관리의 시설환경영역의 순회방문 지도 회차별 준수 비율 변화는 Table 2와 같다. 12문항 중 대부분 의 항목이 전체적으로 평균 90.0% 이상의 수행률을 보였으 나, 조리, 세척, 손 씻는 시설 등 설치 여부 79.2%, 살균소독 기 또는 열탕 세척 소독 시설 설치 여부 87.0%, 바닥, 벽 등
시설의 청결관리 여부 85.4%로 다소 낮은 수행률을 보였다.
전처리, 조리구역 분리 여부 항목이 순회방문 지도 횟수가 증가할수록 수행률도 높아졌으며(p<0.05), 조리, 세척, 손 씻 는 시설 등 설치 여부 항목이 순회방문 지도 횟수에 따라 유 의적인 차이를 보였다(p<0.05). 미설치되어 있는 시설들에 대해서 교차오염 방지를 위한 조치를 하거나, 손 씻는 세척 제, 세정제, 핸드타월 등을 비치하도록 대체할 수 있는 부분 에 대해서 센터에서 지도하고 있다. 이 때문에 어린이 급식 소 관리자의 예산 부담을 줄이면서 수행률도 높일 수 있는 것으로 사료된다.
2) 위생․안전관리 점검 결과: 개인위생
어린이수 50인 이상 100인 미만 집단급식소 등록 어린이 급식소의 위생․안전관리의 개인위생영역의 순회방문 지도 회차별 준수 비율 변화는 Table 3과 같다. 조리원의 개인위 생관리 준수 여부가 6회 평균 81.3%였으며, 조리원의 액세 서리 착용 여부가 6회 평균 92.7% 수행률로 조사되었다. 조 리원 및 집단급식소 설치․운영자의 건강진단 실시 여부 항 목이 6회 평균이 77.6%로 다른 항목에 비해 낮은 수행률을 보였으나, 순회방문 지도 횟수가 증가할수록 유의적으로 수 행률이 증가하는 것을 확인할 수 있었다(p<0.01). 건강진단 실시 필요성 및 유효기간 내에 재검진을 받을 수 있도록 센 터에서 지속적인 관리를 통해 수행률이 높아진 것으로 사료 된다. Lee JH(2016)의 연구에서도 어린이급식관리지원센터 의 순회방문 지도를 통해 개인위생관리가 철저해져서 본 연 구와 유사한 결과를 나타냈다.
3) 위생․안전관리 점검 결과: 원료사용
어린이수 50인 이상 100인 미만 집단급식소 등록 어린이 급식소의 위생․안전관리의 원료사용영역의 순회방문 지도 회차별 준수 비율 변화는 Table 4와 같다. 8문항 중 대부분의 항목이 수행률이 90.0% 이상이었으나, 식재료 검수시 제조 일자 또는 유통기한 확인(76.0%), 무허가(무신고) 원료 사용 (67.7%), 무표시 원료 사용(44.8%), 검사 받지 않은 축산물 사용(58.9%) 항목의 수행률이 낮게 조사되었다. 식재료 구매 시 영수증, 검수서 등을 꼭. 비치할 수 있도록 지속적인 교육 이 필요한 것으로 사료된다. 어린이 급식소에서는 고춧가루, 깨, 참기름 등과 같은 식재료는 시판 제품보다 방앗간에서 직 접 제조하는 경우가 많다고 보고되어 있으며(Cho SH 등 2014), 무허가(무신고), 무표시 원료 관리에 대한 필요성과 위 생․안전의 중요성을 지속적으로 교육으로 통해 인식 변화 가 필요하며, 센터에서 제공하고 있는 식품표시라벨 등의 지 원물품을 제공하면서 교육을 실시한다면 교육 효과가 개선 될 것으로 사료된다.
Table 2. Comparison of facilities equipments items to the frequency of food safety evaluation n(%)
Items 1st 2nd 3rd 4th 5th 6th Total χ2
1. Separation preparation & cooking area
Yes 26
(81.3) 28 (87.5)
29 (90.6)
30 (93.8)
32 (100.0)
32 (100.0)
177 (92.2)
11.932*
No 6
(18.8) 4 (12.5)
3 (9.4)
2 (6.3)
0 (0.0)
0 (0.0)
15 (7.8)
2. Having the drain cover
Yes 32
(100.0) 32 (100.0)
32 (100.0)
32 (100.0)
32 (100.0)
32 (100.0)
192 (100.0)
-
No 0
(0.0) 0 (0.0)
0 (0.0)
0 (0.0)
0 (0.0)
0 (0.0)
0 (0.0)
3. Having equipment for hand washing
& disinfecting
Yes 18
(56.3) 26 (81.3)
29 (90.6)
26 (81.3)
26 (81.3)
27 (84.4)
152 (79.2)
13.516*
No 14
(43.8) 6 (18.8)
3 (9.4)
6 (18.8)
6 (18.8)
5 (15.6)
40 (20.8)
4. Having water proofing waste container with lids
Yes 31
(96.9) 32 (100.0)
31 (96.9)
31 (96.9)
31 (96.9)
32 (100.0)
188 (97.9)
2.043
No 1
(3.1) 0 (0.0)
1 (3.1)
1 (3.1)
1 (3.1)
0 (0.0)
4 (2.1)
5. Having UV infection or hot water disinfection equipments
Yes 30
(93.8) 29 (90.6)
25 (78.1)
28 (87.5)
28 (87.5)
27 (84.4)
167 (87.0)
4.093
No 2
(6.3) 3 (9.4)
7 (21.9)
4 (12.5)
4 (12.5)
5 (15.6)
25 (13.0)
6. Installed with ventilation system in kitchen
Yes 29
(90.6) 30 (93.8)
31 (96.9)
28 (87.5)
31 (96.9)
31 (96.9)
180 (93.8)
4.267
No 3
(9.4) 2 (6.3)
1 (3.1)
4 (12.5)
1 (3.1)
1 (3.1)
12 (6.3)
7. Having suitable cooling or freezing equipment
Yes 31
(96.9) 31 (96.9)
32 (100.0)
31 (96.9)
32 (100.0)
31 (96.9)
188 (97.9)
2.043
No 1
(3.1) 1 (3.1)
0 (0.0)
1 (3.1)
0 (0.0)
1 (3.1)
4 (2.1)
8. Using sanitary water proof materials at food contact surfaces for easier cleaning, disinfecting & sterilizing by boiling water/steam/sanitizer
Yes 31
(96.9) 31 (96.9)
32 (100.0)
32 (100.0)
32 (100.0)
32 (100.0)
190 (99.0)
4.042
No 1
(3.1) 1 (3.1)
0 (0.0)
0 (0.0)
0 (0.0)
0 (0.0)
2 (1.0)
9. Equipped with insect and rat proof facilities
Yes 30
(93.8) 31 (96.9)
27 (84.4)
29 (90.6)
29 (90.6)
28 (87.5)
174 (90.6)
3.678
No 2
(6.3) 1 (3.1)
5 (15.6)
3 (9.4)
3 (9.4)
4 (12.5)
18 (9.4)
10. Cleanliness of environment (floor, wall, or ventilation system)
Yes 27
(84.4) 25 (78.1)
27 (84.4)
29 (84.4)
29 (84.4)
27 (84.4)
164 (85.4)
2.843
No 5
(15.6) 7 (21.9)
5 (15.6)
3 (9.4)
3 (9.4)
5 (15.6)
28 (14.6)
11. Having equipment meeting the criteria on the quality of tap water or drinking water, ground water
Yes 32
(100.0) 32 (100.0)
32 (100.0)
32 (100.0)
32 (100.0)
32 (100.0)
192 (100.0)
-
No 0
(0.0) 0 (0.0)
0 (0.0)
0 (0.0)
0 (0.0)
0 (0.0)
0 (0.0)
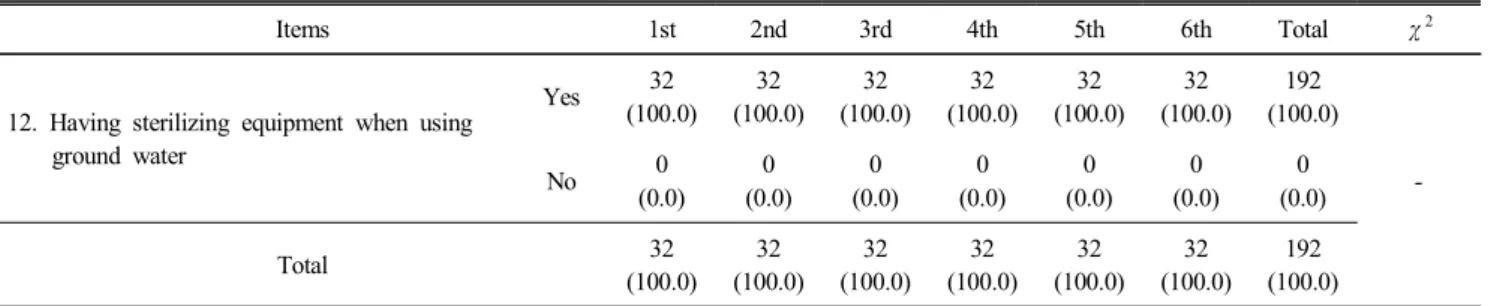
4) 위생․안전관리 점검 결과: 공정관리
어린이수 50인 이상 100인 미만 집단급식소 등록 어린이 급식소의 위생․안전관리의 공정관리영역의 순회방문 지도 회차별 준수 비율 변화는 Table 5와 같다. 14문항 중 식재료 원산지 표기 여부(54.7%), 가열조리하지 않는 음식의 식재료 염소소독 실시(47.4%)로 평균 수행률이 다른 항목에 비해 매 우 낮게 나타났다. An SJ & Moon HK(2015)의 연구에서도 채소와 과일을 깨끗이 세척하고 소독하기의 항목의 부적합률 이 80.7%로 매우 높게 나타나, 수행률을 높일 수 있도록 훈련 프로그램 개발 및 훈련도구 세트를 공급할 수 있도록 제안하 였다. 원료보관실 등 내부 청결 관리, 식재료 원산지 표기 여 부, 칼․도마 구분사용 항목이 순회방문 지도 횟수가 증가할 수록 수행률이 유의적으로 증가하였으며(p<0.01), 가열조리 하지 않는 음식의 식재료 염소소독 실시 항목도 순회방문 지 도 횟수가 증가할수록 수행률이 유의적으로 증가하였다 (p<0.001). 이는 센터에서 순회방문 지원물품으로 염소소독제
를 제공하여 가열조리하지 않는 음식의 식재료의 소독 필요 성에 대해 교육효과를 볼 수 있었다.
5) 위생․안전관리 점검 결과: 보관관리
어린이수 50인 이상 100인 미만 집단급식소 등록 어린이 급식소의 위생․안전관리의 보관관리영역의 순회방문 지도 회차별 준수 비율 변화는 Table 6과 같다. 식품 등을 보관기 준에 적합하게 관리 여부 항목의 평균 수행률이 54.7%로 가 장 낮았으나, 5차 순회방문부터 수행률이 증가하는 것을 확 인할 수 있었다(p<0.01). 냉장․냉동 시설 및 가열처리시설 온도계 설치 여부의 평균 수행률이 63.5%를 보였으며, 식품 과 비식품 구분 보관의 평균 수행률이 79.2%로 나타났다.
Paik JE 등(2015) 연구에 따르면 냉장․냉동고 적정온도 확 인의 수행률이 57.8%로 다소 낮은 것으로 보고되었으며, 어 린이 급식소에서 냉장․냉동 시설의 온도계를 따로 설치하 지 않거나 올바른 방법으로 설치를 하지 않는 시설이 많았
Table 2. Continued n(%)
Items 1st 2nd 3rd 4th 5th 6th Total χ2
12. Having sterilizing equipment when using ground water
Yes 32
(100.0) 32 (100.0)
32 (100.0)
32 (100.0)
32 (100.0)
32 (100.0)
192 (100.0)
-
No 0
(0.0) 0 (0.0)
0 (0.0)
0 (0.0)
0 (0.0)
0 (0.0)
0 (0.0)
Total 32
(100.0) 32 (100.0)
32 (100.0)
32 (100.0)
32 (100.0)
32 (100.0)
192 (100.0)
* p<0.05.
Table 3. Comparison of personal hygiene to the frequency of food safety evaluation n(%)
Items 1st 2nd 3rd 4th 5th 6th Total χ2
1. Performing annual medical examination
Yes 16
(50.0) 27 (84.4)
24 (75.0)
26 (81.3)
25 (78.1)
31 (96.9)
149 (77.6)
22.086**
No 16
(50.0) 5 (15.6)
8 (25.0)
6 (18.8)
7 (21.9)
1 (3.1)
43 (22.4)
2. Cooking staff is thorough in personal hygiene management
Yes 27
(84.4) 24 (75.0)
24 (75.0)
26 (81.3)
24 (75.0)
31 (96.9)
156 (81.3)
7.795
No 5
(15.6) 8 (25.0)
8 (25.0)
6 (18.8)
8 (25.0)
1 (3.1)
36 (18.8)
3. Working with manicure and accessaries removed
Yes 28
(87.5) 30 (93.8)
30 (93.8)
31 (96.9)
28 (87.5)
31 (96.9)
178 (92.7)
4.315
No 4
(12.5) 2 (6.3)
2 (6.3)
1 (3.1)
4 (12.5)
1 (3.1)
14 (7.3)
Total 32
(100.0) 32 (100.0)
32 (100.0)
32 (100.0)
32 (100.0)
32 (100.0)
192 (100.0)
** p<0.01.
다. 냉장․냉동 시설에 설치할 수 있도록 온도계를 지원물품 으로 배부하거나, 방문 시에 직접 적합하게 온도계를 설치 안내를 하여 수행률을 높일 수 있을 것으로 생각된다.
6) 위생․안전관리 점검 결과: 기타사항
어린이수 50인 이상 100인 미만 집단급식소 등록 어린이
급식소의 위생․안전관리의 기타 사항영역의 순회방문 지도 회차별 준수 비율 변화는 Table 7과 같다. 5개 항목 중 대부 분의 항목이 90% 이상의 수행률을 보였으나, 조리․제공한 식품 매회 1인 분량 보존식 보관(59.9%), 집단급식소 설치․운 영자 위생교육 실시(81.8%)로 수행률이 낮게 조사되었다.
Kim SH 등(2014)의 연구에서도 보존식 관리가 미흡한 것으 Table 4. Comparison of food management to the frequency of food safety evaluation n(%)
Items 1st 2nd 3rd 4th 5th 6th Total χ2
1. Monitoring and recording manufactured date and expiration date during food inspection
Yes 24
(75.0) 23 (71.9)
23 (71.9)
23 (71.9)
28 (87.5)
25 (78.1)
146 (76.0)
3.316
No 8
(25.0) 9 (28.1)
9 (28.1)
9 (28.1)
4 (12.5)
7 (21.9)
46 (24.0)
2. Using unlicensed food materials/products
Yes 25
(78.1) 25 (78.1)
26 (81.3)
20 (62.5)
19 (59.4)
15 (21.7)
130 (67.7)
13.626*
No 7
(21.9) 7 (21.9)
6 (18.8)
12 (37.5)
13 (40.6)
17 (53.1)
62 (32.3)
3. Using or storing decayed/spioled food
Yes 32
(100.0) 32 (100.0)
31 (96.9)
31 (96.9)
32 (100.0)
31 (96.9)
189 (98.4)
3.048
No 0
(0.0) 0 (0.0)
1 (3.1)
1 (3.1)
0 (0.0)
1 (3.1)
3 (1.6)
4. Using unmanifested food materials/products
Yes 18
(56.3) 12 (37.5)
16 (50.0)
14 (43.8)
14 (43.8)
12 (37.5)
86 (44.8)
3.454
No 14
(43.8) 20 (62.5)
16 (50.0)
18 (56.3)
18 (56.3)
20 (62.5)
106 (55.2)
5. Using uncensored livestock products
Yes 16
(50.0) 14 (43.8)
16 (50.0)
19 (59.4)
23 (71.9)
21 (65.6)
113 (58.9)
5.011
No 16
(50.0) 18 (56.3)
16 (50.0)
13 (40.6)
9 (28.1)
11 (34.4)
79 (41.1)
6. Storing or using expired ingredients/cooked foods
Yes 27
(84.4) 28 (87.5)
29 (90.6)
30 (93.8)
28 (87.5)
31 (96.9)
173 (90.1)
3.797
No 5
(15.6) 4 (12.5)
3 (9.4)
2 (6.3)
4 (12.5)
1 (3.1)
19 (9.9)
7. Using quality water examined by inspection agiencies for washing/drinking
Yes 32
(100.0) 32 (100.0)
32 (100.0)
32 (100.0)
32 (100.0)
32 (100.0)
192 (100.0)
-
No 0
(0.0) 0 (0.0)
0 (0.0)
0 (0.0)
0 (0.0)
0 (0.0)
0 (0.0)
8. Using/cooking prohibited foods before hazard analysis
Yes 32
(100.0) 32 (100.0)
32 (100.0)
32 (100.0)
32 (100.0)
32 (100.0)
192 (100.0)
-
No 0
(0.0) 0 (0.0)
0 (0.0)
0 (0.0)
0 (0.0)
0 (0.0)
0 (0.0)
Total 32
(100.0) 32 (100.0)
32 (100.0)
32 (100.0)
32 (100.0)
32 (100.0)
192 (100.0)
* p<0.05.
Table 5. Comparison of preparation management to the frequency of food safety evaluation n(%)
Items 1st 2nd 3rd 4th 5th 6th Total χ2
1. Cleanliness of kitchen/food materials storage room
Yes 26
(81.3) 19 (59.4)
25 (78.1)
29 (90.6)
30 (93.8)
30 (93.8)
159 (82.8)
19.650**
No 6
(18.8) 13 (40.6)
7 (21.9)
3 (9.4)
2 (6.3)
2 (6.3)
33 (17.2)
2. Storing perishable foods in refrigerator/freezer
Yes 30
(93.8) 29 (90.6)
32 (100.0)
30 (93.8)
32 (100.0)
32 (100.0)
185 (96.4)
7.858
No 2
(6.3) 3 (9.4)
0 (0.0)
2 (6.3)
0 (0.0)
0 (0.0)
7 (3.6)
3. Proper sterilization/disinfection/boiling of utensils
Yes 28
(87.5) 31 (96.9)
32 (100.0)
30 (93.8)
30 (93.8)
32 (100.0)
184 (95.8)
8.870
No 4
(12.5) 1 (3.1)
0 (0.0)
2 (6.3)
2 (6.3)
0 (0.0)
8 (4.2)
4. Sterilization/disinfection of utensils after cooking animal intestines
Yes 32
(100.0) 32 (100.0)
32 (100.0)
32 (100.0)
32 (100.0)
32 (100.0)
192 (100.0)
-
No 0
(0.0) 0 (0.0)
0 (0.0)
0 (0.0)
0 (0.0)
0 (0.0)
0 (0.0)
5. Checking the place of origin of food materials
Yes 12
(37.5) 24 (75.0)
13 (40.6)
13 (40.6)
20 (62.5)
23 (71.9)
105 (54.7)
18.853**
No 20
(62.5) 8 (25.0)
19 (59.4)
19 (59.4)
12 (37.5)
9 (28.1)
87 (45.3)
6. Use of different knives/cutting boards (fish, meats, vegetables)
Yes 26
(81.3) 25 (78.1)
29 (90.6)
31 (96.9)
32 (100.0)
32 (100.0)
175 (91.1)
18.135**
No 6
(18.8) 7 (21.9)
3 (9.4)
1 (3.1)
0 (0.0)
0 (0.0)
17 (8.9)
7. Use of different dishcloth, gloves, and aprons for a different purposes
Yes 19
(59.4) 26 (81.3)
20 (62.5)
25 (78.1)
27 (84.4)
26 (81.3)
143 (74.5)
9.673
No 13
(40.6) 6 (18.8)
12 (37.5)
7 (21.9)
5 (15.6)
6 (18.8)
49 (25.5)
8. Proper washing/disinfection of kitchen, utensils, and containers
Yes 31
(96.9) 28 (87.5)
31 (96.9)
30 (93.8)
32 (100.0)
32 (100.0)
184 (95.8)
8.870
No 1
(3.1) 4 (12.5)
1 (3.1)
2 (6.3)
0 (0.0)
0 (0.0)
8 (4.2)
9. Handling foods on working table at least 60 cm high from the kitchen floor
Yes 29
(90.6) 28 (87.5)
28 (87.5)
31 (96.9)
29 (90.6)
31 (96.9)
176 (91.7)
3.818
No 3
(9.4) 4 (12.5)
4 (12.5)
1 (3.1)
3 (9.4)
1 (3.1)
16 (8.3)
10. Proper washing and disinfection of raw food
Yes 2
(6.3) 4 (12.5)
4 (12.5)
28 (87.5)
26 (81.3)
27 (84.4)
91 (47.4)
105.891***
No 30
(93.8) 28 (87.5)
28 (87.5)
4 (12.5)
6 (18.8)
5 (15.6)
101 (52.6) 11. An appropriate thawing process and
consuming food right away Yes 31 (96.9)
32 (100.0)
31 (96.9)
32 (100.0)
31 (96.9)
31 (96.9)
188
(97.9) 2.043
로 조사되었으며, 보존식 보관 실시를 하고 있으나, 1인 분량 에 대해 보관을 하지 않거나 144시간 이상 보관하지 않는 경 우, 일부 식품이 누락되는 사례 등이 있어 이에 대한 지속적 인 교육이 필요하다고 사료된다.
3. 어린이급식관리지원센터의 순회방문 지도에 따른 어린이 급식소 위생․안전관리 영역별 총점
어린이수 50인 이상 100인 미만 집단급식소 등록 어린이
급식소의 위생․안전관리의 영역별 총점은 Table 8과 같다.
시설환경의 회차별 평균 점수는 20.90점(22점 만점)이었으 며, 개인위생은 6.11점(7점 만점)으로 회차별 유의적인 차이 를 보였다(p<0.001). 원료사용의 회차별 평균 점수는 21.10점 (24점 만점)이었으며, 공정관리는 23.36점(26점 만점)으로 방 문횟수가 증가할수록 유의적으로 증가하였다(p<0.001). 보관 관리는 4.85점(7점 만점)으로 4회차부터 증가하였으며(p<0.05), 기타 사항은 12.19점(14점 만점)으로 나타났다. 회차별 총점
Table 5. Continued n(%)
Items 1st 2nd 3rd 4th 5th 6th Total χ2
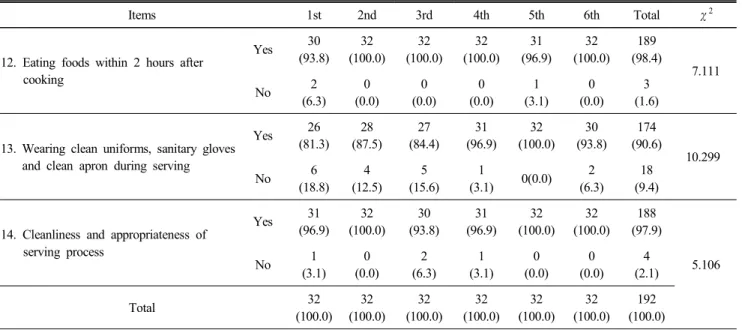
12. Eating foods within 2 hours after cooking
Yes 30
(93.8) 32 (100.0)
32 (100.0)
32 (100.0)
31 (96.9)
32 (100.0)
189 (98.4)
7.111
No 2
(6.3) 0 (0.0)
0 (0.0)
0 (0.0)
1 (3.1)
0 (0.0)
3 (1.6)
13. Wearing clean uniforms, sanitary gloves and clean apron during serving
Yes 26
(81.3) 28 (87.5)
27 (84.4)
31 (96.9)
32 (100.0)
30 (93.8)
174 (90.6)
10.299
No 6
(18.8) 4 (12.5)
5 (15.6)
1
(3.1) 0(0.0) 2
(6.3) 18 (9.4)
14. Cleanliness and appropriateness of serving process
Yes 31
(96.9) 32 (100.0)
30 (93.8)
31 (96.9)
32 (100.0)
32 (100.0)
188 (97.9)
5.106
No 1
(3.1) 0 (0.0)
2 (6.3)
1 (3.1)
0 (0.0)
0 (0.0)
4 (2.1)
Total 32
(100.0) 32 (100.0)
32 (100.0)
32 (100.0)
32 (100.0)
32 (100.0)
192 (100.0)
** p<0.01, *** p<0.001.
Table 6. Comparison of food storage to the frequency of food safety evaluation n(%)
Items 1st 2nd 3rd 4th 5th 6th Total χ2
1. Maintaining appropriate food storage system
Yes 19
(59.4) 17 (53.1)
10 (31.3)
13 (40.6)
21 (65.6)
25 (78.1)
105 (54.7)
18.601**
No 13
(40.6) 15 (46.9)
22 (68.8)
19 (59.4)
11 (34.4)
7 (21.9)
87 (45.3)
2. Having thermometer in cooling, freezing, heating
Yes 22
(68.8) 20 (62.5)
21 (65.6)
19 (59.4)
20 (62.5)
20 (62.5)
122 (63.5)
0.719
No 10
(31.3) 12 (37.5)
11 (34.4)
13 (40.6)
12 (37.5)
12 (37.5)
70 (36.5)
3. Storing food and non-food separately
Yes 25
(78.1) 28 (87.5)
22 (68.8)
23 (71.9)
26 (81.3)
28 (87.5)
152 (79.2)
5.937
No 7
(21.9) 4 (12.5)
10 (31.3)
9 (28.1)
6 (18.8)
4 (12.5)
40 (20.8)
Total 32
(100.0) 32 (100.0)
32 (100.0)
32 (100.0)
32 (100.0)
32 (100.0)
192 (100.0)
** p<0.01.
의 전체 평균 점수는 88.51점(100점 만점)으로 조사되었으며, 방문 횟수가 증가할수록 회차별 총점이 증가하였다(p<0.01).
각 영역별 수행률이 낮은 항목들을 우선순위로 방문교육 및 집합교육, 통신교육 자료 등을 통해 지속적으로 관리하여 어 린이 급식소 위생관리가 개선될 수 있도록 해야 한다고 생각 되며, 위생․안전관리 평가 결과를 활용하여 다음 회차 순회 방문 시에 교육 자료 및 안내를 한다면 보다 더 빠른 위생․
안전관리 수행률을 높일 수 있을 것으로 판단된다.
요약 및 결론
본 연구는 칠곡군 일부 지역의 어린이급식소에 차수별 위 생․안전 순회방문 지도를 통해 위생관리 개선 효과를 평가 하며, 등록 어린이 급식소의 맞춤형 위생․안전관리 방안 모 색을 위한 기초자료를 제공하고자 실시하였으며, 그 결과는 다음과 같다.
본 연구의 조사결과, 어린이 급식소 32개소 모두 교실에서 배식하는 것으로 조사되었으며, 대부분의 급식소가 평가인 증을 받은 것으로 조사되었다. 순회방문 지도에 따른 어린이
급식소 위생․안전관리 수행률은 시설환경영역에서 전처리, 조리구역 분리 여부 항목이 순회방문 지도 횟수가 증가할수 록 수행률도 높아졌으며(p<0.05), 조리, 세척, 손 씻는 시설 등 설치 여부 항목이 순회방문 지도 횟수에 따라 유의적인 차이를 보였다(p<0.05). 개인위생영역에서 조리원 및 집단급 식소 설치․운영자의 건강진단 실시 여부 항목이 6회 평균이 77.6%로 다른 항목에 비해 낮은 수행률을 보였으나, 순회방 문 지도 횟수가 증가할수록 유의적으로 수행률이 증가하는 것을 확인할 수 있었다(p<0.01). 원료사용영역에서 무표시 원 료 사용(44.8%), 검사받지 않은 축산물 사용(58.9%) 항목의 수행률이 50% 미만으로 낮게 조사되었다. 공정관리영역에서 원료보관실 등 내부 청결 관리, 식재료 원산지 표기 여부, 칼․도마 구분사용 항목이 순회방문 지도 횟수가 증가할수 록 수행률이 유의적으로 증가하였으며(p<0.01), 가열조리하지 않는 음식의 식재료 염소소독 실시 항목도 순회방문 지도 횟 수가 증가할수록 수행률이 유의적으로 증가하였다(p<0.001).
보관관리영역에서 식품 등을 보관기준에 적합하게 관리 여 부 항목이 순회방문 지도 횟수에 따라 유의적인 차이를 보였 다(p<0.01). 위생․안전관리 영역별 총점을 비교한 결과, 시 Table 7. Comparison of the others to the frequency of food safety evaluation n(%)
Items 1st 2nd 3rd 4th 5th 6th Total χ2
1. Provided by cooking directly from the kitchen
Yes 32
(100.0) 31 (96.9)
32 (100.0)
32 (100.0)
32 (100.0)
32 (100.0)
191 (99.5)
5.026
No 0
(0.0) 1 (3.1)
0 (0.0)
0 (0.0)
0 (0.0)
0 (0.0)
1 (0.5)
2. Reuse of food provided
Yes 29
(90.6) 30 (93.8)
32 (100.0)
32 (100.0)
31 (96.9)
32 (100.0)
186 (96.9)
8.258
No 3
(9.4) 2 (6.3)
0 (0.0)
0 (0.0)
1 (3.1)
0 (0.0)
6 (3.1)
3. Preservation meal management method observation
Yes 19
(59.4) 26 (81.3)
17 (53.1)
15 (46.9)
19 (59.4)
19 (59.4)
115 (59.9)
8.955
No 13
(40.6) 6 (18.8)
15 (46.9)
17 (53.1)
13 (40.6)
13 (40.6)
77 (40.1)
4. Completion of food safety education of foodservice manager
Yes 21
(65.6) 28 (87.5)
24 (75.0)
28 (87.5)
28 (87.5)
28 (87.5)
157 (81.8)
9.399
No 11
(34.4) 4 (12.5)
8 (25.0)
4 (12.5)
4 (12.5)
4 (12.5)
35 (18.2)
5. Disinfect raw materials and product storage room of cooking room and food on a regular basis
Yes 29
(90.6) 28 (87.5)
30 (93.8)
27 (84.4)
32 (100.0)
30 (93.8)
176 (91.7)
6.273
No 3
(9.4) 4 (12.5)
2 (6.3)
5 (15.6)
0 (0.0)
2 (6.3)
16 (8.3)
Total 32
(100.0) 32 (100.0)
32 (100.0)
32 (100.0)
32 (100.0)
32 (100.0)
192 (100.0)
설환경의 회차별 평균 점수는 20.90점(22점 만점)이었으며, 개인위생은 6.11점(7점 만점)으로 회차별 유의적인 차이를 보였다(p<0.001). 원료사용의 회차별 평균 점수는 21.10점(24 점 만점)이었으며, 공정관리는 23.36점(26점 만점)으로 방문 횟수가 증가할수록 유의적으로 증가하였다(p<0.001). 보관관 리는 4.85점(7점 만점)으로 4회차부터 증가하였으며(p<0.05), 기타 사항은 12.19점(14점 만점)으로 나타났다. 회차별 총점 의 전체 평균 점수는 88.51점(100점 만점)으로 조사되었으며, 방문 횟수가 증가할수록 회차별 총점이 증가하였다(p<0.01).
어린이급식관리지원센터의 순회방문지도는 어린이 급식소 위생․안전관리 수행도를 일부 향상시키는데 기여했다고 판 단된다. 학교급식위생관리지침서와 같이 어린이급식소를 대 상으로 전체적으로 위생․안전관리에 도움이 될 수 있는 맞 춤형 위생관리 매뉴얼이 개발되어야 한다. 다른 항목들에 비 해 수행률이 낮은 항목들에 대해서는 센터에서 추후 교육 주 제 선정 시에 집중화 교육프로그램을 진행하며, 교육자료 개 발 시 동영상, 리플릿, Web 등 다양한 매체를 활용한 교육을 실시한다면 어린이급식소의 위생․안전관리 수행도를 향상 시키는데 도움이 될 것으로 사료된다.
참고문헌
An SJ, Moon HK (2015) Assessment and corrective measures of child-core foodservices by sanitary inspection checklist suggested by korea food and drug administration. J Korean Diet Assoc 21(3): 227-240.
Cho SH, Bae MA, Lee HS, Park SH (2014) Development of customized hygiene management manual for Bucheon chil- dren meal supply organization and evaluation of effects. J
East Asian Soc Dietary Life 24(2): 275-282.
Jo CY, Han JS (2018) Effects of a practice program for low-salt meals on infant foodservices-Focusing on infant foodservices registered in center for children’s foodservice management in busan metropolitan city-. J East Asian Soc Diet Life 28(1): 66-75.
Jo CY, Kim JH, Han JS (2015) Study on development and evaluation of nutritional education program for preschool children in association with center for children’s food- service management, childcare facilities and home. J East Asian Soc Dietary Life 25(2): 372-385.
Kim HY, Yang IS, Chae IS, Yi BS, Park MK, Kim HY, Kang TS, Leem DG, Lee JH, Lee HY (2013) Effectiveness of center for child-care foodservice management for menu management and dietary variety. Koren J Community Nutr 18(3): 243-256.
Kim JA, Lee YM (2014) The effect of a periodic visiting education program on food safety knowledge of cooks in children’s foodservice facilities. J Korean Diet Asscoc 20(1): 36-49.
Kim JB, Park YB, Kim KC, Kim DH, Kang SH, Lim SY, Park PH, Yoon MH, Lee JB (2011) Evaluation and reduction of microbiological hazard of spoon and spoon case carried by nursery school children. J Korean Soc Food Sci Nutr 40(1): 116-122.
Kim MH, Kim NH, Yeon JY (2017) A study on the current status and needs of nutrition education on children’s sugar intake reduction among the center for children’s food- service management and child care facilities. Korean J Table 8. Comparison of food safety performance according to the frequency of food safety evaluation
Items Total
score 1st 2nd 3rd 4th 5th 6th Total F-value
Facilities equipments 22 20.66±1.23 21.00±1.30 20.78±1.88 20.84±1.46 21.13±1.26 20.97±1.56 20.90±1.45 0.423 Personal hygiene 7 5.41±1.34c 6.09±1.42b 6.00±0.98b 6.28±1.14ab 6.03±1.26b 6.84±0.57a 6.11±1.22 5.189***
Food management 24 21.31±2.47 21.09±2.28 21.34±2.27 20.94±2.06 21.09±2.49 20.84±2.22 21.10±2.28 0.237 Preparation management 26 21.72±3.93b 22.09±2.84b 22.50±2.95b 24.16±2.07a 24.69±1.47a 25.00±1.52a 23.36±2.89 9.486***
Food storage 7 5.00±2.08ab 4.88±1.83ab 4.22±2.17b 4.25±2.08b 5.25±1.81ab 5.53±1.59a 4.85±1.97 2.401* The others 14 11.56±2.59 12.63±2.04 11.94±2.09 11.91±2.15 12.50±1.80 12.59±1.52 12.19±2.07 1.491
Total 100 85.66±9.83c 87.78±8.23c 86.78±7.44bc 88.38±6.36abc 90.69±5.27ab 91.78±4.87a 88.51±7.42 3.343**
1) Mean±S.D.
a∼c Different letters mean significant difference between groups by Duncan’s multiple range test.
* p<0.05, ** p<0.01, *** p<0.001.
Food Nutr 30(3): 539-551.
Kim SH, Oh EY, Han JS (2014) Effects of food safety management support of center for children’s foodservice management on foodservice facilities for children in Busan area. J East Asian Soc Dietary Life 24(2): 261-274.
Lee JH (2016) Effects of periodic visiting education support on nutririon and hygiene practices at center for children’s foodservice management-focus on Ulsan area-. J Korean Diet Assoc 22(1): 1-12.
Lee JY (2016) A comparison of hygiene and safety manage- ment execution depending on the characteristics of chil- dren's food service facilities. Korean J Food Nutr 29(4):
573-582.
Lee YM, Oh YJ (2005) Parents’ perceeption and attitudes to the school meal service program (SMSP) in kindergarten.
Korean J Community Nutrition 10(2): 141-150.
Ministry of Food and Drug Safety (2018a) The Status of Center for Children’s Foodservice Management. https://
ccfsm.foodnara.go.kr. Accessed August 30, 2018.
Ministry of Food and Drug Safety (2018b) Guidelines for Center for Children’s Foodservice Management for 2018.
Ministry of Government Legislation (2018) Special Act on Safety Control of Children’s Dietary Life.
Ministry of Health and Welfare (2017) Child Care Statistics.
http://www.korea.kr. (accessed 18. 8. 2018).
Moon HK (2017) Comparison of the sanitary inspection results and adenosine triphosphate (ATP) bioluminescence assay for equipment in children’s foodservices. Korean J
Food Cook Sci 33(4): 461-470.
Paik JE, Lee HA, Bae HJ (2015) The assessment of food safety practices and the effect of visiting education on food safety improcement in children’s foodservice facili- ties. Korean J Food Cook Sci 31(6): 764-772.
Park HN, Kim SM (2016) Salinity monitoring of soups of the institutions enrolled at center for children’s foodservice management. J East Asian Soc Diet Life 26(6): 507-516.
Park NY, Park HK, Park HJ, Seo MK, Im HR, Lim HH, Jung JH, Yoon KS (2011) Employee food-hygiene and nutrition awareness and performance at child care centers and kindergartens located in Seoul. Korean J Food Cookery Sci 27(2): 45-59.
Seo YJ, Jeon MS (2015) Effects of an education program on sanitation at centers for children’s food service manage- ment-Focusing on Jung-gu and Dong-gu regions of Daejeon metropolitan city-. Korean J Community Nutr 20(6): 447- 459.
Sohn CY, Park HO (2011) A survey on the foodservice management practices at child care centers in Gyeonggi area. J East Asian Soc Diet Life 21(4): 577-586.
Song ES, Kim EG (2010) The foodservice sanitation status of the child care centers at asan city in Chungnam. Korean J Community Nutr 15(6): 806-819.
Date Received Date Revised Date Accepted
Sep. 13, 2018 Oct. 15, 2018 Oct. 15, 2018