INTRODUCTION
Silent ischemia occurs in 20–40% of patients with stable and
unstable coronary syndromes. Unfortunately, for some pa- tients, their first clinical manifestation is when they go into sud- den cardiac arrest. Coronary artery calcium (CAC) score has emerged as a robust predictor of future coronary events in these asymptomatic primary prevention populations.1 This nonin- vasive technique has proven to be a reliable tool for estimating overall coronary plaque burden2 and to generally correlate well with the severity of coronary artery stenosis (CAD).2,3 However, in some cases, obstructive or even severe CAD has been detect- ed in patients with zero or very low (<10) calcium scores.4,5 These false negative patients should be carefully monitored and may need prompt intervention to prevent the progression of acute coronary syndrome. We aimed to evaluate clinical key predictors of severe CAD in this population and sought to de-
Predictors of Severe or Moderate Coronary Artery Disease in Asymptomatic Individuals with Extremely Low Coronary Calcium Scores
Hyung-Bok Park
1*, Hyeonju Jeong
2*, Ji Hyun Lee
2, Yongsung Suh
2, Eui-Seock Hwang
2, Yun-Hyeong Cho
2, and Deok-Kyu Cho
21Division of Cardiology, Department of Internal Medicine, International St. Mary’s Hospital, Catholic Kwandong University College of Medicine, Incheon;
2Division of Cardiology, Department of Internal Medicine, Myongji Hospital, Hanyang University College of Medicine, Goyang, Korea.
Purpose: To evaluate predictors of severe or moderate coronary artery disease (CAD) in individuals with zero or very low (<10) coronary artery calcium (CAC) scores.
Materials and Methods: The 1175 asymptomatic persons with zero or very low (<10) CAC scores were analyzed for CAD stenosis using coronary computed tomography angiography. Moderate and severe CADs were defined as having more than 50% and more than 70% stenosis in any of the major coronary arteries, respectively. Age, gender, body mass index, hypertension, type II diabetes, dyslipidemia, lipid profile, creatinine, and smoking status were evaluated as predictors for moderate and severe CAD.
Results: In the study population, moderate and severe CADs were found in 7.5% and 3.3%, respectively. Among evaluated risk factors, age [odds ratio (OR) 1.04, 95% confidence interval (CI) 1.02–1.07, p<0.001], current smoking status (OR 3.12, 95% CI 1.82–
5.34, p<0.001), and CAC 1–9 (OR 1.80, 95% CI 1.08–3.00, p=0.024) were significantly associated with moderate CAD. Meanwhile, age (OR 1.05, 95% CI 1.02–1.08, p=0.003), low high density lipoprotein (HDL) (OR 0.96, 95% CI 0.93–0.99, p=0.003), and current smoking status (OR 2.34, 95% CI 1.14–5.30, p=0.022) were found to be significantly associated with severe CAD. Improvement of discrimination power for predicting severe CAD was observed when smoking and HDL cholesterol were serially added into the age model.
Conclusion: Smoking showed significant correlations with moderate or severe CAD, and low HDL cholesterol also proved to be a predictor of severe CAD in asymptomatic individuals with extremely low CAC scores.
Key Words: Asymptomatic condition, coronary artery disease, calcium, computed tomography angiography
pISSN: 0513-5796 · eISSN: 1976-2437
Received: December 24, 2018 Revised: May 16, 2019 Accepted: May 28, 2019
Corresponding author: Deok-Kyu Cho, MD, Division of Cardiology, Department of Internal Medicine, Myongji Hospital, Hanyang University College of Medicine, 55 Hwasu-ro 14beon-gil, Deogyang-gu, Goyang 10475, Korea.
Tel: 82-31-810-5114, Fax: 82-31-969-0500, E-mail: [email protected]
*Hyung-Bok Park and Hyeonju Jeong contributed equally to this work.
•The authors have no potential conflicts of interest to disclose.
© Copyright: Yonsei University College of Medicine 2019
This is an Open Access article distributed under the terms of the Creative Com- mons Attribution Non-Commercial License (https://creativecommons.org/licenses/
by-nc/4.0) which permits unrestricted non-commercial use, distribution, and repro- duction in any medium, provided the original work is properly cited.
Yonsei Med J 2019 Jul;60(7):619-625 https://doi.org/10.3349/ymj.2019.60.7.619
velop better prediction models for the detection of severe CAD combined with clinical risk factors.
MATERIALS AND METHODS
Study population and data collection
The institutional review board of Myongji Hospital approved this study and waived the requirement for informed patient consent (IRB number: MJH-16-098). In this retrospective and observational study, from April 2011 to April 2016, we consec- utively enrolled 3022 asymptomatic subjects who underwent coronary computed tomography angiography (CTA) with cor- onary calcium scan at the same time during health check-ups or outpatient clinics in Myongji Hospital. Among those popu- lations, 1231 subjects with CAC scores of zero or less than 10 were enrolled. Males or females were excluded from the study if they were younger than 20 years or older than 80 years or had previous history of CAD, such as myocardial ischemia/in- farction, percutaneous coronary intervention, or coronary ar- tery bypass graft surgery. Poor quality CTA images were also ex- cluded (n=55). Hence, a total of 1176 subjects were analyzed for CAD using CTA. Clinical risk factors, such as age, gender, body mass index (BMI), hypertension (HTN), type II diabetes mellitus (DM), dyslipidemia, lipid profile, and smoking status, were evaluated as predictors for severe CAD.
Measurement of CAC and CTA
For coronary calcium scan and CTA, we used a 64 multi-detec- tor computed tomography scanner (Lightspeed Volume CT, GE Healthcare, Milwaukee, WI, USA). One hour prior to the CT scan, we administered 100 mg of atenolol to patients who had heart rates of more than 65 beats/min. Immediately be- fore scanning, 0.6-mg sublingual nitroglycerin was given to all patients. Coronary calcium scan was performed before CTA scanning. The calcium scan parameters were as follows: pro- spective electrocardiogram-triggered at 70% of the R-R inter- val, 2.5-mm slice thickness, a gantry rotation time of 350 ms, a tube voltage of 120 kVp, and a tube current of 200–250 mA (de- pending on the patient’s BMI). CAC score was calculated ac- cording to the Agatston method.6 The analysis was performed using a commercially available external workstation (Advan- tage Windows, version 4.2, GE Healthcare, Milwaukee, WI, USA), as well as CAC scoring software (Smartscore 3.5, GE Health- care, Milwaukee, WI, USA). Moderate and severe CAD were de- fined as having more than 50% or more than 70% stenosis in any of the major coronary arteries, respectively.
Statistical analysis
Data are reported as mean±standard deviation for continuous variables and as counts with proportions (%) for categorical variables. Continuous variables were compared using an un- paired t-test for normally distributed variables or the Mann-
Whitney U test for non-normally distributed variables. Cate- gorical variables were examined by Pearson’s chi-square or Fisher’s exact test. Global chi-square analyses utilized logistic regressions and likelihood ratios tests. Univariable and multi- variable odds ratios (ORs) estimates with 95% confidence in- tervals (95% CIs) were analyzed to evaluate predictors of moderate and severe CAD. Among univariate analysis, signifi- cant variables (p value<0.05) were tested in multivariate anal- ysis, except age and gender. Ten-fold cross-validated estimates of the area under the receiver operating characteristic curve (AUC) models were employed to evaluate the discrimination of severe CAD. The estimates were using the method pro- posed by DeLong, et al.7 Statistical analyses were performed using MedCalc software (version 17.6; MedCalc Software, Mar- iakerke, Belgium).
RESULTS
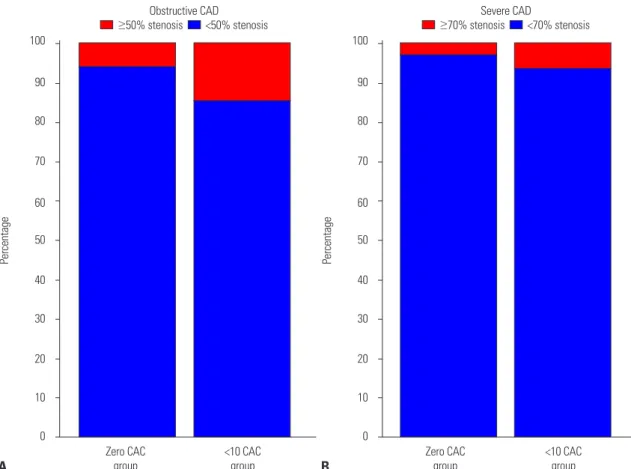
Among the 1176 subjects, 47.2% (n=555) were male, with a mean age of 56.5±12.3. The mean CAC was 0.8±2.1, and zero CAC was observed in 82.7% (n=972). Moderate (≥50%) CAD was present in 7.5% (n=88) and severe (≥70%) CAD in 3.3%
(n=39) of the total population on CTA. Moderate (14.7% vs.
6.0%, p<0.001) and severe CAD (6.4% vs. 2.7%, p=0.014) were found to be two- to three-fold higher in the non-zero (1 to 9) CAC group than in the zero CAC group (Fig. 1). We found that 37.3% (n=439) of the total population had HTN, 12.1% (n=142) had DM, and 41.9% (n=493) presented with dyslipidemia.
Statin use status was recorded in 30.0% (n=459), and 20.0% (n=
235) were current smokers.
Moderate stenosis (≥50%) CAD by CTA
When divided into two groups, the group with ≥50% stenosis by CTA (the obstructive CAD group) was older (61.6±10.7 vs.
56.1±12.3, p<0.001), was male predominant (62.5% vs. 46.0%, p=0.004), had more DM (21.6% vs. 11.3%, p=0.007), had lower high density lipoprotein (HDL) (47.0±14.4 vs. 52.1±14.4, p=
0.002), and had fewer subjects with zero CAC (34.1% vs.
16.0%, p<0.001), compared to the non-obstructive CAD group (Table 1). In univariate analysis, age (OR 1.04, 95% CI 1.02–
1.06, p<0.001), male (OR 1.96, 1.25–3.07), DM (OR 2.16, 1.26–
3.71, p=0.005), low HDL cholesterol (OR 0.97, 0.96–0.99, p=
0.002), current smoking status (OR 3.43, 2.19–5.39, p<0.001), and non-zero CAC (OR 2.72, 1.70–4.35, p<0.001) were associ- ated with obstructive CAD (Table 2). In multivariate analysis, age (OR 1.04, 95% CI 1.02–1.07, p<0.001), current smoking status (OR 3.12, 1.82–5.34, p<0.001), and non-zero CAC (OR 1.80, 1.08–3.00, p=0.024) were significantly associated with ob- structive CAD (Table 2).
Severe stenosis (≥70%) CAD by CTA
The severe CAD group had a stronger likelihood of being old-
Table 1. Baseline Patient Characteristics according to CAD Severity
CAC≤10 (n=1176)
≥50% stenosis (n=88, 7.5%)
<50% stenosis
(n=1088, 92.5%) p value ≥70% stenosis (n=39, 3.3%)
<70% stenosis
(n=1137, 96.7%) p value
Age (yr) 61.6±10.7 56.1±12.3 <0.001 62.4±11.2 56.3±12.3 0.002
Male (n, %) 55 (62.5) 500 (46.0) 0.004 24 (61.5) 531 (46.7) 0.10
BMI 24.3±3.3 24.8±3.7 0.22 23.7±3.2 24.8±3.7 0.056
DM (n, %) 19 (21.6) 123 (11.3) 0.007 9 (23.1) 133 (11.7) 0.058
HTN (n, %) 39 (44.3) 400 (36.8) 0.20 14 (35.9) 425 (37.4) 0.98
Dyslipidemia (n, %) 32 (36.4) 461 (42.4) 0.32 11 (28.2) 482 (42.4) 0.11
Statin use (n, %) 31 (35.3) 428 (39.3) 0.52 11 (28.2) 448 (39.4) 0.21
LDL cholesterol (mg/dL) 104.3±37.3 109.7±35.2 0.18 105.2±41.9 109.4±35.2 0.47
HDL cholesterol (mg/dL) 47.0±14.4 52.1±14.4 0.002 42.9±9.2 52.0±14.5 <0.001
TG (mg/dL) 145.1±85.6 141.7±114.4 0.79 144.4±68.5 141.9±113.6 0.89
Creatinine (mg/dL) 1.0±0.3 1.0±0.7 0.27 1.1±0.3 1.0±0.7 0.25
Current smoking (n, %) 38 (43.2) 197 (18.1) <0.001 16 (41.0) 219 (19.3) 0.002
CAC score 1–9 (n, %) 30 (34.1) 174 (16.0) <0.001 13 (33.3) 191 (16.8) 0.014
LM disease 2 - - 0 - -
CAD 1VD 53 - - 23 - -
CAD 2VD 31 - - 12 - -
CAD 3VD 4 - - 4 - -
PCI 23 - - 22 - -
CAD, coronary artery disease; CAC, coronary artery calcium; BMI, body mass index; DM, diabetes mellitus; HTN, hypertension; LDL, low density lipoprotein; HDL, high density lipoprotein; TG, triglyceride; LM, left main; VD, vessel disease; PCI, percutaneous coronary intervention.
Values are presented as mean±standard or n (%) deviation unless otherwise indicated.
100
90 80 70
60 50 40 30 20 10 0
100
90 80 70
60 50 40 30 20 10
0 Zero CAC
group Zero CAC
group
<10 CAC
group <10 CAC
group
Percentage Percentage
A B
Obstructive CAD
≥50% stenosis <50% stenosis Severe CAD
≥70% stenosis <70% stenosis
Fig. 1. Prevalence of moderate CAD (A) and severe CAD (B) between the less than 10 CAC score group and zero CAC score group. CAD, coronary ar- tery disease; CAC, coronary artery calcium.
er (62.4±11.2 vs. 56.3±12.3, p=0.002) with lower HDL (42.9±9.2 vs. 52.0±14.5, p<0.001) than the non-severe CAD group (Table 1).
Univariate analysis showed age (OR 1.04, 95% CI 1.01–1.07, p=0.003), DM (OR 2.26, 1.05–4.87, p=0.037), low HDL choles- terol (OR 0.95, 0.92–0.97, p<0.001), current smoking status (OR 2.92, 95% CI 1.51–5.61, p=0.001), and non-zero CAC (1–9) score (OR 2.48, 95% CI 1.25–4.91, p=0.009) to be significantly associ- ated with severe CAD (Table 3). However, only age (OR 1.05, 95% CI 1.02–1.08, p=0.003), low HDL (OR 0.96, 95% CI 0.93–
0.99, p=0.003), and current smoking status (OR 2.45, 95% CI 1.14–5.30, p=0.022) were found to be significantly associated with severe CAD in multivariate analysis (Table 3). Improve-
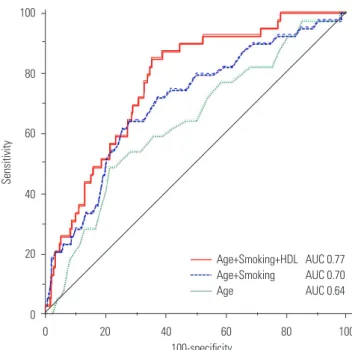
ment of discrimination power for predicting severe CAD was observed when smoking and HDL cholesterol were serially added into the age model: the AUC value was higher in the
“Age+Smoking+HDL cholesterol” model when compared to the “Age+Smoking” model (AUC 0.77, 95% CI 0.74–0.80 vs. AUC 0.70, 95% CI 0.67–0.73, p=0.020) (Fig. 2).
Zero CAC analysis
Among the 972 people in the zero CAC group, 6.0% (n=58) had obstructive CAD and 2.7% (n=26) had severe CAD (Fig. 1, Ta- bles 4 and 5). Age, males, DM, low HDL cholesterol, and cur- rent smoking status were associated with severe CAD in uni-
Table 2. Univariate and Multivariate Aanalysis for Detecting Moderate (≥50% stenosis) CAD CAC≤10 (n=1176)
Univariate Multivariate
Moderate CAD (odds ratio) 95% CI p value Moderate CAD (odds ratio) 95% CI p value
Age 1.04 1.02–1.06 <0.001 1.04 1.02–1.07 <0.001
Male 1.96 1.25–3.07 0.003 1.67 0.96–2.91 0.072
BMI 0.96 0.90–1.02 0.22 - - -
DM 2.16 1.26–3.71 0.005 1.24 0.69–2.24 0.48
HTN 1.37 0.88–2.12 0.16 - - -
Dyslipidemia 0.78 0.50–1.22 0.27 - - -
Statin use 0.84 0.53–1.32 0.45 - - -
LDL cholesterol 1.00 0.99–1.00 0.18 - - -
HDL cholesterol 0.97 0.96–0.99 0.002 0.99 0.97–1.01 0.30
TG 1.00 0.99–1.00 0.79 - - -
Creatinine 1.12 0.90–1.40 0.30 - - -
Current smoking 3.43 2.19–5.39 <0.001 3.12 1.82–5.34 <0.001
CAC score 1–9 2.72 1.70–4.35 <0.001 1.80 1.08–3.00 0.024
CAD, coronary artery disease; CAC, coronary artery calcium; CI, confidence interval; BMI, body mass index; DM, diabetes mellitus; HTN, hypertension; LDL, low density lipoprotein; HDL, high density lipoprotein; TG, triglyceride.
Table 3. Univariate and Multivariate Analysis for Detecting Severe (≥70% Stenosis) CAD CAC≤10 (n=1176)
Univariate Multivariate
Severe CAD (odds ratio) 95% CI p value Severe CAD (odds ratio) 95% CI p value
Age 1.04 1.01–1.07 0.003 1.05 1.02–1.08 0.003
Male 1.83 0.95–3.52 0.07 1.50 0.68–3.32 0.32
BMI 0.91 0.82–1.00 0.054 - - -
DM 2.26 1.05–4.87 0.037 1.24 0.55–2.78 0.60
HTN 0.94 0.48–1.82 0.85 - - -
Dyslipidemia 0.53 0.26–1.08 0.082 - - -
Statin use 0.60 0.30–1.23 0.163 - - -
LDL cholesterol 1.00 0.99–1.01 0.47 - - -
HDL cholesterol 0.95 0.92–0.97 <0.001 0.96 0.93–0.99 0.003
TG 1.00 1.00–1.00 0.89 - - -
Creatinine 1.15 0.89–1.50 0.29 - - -
Current smoking 2.92 1.51–5.61 0.001 2.45 1.14–5.30 0.022
CAC score 1–9 2.48 1.25–4.91 0.009 1.50 0.73–3.11 0.27
CAD, coronary artery disease; CAC, coronary artery calcium; CI, confidence interval; BMI, body mass index; DM, diabetes mellitus; HTN, hypertension; LDL, low density lipoprotein; HDL, high density lipoprotein; TG, triglyceride.
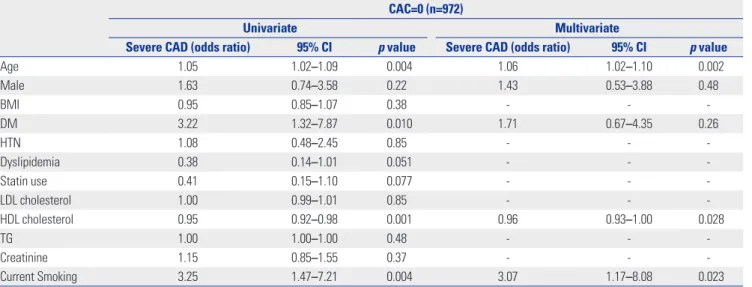
variate analysis (Table 5). When adjusted for these variables, age (OR 1.06, 95% CI 1.02–1.10, p=0.002), low HDL cholesterol (OR 0.96, 95% CI 0.93–1.00, p=0.003), and current smoking status (OR 3.07, 95% CI 1.17–8.08, p=0.023) were significant independent predictors for severe CAD in multivariate analy- sis (Table 5), which was in line with the less than CAC analyses.
In this analysis, current smoking status was a consistent predic- tor for obstructive CAD (OR 3.82, 95% CI 1.95–7.49, p<0.001) and severe CAD. However, low HDL cholesterol was a signifi- cant predictor for severe CAD, while it was not for obstructive
CAD. The suggested cut-off value of low HDL cholesterol level to predict the presence of severe CAD was 46 mg/dL, with a sensitivity of 74.4% and a specificity of 61.9%.
DISCUSSION
Individuals with extremely low or even zero CAC are usually considered as free of significant CAD, especially those who are asymptomatic. Infrequently, however, serious CAD is ob- served in this population, which is a concern since a false neg- ative study might cause optimal treatment times to be missed.
In this study, we sought to find any clinical clues for prediction of such serious CAD in these falsely diagnosed populations by evaluating clinical CAD risk factors to identify any additional associations with moderate or severe CAD by CTA. We found that extremely small calcification, such as a CAC score of 1 to 9, itself was associated with moderate CAD, but not indepen- dently associated with severe CAD, compared with zero CAC.
Age, current smoking status, and extremely small calcification (CAC 1–9) were independently associated with moderate CAD. In addition, age, low HDL cholesterol, and current smok- ing status were shown to be independently associated with se- vere CAD. We also discovered that current smoking status was a significant predictor of moderate and severe CAD among the less than 10 CAC and even in the zero CAC population. Inter- estingly enough, low HDL cholesterol was only a significant pre- dictor of severe CAD, not moderate CAD, among the less than 10 CAC or even in the zero CAC group. Moreover, a cut-off value of 46 mg/dL of HDL cholesterol showed a sensitivity of 74.4%
and specificity of 61.9% for the prediction of severe CAD.
Coronary artery calcification indicates the presence of active inflammation or the stabilization of atherosclerotic plaque, and the total amount of coronary artery calcification is strongly 100
80
60
40
20
0
0 20 40 60 80 100 100-specificity
Sensitivity
Age+Smoking+HDL AUC 0.77 Age+Smoking AUC 0.70 Age AUC 0.64
Fig. 2. Comparison of C-statistics among the “Age+Smoking+HDL cho- lesterol” vs. “Age+Smoking” vs. “Age” model for predicting severe CAD. HDL, high density lipoprotein; CAD, coronary artery disease; AUC, area under the receiver operating characteristic curve.
Table 4. Univariate and Multivariate Analysis for Detecting Moderate (≥50% Stenosis) CAD in the Zero CAC Population CAC=0 (n=972)
Univariate Multivariate
Moderate CAD (odds ratio) 95% CI p value Moderate CAD (odds ratio) 95% CI p value
Age 1.04 1.02–1.07 <0.001 1.06 1.03–1.09 <0.001
Male 1.86 1.08–3.20 0.023 1.68 0.84–3.37 0.15
BMI 0.99 0.92–1.07 0.78 - - -
DM 2.91 1.54–5.52 0.001 1.84 0.91–3.73 0.090
HTN 1.71 1.00–2.93 0.049 0.86 0.46–1.61 0.63
Dyslipidemia 0.63 0.35–1.12 0.12 - - -
Statin use 0.72 0.40–1.28 0.26 - - -
LDL cholesterol 1.00 0.99–1.01 0.63 - - -
HDL cholesterol 0.97 0.95–0.99 0.011 0.99 0.97–1.01 0.25
TG 1.00 1.00–1.00 0.79 - - -
Creatinine 1.13 0.88–1.44 0.33 - - -
Current smoking 3.86 2.24–6.65 <0.001 3.82 1.95–7.49 <0.001
CAD, coronary artery disease; CAC, coronary artery calcium; CI, confidence interval; BMI, body mass index; DM, diabetes mellitus; HTN, hypertension; LDL, low density lipoprotein; HDL, high density lipoprotein; TG, triglyceride.
related to the total coronary plaque burden.8-10 Accordingly, coronary calcium scan has been established as a robust non- invasive CAD screening method, especially in the primary pre- vention population. Recently, several studies have demonstrat- ed that CAC is a far superior discriminatory marker than global cardiovascular clinical risk factors.11-13 Many studies have also shown that CAC is directly proportional to the severity of CAD.2,13 However, severe CAD has been found in a consider- able number of patients with low CAC.4,5,14 The incidences of significant CAD in patients with zero or very low CAC have var- ied in previous reports.15 Gottlieb, et al.5 reported that 19% had obstructive CAD (≥50%) among the symptomatic zero CAC population (n=291). However, Rubinshtein, et al.16 and Kou- laouzidis, et al.15 reported incidences of 7% (n=231) and 0.9%
(n=447), respectively, within the same symptomatic zero CAC population. As for the asymptomatic population, Choi, et al.4 and Lee, et al.17 reported incidences of 5% (n=1000) and 0.7%
(n=6531), respectively. In our study, obstructive CAD and se- vere CAD were identified in 6.0% and 2.7% of 972 asymptom- atic subjects with zero CAC, respectively. In subjects with a less than 10 CAC score (n=1176), 7.5% were found to have ob- structive CAD and 3.3% severe CAD. Hence, as with the symp- tomatic population, significant CAD cannot be ruled out in asymptomatic individuals with zero CAC.
We found that, among traditional CAD risk factors, current smoking status was the strongest risk factor for obstructive CAD and severe CAD patients, while low HDL cholesterol was the strongest predictor associated with severe CAD. Smoking is an established CAD risk factor.18 It is also known that smoking leads to a decreased HDL cholesterol level through the dys- function of lipid transport enzymes.19 In this study, low HDL and smoking seemed to be related with and have an effect on the development of coronary atherosclerosis. In addition, smok- ing can cause endothelial dysfunction, enhance platelet ag-
gregation, and impair fibrinolysis.18 These alterations may be responsible for the increased prevalence and severity of throm- botic cardiovascular events in cigarette smokers.20
There are several limitations to our study. First, the number of patients was relatively small. In addition, it was limited to a single center study. It is necessary to follow up with a larger number of patients from a multi-center study to confirm our results. Second, the study was a retrospective study. Thus, sim- ilar to other retrospective studies, self-referral bias was a signif- icant limitation. Third, various ethnicities were not considered in this study. Finally, plaque characteristics and prognostic in- formation were not included in this analysis due to its cross- sectional study design. Long-term follow up of prognoses with plaque characteristics might be needed to ascertain further clinical implications.
In conclusion, our analysis demonstrated that smoking is most strongly correlated with obstructive or severe CAD, even in asymptomatic individuals with extremely low CAC scores.
Low HDL cholesterol levels were also found to be a powerful predictor of severe CAD in the same subjects. These factors might be useful indicators worthy of consideration when screening for CAD in asymptomatic people.
AUTHOR CONTRIBUTIONS
Conceptualization: HBP, HJJ, YHC, and DKC. Data curation: HBP, HJJ, JHL, YSS, ESH, YHC, and DKC. Formal analysis: HBP, HJJ, and DKC.
Funding acquisition: DKC. Investigation: HBP, HJJ, JHL, YSS, ESH, YHC, and DKC. Methodology: HBP, HJJ, JHL, YSS, ESH, YHC, and DKC. Project administration: HBP, HJJ, JHL, YHC, and DKC. Resourc- es: HBP, HJJ, JHL, YSS, ESH, YHC, and DKC. Software: HBP, HJJ, and DKC. Supervision: HBP, HJJ, YHC, and DKC. Validation: HBP, HJJ, JHL, YSS, ESH, YHC, and DKC. Visualization: HBP and HJJ. Writing—
original draft: HBP, HJJ, and DKC. Writing—review & editing: HBP, HJJ, JHL, YSS, ESH, YHC, and DKC.
Table 5. Univariate and Multivariate Analysis for Detecting Severe (≥70% Stenosis) CAD in the Zero CAC Population CAC=0 (n=972)
Univariate Multivariate
Severe CAD (odds ratio) 95% CI p value Severe CAD (odds ratio) 95% CI p value
Age 1.05 1.02–1.09 0.004 1.06 1.02–1.10 0.002
Male 1.63 0.74–3.58 0.22 1.43 0.53–3.88 0.48
BMI 0.95 0.85–1.07 0.38 - - -
DM 3.22 1.32–7.87 0.010 1.71 0.67–4.35 0.26
HTN 1.08 0.48–2.45 0.85 - - -
Dyslipidemia 0.38 0.14–1.01 0.051 - - -
Statin use 0.41 0.15–1.10 0.077 - - -
LDL cholesterol 1.00 0.99–1.01 0.85 - - -
HDL cholesterol 0.95 0.92–0.98 0.001 0.96 0.93–1.00 0.028
TG 1.00 1.00–1.00 0.48 - - -
Creatinine 1.15 0.85–1.55 0.37 - - -
Current Smoking 3.25 1.47–7.21 0.004 3.07 1.17–8.08 0.023
CAD, coronary artery disease; CAC, coronary artery calcium; CI, confidence interval; BMI, body mass index; DM, diabetes mellitus; HTN, hypertension; LDL, low density lipoprotein; HDL, high density lipoprotein; TG, triglyceride.
ORCID iDs
Hyung-Bok Park https://orcid.org/0000-0002-3773-2665 Hyeonju Jeong https://orcid.org/0000-0002-7916-3624 Ji Hyun Lee https://orcid.org/0000-0003-1831-6735 Yongsung Suh https://orcid.org/0000-0002-1975-123X Eui-Seock Hwang https://orcid.org/0000-0002-3025-8921 Yun-Hyeong Cho https://orcid.org/0000-0001-7581-9545 Deok-Kyu Cho https://orcid.org/0000-0002-3881-411X
REFERENCES
1. Hecht HS. Coronary artery calcium scanning: past, present, and future. JACC Cardiovasc Imaging 2015;8:579-96.
2. Iwasaki K, Matsumoto T. Relationship between coronary calcium score and high-risk plaque/significant stenosis. World J Cardiol 2016;8:481-7.
3. Alluri K, Joshi PH, Henry TS, Blumenthal RS, Nasir K, Blaha MJ.
Scoring of coronary artery calcium scans: history, assumptions, current limitations, and future directions. Atherosclerosis 2015;
239:109-17.
4. Choi EK, Choi SI, Rivera JJ, Nasir K, Chang SA, Chun EJ, et al. Cor- onary computed tomography angiography as a screening tool for the detection of occult coronary artery disease in asymptomatic individuals. J Am Coll Cardiol 2008;52:357-65.
5. Gottlieb I, Miller JM, Arbab-Zadeh A, Dewey M, Clouse ME, Sara L, et al. The absence of coronary calcification does not exclude obstructive coronary artery disease or the need for revasculariza- tion in patients referred for conventional coronary angiography. J Am Coll Cardiol 2010;55:627-34.
6. Agatston AS, Janowitz WR, Hildner FJ, Zusmer NR, Viamonte M Jr, Detrano R. Quantification of coronary artery calcium using ul- trafast computed tomography. J Am Coll Cardiol 1990;15:827-32.
7. DeLong ER, DeLong DM, Clarke-Pearson DL. Comparing the ar- eas under two or more correlated receiver operating characteristic curves: a nonparametric approach. Biometrics 1988;44:837-45.
8. Rumberger JA, Simons DB, Fitzpatrick LA, Sheedy PF, Schwartz RS. Coronary artery calcium area by electron-beam computed to- mography and coronary atherosclerotic plaque area. A histopath- ologic correlative study. Circulation 1995;92:2157-62.
9. Sangiorgi G, Rumberger JA, Severson A, Edwards WD, Gregoire J, Fitzpatrick LA, et al. Arterial calcification and not lumen stenosis is highly correlated with atherosclerotic plaque burden in humans: a histologic study of 723 coronary artery segments using nondecalci-
fying methodology. J Am Coll Cardiol 1998;31:126-33.
10. Libby P. Mechanisms of acute coronary syndromes and their im- plications for therapy. N Engl J Med 2013;368:2004-13.
11. Hayward RA, Krumholz HM, Zulman DM, Timbie JW, Vijan S.
Optimizing statin treatment for primary prevention of coronary artery disease. Ann Intern Med 2010;152:69-77.
12. Yeboah J, McClelland RL, Polonsky TS, Burke GL, Sibley CT, O’Leary D, et al. Comparison of novel risk markers for improve- ment in cardiovascular risk assessment in intermediate-risk indi- viduals. JAMA 2012;308:788-95.
13. Budoff MJ, Nasir K, McClelland RL, Detrano R, Wong N, Blumen- thal RS, et al. Coronary calcium predicts events better with absolute calcium scores than age-sex-race/ethnicity percentiles: MESA (Multi-Ethnic Study of Atherosclerosis). J Am Coll Cardiol 2009;53:
345-52.
14. Villines TC, Hulten EA, Shaw LJ, Goyal M, Dunning A, Achenbach S, et al. Prevalence and severity of coronary artery disease and ad- verse events among symptomatic patients with coronary artery calcification scores of zero undergoing coronary computed to- mography angiography: results from the CONFIRM (Coronary CT Angiography Evaluation for Clinical Outcomes: An International Multicenter) registry. J Am Coll Cardiol 2011;58:2533-40.
15. Koulaouzidis G, Charisopoulou D, Jenkins PJ, Koulaouzidis A, McArthur T. Prevalence of noncalcified coronary plaque in pa- tients with calcium score of 0: the silent enemy. Angiology 2013;64:
205-10.
16. Rubinshtein R, Gaspar T, Halon DA, Goldstein J, Peled N, Lewis BS. Prevalence and extent of obstructive coronary artery disease in patients with zero or low calcium score undergoing 64-slice cardi- ac multidetector computed tomography for evaluation of a chest pain syndrome. Am J Cardiol 2007;99:472-5.
17. Lee MS, Chun EJ, Kim KJ, Kim JA, Yoo JY, Choi SI. Asymptomatic subjects with zero coronary calcium score: coronary CT angio- graphic features of plaques in event-prone patients. Int J Cardio- vasc Imaging 2013;29 Suppl 1:29-36.
18. Katsiki N, Papadopoulou SK, Fachantidou AI, Mikhailidis DP.
Smoking and vascular risk: are all forms of smoking harmful to all types of vascular disease? Public Health 2013;127:435-41.
19. Chelland Campbell S, Moffatt RJ, Stamford BA. Smoking and smoking cessation- the relationship between cardiovascular dis- ease and lipoprotein metabolism: a review. Atherosclerosis 2008;
201:225-35.
20. Leone A. Smoking, haemostatic factors, and cardiovascular risk.
Curr Pharm Des 2007;13:1661-7.