Evaluation of the Effect of Hemoglobin or Hematocrit Level on Dural Sinus Density Using Unenhanced Computed Tomography
Seung Young Lee,
1Sang-Hoon Cha,
1Sung-Hyun Lee,
2and Dong-Ick Shin
2Departments of 1Radiology and 2Neurology, College of Medicine, Chungbuk National University, Cheongju, Korea.
Received: October 17, 2011 Revised: March 5, 2012 Accepted: March 9, 2012
Corresponding author: Dr. Seung Young Lee, Department of Radiology, College of Medicine, Chungbuk National University,
776, 1st sunwhan-ro, Heungdeok-gu, Cheongju 361-711, Korea.
Tel: 82-43-269-6472 , Fax: 82-43-269-6479 E-mail: [email protected]
∙ The authors have no financial conflicts of interest.
© Copyright:
Yonsei University College of Medicine 2013 This is an Open Access article distributed under the terms of the Creative Commons Attribution Non- Commercial License (http://creativecommons.org/
licenses/by-nc/3.0) which permits unrestricted non- commercial use, distribution, and reproduction in any medium, provided the original work is properly cited.
Purpose: To identify the relationship between hemoglobin (Hgb) or hematocrit (Hct) level and dural sinus density using unenhanced computed tomography (UECT). Materials and Methods: Patients who were performed UECT and had re- cords of a complete blood count within 24 hours from UECT were included (n=122). We measured the Hounsfield unit (HU) of the dural sinus at the right sig- moid sinus, left sigmoid sinus and 2 points of the superior sagittal sinus. Quantitative measurement of dural sinus density using the circle regions of interest (ROI) method was calculated as average ROI values at 3 or 4 points. Simple regression analysis was used to evaluate the correlation between mean HU and Hgb or mean HU and Hct. Results: The mean densities of the dural sinuses ranged from 24.67 to 53.67 HU (mean, 43.28 HU). There was a strong correlation between mean density and Hgb level (r=0.832) and between mean density and Hct level (r=0.840). Conclu- sion: Dural sinus density on UECT is closely related to Hgb and Hct levels. There- fore, the Hgb or Hct levels can be used to determine whether the dural sinus density is within the normal range or pathological conditions such as venous thrombosis.
Key Words: Dural sinus, density, CT, hemoglobin, hematocrit
INTRODUCTION
Pathological conditions involving the dural sinuses are uncommon, but cases of dural sinus thrombosis (DST) or cerebral venous thrombosis (CVT), with an annu- al incidence of 3 to 4 cases per million adults, are not unusual.1 These cases ac- count for approximately 1-2% of all strokes in adults and affect all age groups.2 DST often presents with highly variable symptoms such as headache, dizziness, visual disturbance, focal neurologic deficits, seizures, and impaired conscious- ness.3-7 DST has a wide clinical spectrum and onset is often subacute; therefore, the average delay from the onset of symptoms to diagnosis is 7 days.1,8
Unenhanced computed tomography (UECT) is the first imaging modality for patients presenting with variable neurologic symptoms. One direct sign of DST, the cord sign is defined as a homogeneous, hyperattenuated appearance of intrave- nous thrombi in dural sinuses or veins which reflects newly-formed thrombi with- in 1 week of disease onset. The cord sign is visualized in less than 25% of DST
roview 5.3 (Infinitt Co., Seoul, Korea) Picture Archiving and Communication System by one neuroradiologist to elimi- nate inter-operator variability. Axial scans that showed the fewest beam hardening artifacts were selected for analysis.
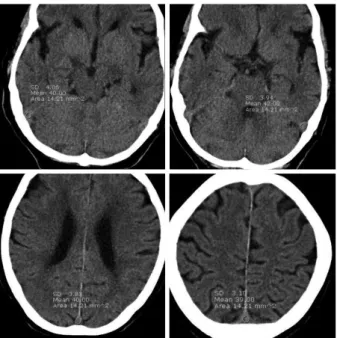
The dural sinus densities were measured using the circle re- gions of interest (ROI) method at 3 or 4 points including the right SS, left SS and 2 points of the SSS (upper 1/2 and lower 1/2 of dorsal SSS) on axial sections. One or both SS were required for use in the ROI measurement. The ROI area was set to a limit of 10-20 mm2 and we used a circular ROI area as large as possible that could be measured at three or more points. Identical circular ROIs in one patient were used by copying and pasting (Fig. 1).
The exclusion criteria of UECT during image interpreta- tion were as follows: cases in which the ROI could not be measured in both SS and in at least 3 points because of sig- nificant artifacts such as beam hardening or partial volume, undifferentiated sinuses with brain parenchyma, or small dural sinuses <10 mm2. The mean value of sinus density measured at 3 or 4 points was calculated.
Laboratory data
CBC results were obtained from the electronic in-hospital data base of clinical records. Only patients who had the re- sults of CBC results acquired within 24 h before or after UECT were included in this study. If one or more CBC re- sults were available from that 24 h period, the data with the shortest time interval from UECT was used. Hgb and Hct cases. The qualitative signs of CVT have been described in
some studies.9-12 However, ‘hyperattenuation’ is a qualita- tive and subjective finding.
We are usually able to observe the variability of dural sinus density using UECT in routine practice. Therefore, a notice- ably high or low density of dural sinuses can confuse nor- mality with pathologic conditions. To our knowledge, only three studies have focused on quantitative measurement of the density of normal superior sagittal sinus (SSS).12-14 How- ever, SSS cannot be representative of the whole dural sinus.
In this study, we quantitatively measured the density of dural sinus including the sigmoid sinuses (SS) in normal popula- tions and evaluated the effect of hemoglobin (Hgb) or hema- tocrit (Hct) on variability of dural sinus density on UECT.
MATERIALS AND METHODS
Inclusion and exclusion criteria
The 122 patients included in this study were admitted to our institution between January 2009 and, April 2009. In- clusion criteria consisted of patients with UECT of the brain and a complete blood count (CBC) test acquired within a 24-hour period, regardless of patient symptoms or signs.
However, patients who were clinically suspected to have DST were excluded. Exclusion criteria included intracrani- al hemorrhage or skull fracture adjacent to dural sinuses, an increased intracranial pressure condition such as hydro- cephalus, severe brain swelling, intra-axial or extra-axial mass, recent interventional or surgical treatment, intrave- nous or intraarterial iodinated contrast media administration within the previous 24 h. Patients receving a blood transfu- sion within the previous 24 h were also excluded.
UECT imaging protocol
UECT was performed using a 64-detector row CT scanner (Brilliance 64, Philips Medical Systems, Best, the Nether- lands) using axial or helical methods. In the axial method, the gantry tilt was parallel to the orbito-meatal line, and in helical method, the images were reconstructed parallel to the line. The following parameters were used: a peak kilo- voltage of 120 kVp, variable tube currents (179-450 mA) from an automatic exposure system, section thickness of 5 mm, and a reconstruction increment of 5 mm.
Image interpretation
Axial UECT scan were retrospectively reviewed using Ma-
Fig. 1. The region of interests (ROI) measured at 3 or 4 points including right sigmoid sinus (SS), Lt. SS and 2 points of superior sagittal sinus. One or both sigmoid sinus must be included in ROI measurement. Identical, circu- lar ROI in one patient were used by copying and pasting method.
correlation analysis and independent sample t-test using SPSS 12.0 (SPSS company, Chicago, IL, USA) were per- formed. Simple regression analysis was used to evaluate the correlation between mean HU and Hgb or mean HU and Hct. Correlation analyses and independent sample t- tests were used to evaluate the effect of age and sex, respec- tively. Multiple regression analyses were performed to evaluate the relationship between mean HU and Hct ac- cording to age or sex.
RESULTS
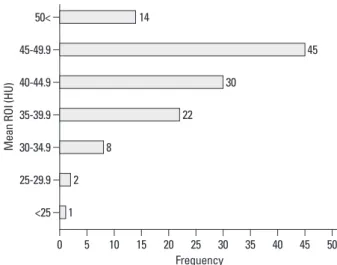
The total population (n=122) consisted of 71 men and 51 women (range, 16-88 years; mean age, 53 years). The mean circular ROI area was 14.5 mm2 (11.1-19.6 mm2). ROI mea- surements were available in bilateral SS in 70 patients and only in unilateral SS in 52 patients. In addition, mean ROIs were calculated at 4 points in 70 patients and at 3 points in 52 patients. The mean density of dural sinuses ranged from 24.67 to 53.67 HU with a mean of 43.28 with standard de- viation (SD) of 5.82 (Fig. 2). Hgb levels ranged from 6.6 g/
dL to 16.5 g/dL with a mean of 13.17±2.18 and Hct levels ranged from 20.3% to 48.2% with a mean of 38.89±6.22.
There was a strong correlation between mean HU and Hgb level (r=0.832) (Fig. 3), so it may be possible to use regres- sion equation such as mean HU=13.966+2.226 Hgb (p<
0.001). There was also a strong correlation between mean HU and Hct level (r=0.840) (Fig. 4), so it may be possible to use regression equation such as mean HU=12.694+0.787 Hct (p<0.001). The difference between mean density and Hct ranged from 3.1 to 12.8 with a mean of 4.39 and SD of 3.4.
The seven patients (5.7%, 5 females, 2 males) showed a dif- ference of more than 10 between mean ROI and Hct levels.
The densities in the SS (mean-45.76 HU in the right SS, and 45.74 HU in the left SS) were higher than those in the SSS (mean-42.08 HU in the upper portion of SSS, 41.42 HU in the lower portion). The densities of the right or left SS were higher than the SSS densities in 109 of 122 cases (89.3%) and the difference between SS density and SSS density ranged from -2.5 to 14 with a mean of 3.68±3.13.
The mean density of dural sinuses was 44.68 HU with a SD of 5.43 in males and 41.32 HU with SD of 5.84 in fe- males. The difference of the mean HU between the sexes was statistically significant (p=0.001), but there was no dif- ference in orrelation between mean HU and Hct levels by sex (p=0.870). There was a negative correlation between levels were also collected.
Statistical methods
Simple regression analysis, multiple regression analysis,
Fig. 2. Frequency graph of mean Hounsfield unit (HU) values. The mean den- sities ranged from 24.67 to 53.67 HU with a mean of 43.28. The mean densi- ties in 97 patients (79.5%) were included within range from 35 HU to 50 HU.
Fig. 3. Graph illustrating the correlation between mean HU and Hgb. There was a strong correlation between mean HU and Hgb levels (r=0.832). HU, Hounsfield unit; ROI, regions of interest; Hgb, hemoglobin.
Fig. 4. Graph illustrating the correlation between mean HU and Hct. There was a strong correlation between mean HU and Hct levels (r=0.840). HU, Hounsfield unit; ROI, regions of interest; Hct, hematocrit.
<25
0
0 10
10 20
20 30
30 40
40 50
50 60
60 1 25-29.9 2
30-34.9 8
35-39.9 22
40-44.9 30
45-49.9 45
50< 14
Mean ROI (HU)Mean ROI (HU)Mean ROI (HU)
0
0
0
5
10
10
30 20
15
50 40
20
60
5 10 15 20 25 30 35 40 45 50
Frequency
Hgb (g/dL)
Hct (%)
Correlation between mean ROI and Hgb
Correlation between mean ROI and Hct Mean ROI
Mean ROI
er, DST often presents with highly variable symptoms, so UECT is usually the first imaging modality for most of them. The hyperattenuating signs in UECT are occasionally observed when an acute clot has formed in a vessel and can be seen in various vascular diseases, including acute arterial occlusion, acute arterial dissection, aneurysm rupture and acute venous thrombosis.15 As a thrombus retracts, water content decreases, Hct concentration increase, and its atten- uation value subsequently increase to 50-80 HU.16,17
In our study, the mean densities ranged from 24.67 to 53.67 HU with a mean of 43.28, and these results showed a relatively low attenuation compared with previous quantita- tive study of SSS (32-69 HU) by Black, et al.14 One study of a pediatric population found that SSS attenuation measure- ments ranged between 50 and 68 HU.13 Another study of adults revealed the attenuation values were distributed with a mean of 50 HU and SD of 7.5.11 In our study, the densities of the right or left SS were higher than the SSS densities in 109 of 122 cases (89.3%), so HU differences between our study and others may not be caused by addition of SS to the mean density measurement but, rather, to the patient population.
In an earlier report, Fanous, et al.12 suggested that the lack of a strong correlation between attenuation values and Hgb levels may be due to the dural sinus complexity. The lateral venous lacunae and cavernous spaces contribute to structural heterogeneity. Therefore, if the dural sinus attenu- ations are measured at larger and more numerous points, then the mean values will be more precise.
The dural sinuses were very close to the skull, which may have resulted in inevitable partial volume averaging and mean HU and age but no difference in correlation between
mean HU and Hct level according to the age.
In our cohort, the highest mean density was 53.67 HU with an Hgb of 15.9 g/dL and an Hct level of 47.1% in a 47-year-old male who was previously healthy and present- ed with a headache (Fig. 5). The lowest mean density was 24.67 HU in 28-year-old female with an Hgb of 8.4 g/dL and an Hct of 24.3%. She was pregnant and had underlying Wilson’s disease and liver cirrhosis (Fig. 6).
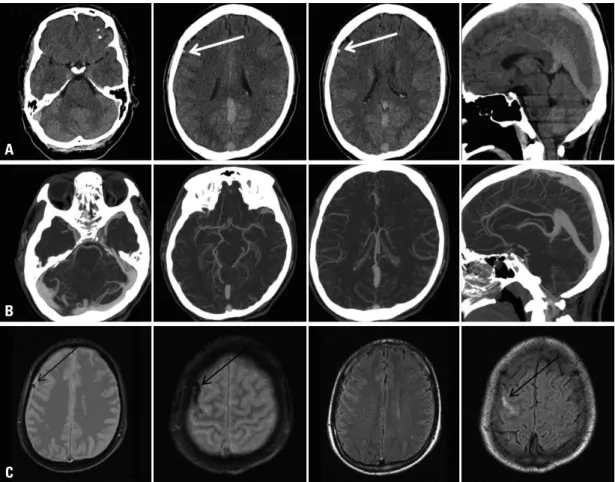
In a 31-year old male who presented with a headache, UECT showed a grossly hyperdense dural sinus, but quan- titatively, the mean ROI measured as 51 HU and was well- correlated with an Hgb level of 15.7 g/dL and an Hct level of 47.2%. In addition, the dense cortical vein observed at the frontal sulcus measured as 62 HU. CT angiography and MRI revealed CVT without evidence of DST (Fig. 7).
In a 49-year-old male who presented with multiple frac- tures of long bone in a traffic accident without head trauma, the mean density of the dural sinus on initial preoperative brain CT was 46 HU with an Hgb of 14.1 g/dL and an Hct of 41.9%, but postoperative CT performed after 5 days showed a mean density of 36.25 HU. This patient did not receive a blood transfusion in operation, at which time, the Hgb was 10.1 g/dL and the Hct was 30.1% (Fig. 8).
DISCUSSION
MRI with MR venography is commonly considered, the noninvasive “gold standard” in diagnosing CVT3,6 Howev-
Fig. 5. In our cohort, the highest mean density was 53.67 HU with an Hgb of 15.9 g/dL and an Hct level of 47.1% in a 47-year-old male who was previously healthy and presented with a headache. There was no clinical suspicion of dural sinus thrombosis in this patient. HU, Hounsfield unit; Hgb, hemoglobin; Hct, hematocrit.
Fig. 6. The lowest mean density was 24.67 HU in 28-year-old female with an Hgb of 8.4 g/dL and an Hct of 24.3%. She was pregnant and had underlying Wilson’s disease and liver cirrhosis. HU, Hounsfield unit; Hgb, hemoglobin; Hct, hematocrit.
female patients had a history of chronic disease such as liv- er cirrhosis or chronic renal failure and none presented with active bleeding. There was no statistically significant differ- ence in the correlation between mean HU and Hct level be- tween the sexes (p=0.870), but more complex factors such as hydration may have influenced the dural sinus density in females.
Collins, et al.18 demonstrated that aortic attenuation on abdomen CT is capable of providing a reliable indicator of the presence of anemia and that an averaged aortic attenua- tion value >50 HU in males and >45 HU in females is con- beam hardening artifacts. Therefore, we thought that the SS
was suitable for the ROI measurement because it has a larg- er area than the SSS, which made avoidance of the beam hardening artifact possible.
In our study, the difference between mean HU and Hct ranged from -3.1 to 12.8 with a mean of 4.39 and SD of 3.4. Seven patients (5.7%, 5 females, 2 males) had a differ- ence above 10 between mean HU and Hct levels. One of two male patients had underlying liver cirrhosis that pre- sented with variceal bleeding and the other presented with traumatic abdominal bleeding. However, none of the five
Fig. 7. A 31-year-old male presented with headache. The UECT (A) showed grossly hyperdense dural sinus, but mean density was mea- sured as 51 HU and was well correlated with an Hgb level of 15.7 g/dL and an Hct level of 47.2%. The dense cortical vein observed at the frontal sulcus measured as 62 HU (white arrow). Additionally performed CT angiography (B) not showed filling defects in dural sinuses suggesting thrombosis and MRI (C) revealed cortical vein thrombosis (black arrow). UECT, unenhanced computed tomography; HU, Hounsfield unit.
Fig. 8. A 49-year-old male presented with multiple fractures of long bone without head trauma. The mean density of dural sinus on initial preoperative UECT (A) was 46 HU with an Hgb of 14.1 g/dL and an Hct of 41.9%, but postoperative UECT (B) performed after 5 days showed a mean desntiy of 36.25 HU, at which time, the Hgb was recorded to 10.1 g/dL and Hct was 30.1%. UECT, unenhanced computed tomography; HU, Hounsfield unit; Hgb, hemoglobin; Hct, hematocrit.
A
B
C
A B
mann H, et al. Diagnostic value of multidetector-row CT angiog- raphy in the evaluation of thrombosis of the cerebral venous si- nuses. AJNR Am J Neuroradiol 2007;28:946-52.
4. Tehindrazanarivelo AD, Bousser MG. Idiopathic intracranial hy- pertension and cerebral dural sinus thrombosis. Am J Med 1994;97:200-1.
5. Leker RR, Steiner I. Features of dural sinus thrombosis simulating pseudotumor cerebri. Eur J Neurol 1999;6:601-4.
6. Renowden S. Cerebral venous sinus thrombosis. Eur Radiol 2004;14:215-26.
7. Ferro JM, Canhão P, Stam J, Bousser MG, Barinagarrementeria F;
ISCVT Investigators. Prognosis of cerebral vein and dural sinus thrombosis: results of the International Study on Cerebral Vein and Dural Sinus Thrombosis (ISCVT). Stroke 2004;35:664-70.
8. Sidani CA, Ballourah W, El Dassouki M, Muwakkit S, Dabbous I, Dahoui H, et al. Venous sinus thrombosis leading to stroke in a patient with sickle cell disease on hydroxyurea and high hemoglo- bin levels: treatment with thrombolysis. Am J Hematol 2008;83:
818-20.
9. Wendling LR. Intracranial venous sinus thrombosis: diagnosis suggested by computed tomography. AJR Am J Roentgenol 1978;130:978-80.
10. Patronas NJ, Duda EE, Mirfakhraee M, Wollmann RL. Superior sagittal sinus thrombosis diagnosed by computed tomography.
Surg Neurol 1981;15:11-4.
11. Virapongse C, Cazenave C, Quisling R, Sarwar M, Hunter S. The empty delta sign: frequency and significance in 76 cases of dural sinus thrombosis. Radiology 1987;162:779-85.
12. Fanous R, Leung A, Karlik S. Quantitative assessment of the su- perior sagittal sinus on unenhanced computed tomography. Eur J Radiol 2010;75:336-42.
13. Osborn AG, Anderson RE, Wing SD. The false falx sign. Radiolo- gy 1980;134:421-5.
14. Black DF, Rad AE, Gray LA, Campeau NG, Kallmes DF. Cere- bral venous sinus density on noncontrast CT correlates with he- matocrit. AJNR Am J Neuroradiol 2011;32:1354-7.
15. Morita S, Ueno E, Masukawa A, Suzuki K, Machida H, Fujimura M. Hyperattenuating signs at unenhanced CT indicating acute vascular disease. Radiographics 2010;30:111-25.
16. New PF, Aronow S. Attenuation measurements of whole blood and blood fractions in computed tomography. Radiology 1976;
121(3 Pt. 1):635-40.
17. Swensen SJ, McLeod RA, Stephens DH. CT of extracranial hem- orrhage and hematomas. AJR Am J Roentgenol 1984;143:907-12.
18. Collins AJ, Gillespie S, Kelly BE. Can computed tomography identify patients with anaemia? Ulster Med J 2001;70:116-8.
19. Doppman JL, Rienmuller R, Lissner J. The visualized interventric- ular septum on cardiac computed tomography: a clue to the pres- ence of severe anemia. J Comput Assist Tomogr 1981;5:157-60.
20. Foster M, Nolan RL, Lam M. Prediction of anemia on unen- hanced computed tomography of the thorax. Can Assoc Radiol J 2003;54:26-30.
21. Title RS, Harper K, Nelson E, Evans T, Tello R. Observer perfor- mance in assessing anemia on thoracic CT. AJR Am J Roentgenol 2005;185:1240-4.
sistent with the absence of anemia. The relationship be- tween thoracic UECT and anemia has been described in other reports.19-21 Those studies reported a threshold of 35 HU, similar to the report by Fanous, et al.12 that suggested SSS attenuation was an indicator of anemia.
We could know the importance of quantitative assess- ment in the case of Fig. 7. The dural sinuses that grossely showed hyperattenuation and so was suspected DST, final- ly normal hyperdense sinus without thrombosis on CTV.
The hyperattenuation of dural sinuses (51 HU) caused by high Hgb level (15.7 g/dL) of the patient.
In the case of Fig. 8, we thought that the dural sinus densi- ty on UECT may reflect a recent change of Hgb and Hct sta- tus to some degree although cannot reflect active bleeding.
This study has some limitations. First, this is a retrospec- tive study, so clinical information was obtained from chart review and the electronic in-hospital database of clinical re- cords without real time data about hydration or medication.
Second, the ROIs were measured by a single neuroradiolo- gist for consistency, so inter-observer variability in ROI mea- surement was not calculated. Third, DST underdiagnosed by neurologist and subacute or chronic DST not showing high density on UECT can be included in this study.
In conclusion, dural sinus density on UECT is closely re- lated to Hgb and Hct levels. Therefore, Hgb or Hct level can be used to determine whether the dural sinus density is within the normal range or pathologic conditions such as venous thrombosis, polycythemia vera or severe anemia.
Quantitative assessment of the dural sinuses is easy and less time-consuming work in clinical practice without addition- al radiation exposure, therefore, when grossly hypodense or hyperdense dural sinuses are observed on UECT, radiolo- gists should measure dural sinus attenuation and check Hgb or Hct levels.
REFERENCES
1. Linn J, Pfefferkorn T, Ivanicova K, Müller-Schunk S, Hartz S, Wiesmann M, et al. Noncontrast CT in deep cerebral venous thrombosis and sinus thrombosis: comparison of its diagnostic value for both entities. AJNR Am J Neuroradiol 2009;30:728-35.
2. Bogousslavsky J, Pierre P. Ischemic stroke in patients under age 45. Neurol Clin 1992;10:113-24.
3. Linn J, Ertl-Wagner B, Seelos KC, Strupp M, Reiser M, Brück-