1.5 kW 다리우스 풍력터빈 현장 실증 및 성능분석
사지드 알리1,2⋅장춘만1,2,†
1한국과학기술대학교 스마트시티건설공학과, 2한국건설기술연구원 국토보전연구본부
Field Testing and Performance Evaluation of 1.5 kW Darrieus Wind Turbine
SAJID ALI
1,2, CHOON-MAN JANG
1,2,†1Smart City Construction Engineering, University of Science & Technology (UST), 217 Gajeong-ro, Yuseong-gu, Daejeon 34113, Korea
2Department of Land, Water and Environmental Research, Korea Institute of Civil Engineering and Building Technology (KICT), 283 Goyangdae-ro, Ilsanseo-gu, Goyang 10223, Korea
†
Corresponding author :
[email protected]Received
14 October, 2019Revised
25 November, 2019Accepted
30 December, 2019Abstract >> The purpose of the present study is to analyze and evaluate the per- formance of a small Darrieus wind turbine installed at the Urumsil region of Deokjeok-do Island in the west of South Korea 50 km away from Incheon. This place has no government electricity so alternate resources of energy needed to be installed there. For this purpose a small Darrieus wind turbine with the ca- pacity of 1.5 kW was developed and installed at the site. The experimental power output of the wind turbine is less than the designed power at the same values of wind speed. This power loss is mainly due to the highly unsteady nature wind of sudden changes in magnitude of wind speed and wind angle. The results of cur- rent study can be used to make a future power generation plan for Deokjeok-do and other nearby small islands.
Key words : Capacity factor(용량 계수), Darrieus wind turbine(다리우스 풍력 터빈), Standard deviation(표준 편차), Weibull distribution(웨이블 분포), Wind speed data(풍속 데이터)
1. Introduction
In general, a turbine performance is determined by wind energy, wind speed and wind direction, which have an unsteady nature due to the geographical fea- tures of the installation site.
Wind energy has been introduced to the research
and government community over the last few deca-
des
1-4). There are two general categories of wind tur-
bines named as horizontal axis wind turbines (HAWT)
and vertical axis wind turbines (VAWT). HAWT is
usually preferred over VAWT in terms of aerody-
namic performance but it has some structural issues in
high wind conditions. The rotor of VAWT is mount-
Fig. 1. Picture of test station
9)Fig. 2. Dimensions of tested wind turbine rotor and power
curve9)Parameter Value
Rated power (kW) 1.5
Rated wind speed (m/s) 13.5
Rated rotational speed (RPM) 300
Cut-in wind speed (m/s) 3
Chord length (m) 0.2
Blade length (height) (m) 3
Rotational diameter (m) 2
Blade profile NACA0015
Table 1. Specifications of test Darrieus wind turbine
ed near the ground so making it more stable as com- pared to HAWT. Bianchini et al.
5)showed that the cost of 500 kW power generation at an average wind speed of 5.4 m/s with a VAWT turbine is 18-39%
lower than using a HAWT. Continuously changing the angle of attack of wind on VAWT rotor drops its aerodynamic efficiency
6). Brulle
7)experimentally stud- ied VAWT on wind tunnel scale with unsteady wind conditions. In their study, wind speed was 7 m/s with fluctuations of 7% and 12% at frequency of 0.5 Hz.
They also performed a numerical analysis, using Reynolds averaged Navier Stokes equations, to inves- tigate the effects of both steady and unsteady wind conditions on the performance of VAWT
8).
Until now, most of the studies focus on the per- formance enhancement of wind turbines or lab scale testing but performance analysis using experimental data which comes from real site, is not considered clearly.
In the present study, the performance of the 1.5 kW vertical axis wind turbine has been analyzed by the experimental data obtained through field test per- formed at the Urumsil region of Deokjeok-do Island in South Korea. The raw data mainly consists of wind conditions, turbine power and rotational speed of the turbine rotor; its statistics are saved per second on a computer. Raw experimental data is averaged out using different time steps and compared to ana- lyze the performance of the wind turbine. Detailed
wind conditions are also analyzed using two variable Weibull probability density functions.
2. Wind turbine
The Darrieus wind turbine having the capacity of 1.5 kW and a vertical tower, called the wind master, are installed at the Urumsil region of Deokjeok-do Island as shown in Fig. 1.
An anemometer, anemoscope, ambient temperature
sensor and data logger are installed on the wind
master. The heights of both are 10 meters from local
ground and both are located at a distance of eight
meters apart from each other. Geometrical dimensions
and performance curve of Darrieus wind turbine are
shown in Fig. 2 whereas Table 1 contains important
design parameters of the wind turbine like rated pow-
er, rated wind speeed tc.
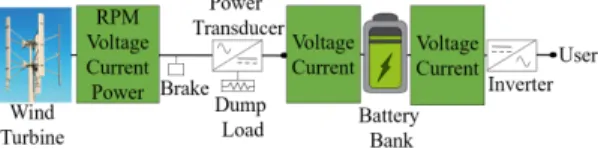
Fig. 3. Diagram for data acquisition methodology
The wind turbine is surrounded by mountains from three sides and sea from the other side. The north side is considered as zero degree of wind angle and the remaining three directions are also assigned a cor- responding wind angle.
Fig. 3 shows the data acquisition system to record experimental data from the wind turbine and the wind master. Rotor rotational speed, voltage, electric current and power of the wind turbine are measured between turbine rotor and power transducer. The power output of the wind turbine is first stored in battery bank. Using a power inverter, it is converted to AC voltage for users.
3. Experimental data analysis methodology
To evaluate the performance of the wind turbine, local real time wind conditions, local wind velocity, wind direction, ambient air temperature and atmos- pheric pressure are stored in a computer by a data ac- quisition system. The data recording period corre- sponds to the winter season in South Korea (Jan-Apr) because of huge measuring data over 10 million val- ues for each variable, it needs to average out the raw data for analyzing the meaningful results. Five differ- ent time steps 5, 10, 15, 20 and 30 minutes were in- troduced to average out the experimental raw data.
Turbulence intensity (TI) is used to evaluate the effect of different time averaging steps on the turbine performance in the present study. The time step pro- ducing minimum TI in measured wind speed, will be
used to evaluate the performance of the wind turbine.
TI is defined as the ratio of standard deviation (SD) and mean wind speed. SD is defined as follows:
(1)
where x
iand x
avedenote the specific and average val- ues of a particular variable x, respectively and n is the total number of values of variable x.
4. Result and Discussion
4.1 Wind turbine performance analysis
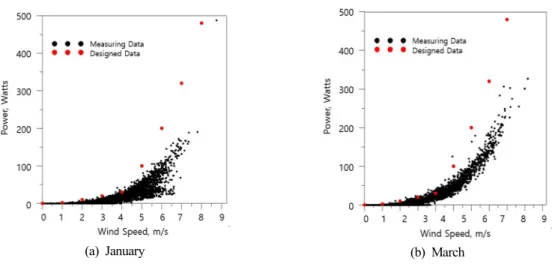
Wind turbine power output measured at different wind speeds has been analysed and compared to the designed power output. Fig. 4 shows turbine power production with respect to measuring wind speed for January and March, respectively.
In the Fig. 4, the power output obtained by meas- urement at every value of wind speed is lower than the designed power curve. There are several reasons behind this drawback. The designed power curve is obtained by wind tunnel testing where usually steady state wind conditions are employed. Even if transient conditions are generated in the wind tunnel then those conditions are not as severe as in the real field.
At the real site it is very hard to predict the behavior of wind as it can change its magnitude and angle of attack at any time. This surely effects the perform- ance of the wind turbine and the difference is clear in Fig. 4. On the other hand, weather conditions like snow, rain, sunshine and fluctuation in ambient tem- perature also affect the performance of wind turbine at the real site.
Table 2 contains the information about electrical
energy produced by wind turbines, its capacity factor
(a) January (b) March Fig. 4. Wind turbine power output
January February March April
Time (days)
Mean Wind Speed (m/s)
Turbule nce Intensit
y (-) Wind Turbine
Energy Product ion (kWh)
C.F (%) C
p(%)
Mean Wind Speed (m/s)
Turbule nce Intensit
y (-) Wind Turbine
Energy Product ion (kWh)
C.F (%) C
p(%)
Mean Wind Speed (m/s)
Turbule nce Intensit
y (-) Wind Turbine
Energy Product ion (kWh)
C.F (%) C
p(%)
Mean Wind Speed (m/s)
Turbule nce Intensit
y (-) Wind Turbine
Energy Product ion (kWh)
C.F (%) C
p(%)
1 3.2 0.3 2.9 8.1 17.3 4.4 0.2 20.9 58.0 23.6 3.0 0.2 1.7 4.8 14.1 4.0 0.3 0.0 0.0 0.0
2 3.6 0.2 7.7 21.4 22.0 3.6 0.3 9.8 27.1 22.6 2.6 0.3 21.0 58.3 19.0 1.8 0.7 0.0 0.0 0.0
3 3.6 0.2 0.0 0.0 0.0 3.4 0.3 0.1 0.3 1.3 2.4 0.3 2.4 6.6 25.4 0.8 1.6 2.9 8.0 19.4
4 3.2 0.3 18.4 51.0 24.9 3.2 0.3 3.3 9.2 16.0 2.8 0.2 1.0 2.8 9.2 1.0 1.3 1.2 3.3 12.8
5 2.8 0.3 14.5 40.4 10.6 2.8 0.3 5.3 14.6 16.6 3.2 0.2 7.0 19.4 23.5 1.0 1.3 3.7 10.4 29.6
6 4.0 0.2 3.5 9.6 16.3 2.0 0.5 16.8 46.6 20.8 3.0 0.2 0.2 0.5 5.6 4.0 0.3 1.9 5.3 10.7
7 3.8 0.2 8.1 22.6 21.7 3.4 0.3 6.0 16.7 15.7 3.4 0.2 1.4 3.9 21.1 5.6 0.2 3.0 8.3 14.0
8 2.2 0.4 4.8 13.2 19.0 2.6 0.4 2.6 7.3 13.7 3.2 0.2 14.0 38.9 4.8 5.8 0.2 20.1 55.7 31.9
9 3.2 0.3 0.1 0.3 2.3 3.6 0.3 6.1 17.1 17.1 3.0 0.2 23.0 63.9 4.8 4.8 0.3 2.8 7.8 20.5
10 1.4 0.6 17.7 49.3 21.8 3.2 0.3 1.3 3.7 10.9 3.6 0.2 21.0 58.3 17.8 3.4 0.4 1.5 4.0 12.5
11 2.4 0.4 19.2 53.4 17.5 2.4 0.4 1.7 4.7 11.2 3.6 0.2 18.2 50.5 33.8 4.2 0.3 14.0 38.8 32.6
12 0.8 1.1 3.4 9.5 19.0 2.2 0.4 7.4 20.5 19.3 3.8 0.2 22.0 61.1 34.0 2.8 0.4 5.3 14.8 31.6
13 1.0 0.9 9.5 26.4 21.6 3.2 0.3 0.0 0.1 2.8 4.0 0.2 1.3 3.6 22.6 2.2 0.6 0.0 0.0 0.0
14 1.2 0.7 1.6 4.3 11.5 4.4 0.2 20.7 57.4 32.5 3.0 0.2 12.9 35.9 33.0 4.6 0.3 0.6 1.7 17.6
15 1.0 0.9 6.8 19.0 21.5 6.0 0.2 21.0 58.3 18.0 2.2 0.3 0.0 0.0 0.0 4.4 0.3 1.5 4.2 33.1
16 1.8 0.5 0.4 1.0 8.5 5.6 0.2 5.5 15.3 34.2 2.6 0.3 0.0 0.0 0.0 2.4 0.5 6.0 16.6 27.5
17 1.8 0.5 4.1 11.4 18.3 3.8 0.2 2.5 6.8 24.9 2.0 0.3 0.0 0.0 0.0 2.4 0.5 0.0 0.1 0.8
18 1.6 0.5 20.2 56.2 7.2 3.6 0.3 3.5 9.8 19.5 1.4 0.5 1.0 2.8 8.8 3.4 0.4 2.9 8.1 20.1
19 2.2 0.4 19.2 53.4 12.1 3.0 0.3 20.2 56.2 35.4 3.2 0.2 0.7 1.8 6.3 4.0 0.3 0.0 0.0 0.0
20 2.0 0.4 13.3 37.0 20.5 2.8 0.3 0.0 0.0 0.0 2.4 0.3 0.0 0.0 0.4 3.6 0.3 0.6 1.8 13.1
21 2.6 0.3 25.6 71.0 23.4 3.8 0.2 15.8 43.8 23.4 3.2 0.2 1.8 5.1 11.0 3.2 0.4 0.0 0.0 0.0
22 3.0 0.3 12.3 34.3 4.7 3.4 0.3 2.3 6.3 18.6 2.2 0.3 16.1 44.8 26.7 3.4 0.4 0.0 0.0 0.0
23 2.4 0.4 18.3 50.9 7.4 1.8 0.5 6.7 18.7 28.8 2.0 0.3 23.0 63.9 9.8 3.2 0.4 5.6 15.4 23.8
24 2.0 0.4 23.0 64.0 22.0 3.0 0.3 21.0 58.3 14.3 2.8 0.2 0.9 2.5 9.0 2.0 0.6 1.0 2.7 13.2
25 2.6 0.3 0.4 1.1 6.4 2.6 0.4 6.1 17.0 25.4 2.8 0.2 0.9 2.6 3.7 3.6 0.3 21.0 58.3 11.1
26 3.2 0.3 0.0 0.0 0.0 3.4 0.3 1.9 5.4 19.2 2.4 0.3 3.8 10.7 14.8 4.0 0.3 20.1 55.9 35.0
27 2.6 0.3 5.3 14.6 11.9 2.8 0.3 1.1 3.1 10.5 2.2 0.3 22.4 62.3 29.1 3.2 0.4 17.5 48.6 31.1
28 2.0 0.4 19.3 53.6 8.0 4.6 0.2 0.0 0.0 0.0 2.0 0.3 19.0 52.8 7.5 1.4 0.9 8.4 23.4 32.6
29 2.4 0.4 2.2 6.0 13.7 3.2 0.3 22.0 61.1 10.3 1.0 0.7 3.1 8.5 25.1 2.6 0.5 0.1 0.4 2.5
30 3.2 0.3 10.9 30.2 18.7 3.6 0.3 14.0 38.9 11.0 2.0 0.3 0.0 0.0 0.0 3.2 0.4 9.8 27.2 32.7
Table 2. Performance analysis of wind turbine on daily basis
(a) January (b) February
(c) March (d) April
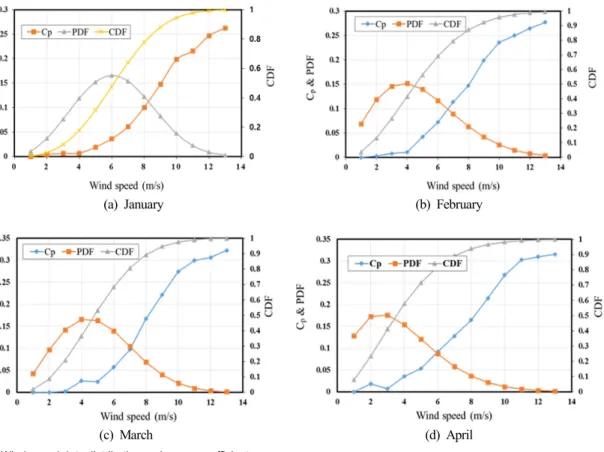
Fig. 5. Wind speed data distribution and power coefficient
(CF) and power coefficient (C
p), on a daily basis.
CF and C
pare defined as below.
CF P
R×
E × (2)
C
P Av
P
t× (3)
where P
R(watts) is rated power of the wind tur- bine, P
t(watts) is power produced by the wind tur- bine, ρ (kg/m
3) is air density (assumed as 1.25 kg/m
3) A (m
2) is wind turbine swept area and v (m/s) is wind speed, respectively. CF value indicates that how much energy has been extracted by the wind turbine as compared to its rated capacity.
This parameter purely depends upon the aerody- namic design of the wind turbine but not on wind conditions. So from Table 2 it is clear that average
value of CF is higher whenever energy extracted by the wind turbine is higher. However, this is not the case for the power coefficient because C
pdoes not only depend upon the aerodynamic performance of the wind turbine but wind potential also effects it.
Therefore, the more the energy extracted by the wind turbine does not necessarily mean that the higher are the values of C
p(as this is true for CF) as shown in Table 2. Overall, during January and February rela- tively higher values of both the parameters are ob- served and VICE VERSA for the other two months.
Fig. 5 shows the distribution of wind speed data and variation in power coefficient with wind speed.
Higher magnitudes of wind speed are observed dur-
ing January and February as compared to the other
two months. As it was discussed briefly in last para-
graph that C
pis function of both, aerodynamic design of wind turbine as well as the wind conditions. Fig.
5 has been prepared in order to study the effect of wind speed on C
p. From Fig. 5 it is clear that gen- erally during all the months C
pincreases lineally with wind speed.
5. Conclusions
Performance analysis of a small Darrieus wind tur- bine, installed at the Urumsil region of Deokjeok-do Island in South Korea, is being carried out in the present study. On the basis of experimental inves- tigations and wind conditions, the following con- clusions are drawn:
(1) Most of the wind speeds during all four months are in the range of 5 to 8 m/s. Relatively higher magnitudes of wind speeds are observed dur- ing January and Mach and VICE VERSA for other two months.
(2) The experimental power output of the wind turbine is less than the designed power at the same values of wind speed. This power loss is mainly due to the highly unsteady nature wind of sudden changes in magnitude of wind speed and wind angle.
Acknowledgment
This work was supported by the major research funding from korea institute of civil engineering and building technology (KICT).
References
1. L. M. Al-Hadhrami, “Performance evaluation of small wind turbines for off grid applications in Saudi Arabia”, Energy Conversion and Management, Vol. 81, 2014, pp.
19-29, doi: https://doi.org/10.1016/j.enconman.2014.01.064.
2. M. T. Asr, E. Z. Nezhad, F. Mustapha, and S. Wiriadidjaja,
“Study on start-up characteristics of H-Darrieus vertical axis wind turbines comprising NACA 4-digit series blade airfoils”, Energy, Vol. 112, 2016, pp. 528-537, doi:
https://doi.org/10.1016/j.energy.2016.06.059.
3. F. Balduzzi, A. Bianchini, R. Maleci, G. Ferrara, and L.
Ferrari, “Critical issues in the CFD simulation of Darrieus wind turbines”, Renewable Energy, Vol. 85, 2016, pp.
419-435, doi: https://doi.org/10.1016/j.renene.2015.06.048.
4. Y. Bazilevs, A. Korobenko, X. Deng, J. Yan, M. Kinzel, and J.
O. Dabiri, “Fluid–structure interaction modeling of verti- cal-axis wind turbines”, J. Appl. Mech., Vol. 81, No. 8, 2014, pp. 081006, doi: https://doi.org/10.1115/1.4027466.
5. A. Bianchini, F. Balduzzi, G. Ferrara, and L. Ferrari, “Virtual incidence effect on rotating airfoils in Darrieus wind turbines”, Energy Conversion and Management, Vol. 111, 2016, pp. 329- 338, doi: https://doi.org/10.1016/j.enconman.2015.12.056.
6. J. D. K. Bishop, and G. A. J. Amaratunga, “Evaluation of small wind turbines in distributed arrangement as sustain- able wind energy option for Barbados”, Energy Conversion and Management, Vol. 49, No. 6, 2008, pp. 1652-1661, doi:
https://doi.org/10.1016/j.enconman.2007.11.008.
7. R. V. Brulle, “Feasibility investigation of the giromill for generation of electrical power”, McDonnell Aircraft Co., USA, 1975.
8. A. Celik, “Weibull representative compressed wind speed data for energy and performance calculations of wind energy systems”, Energy Conversion and Management, Vol. 44, No. 19, 2003, pp. 3057-3072, doi: https://doi.org/10.1016/
S0196-8904(03)00075-X.
9. C. K. Kim, S. Ali, S. M. Lee, and C. M. Jang, “Renewable Energy and Sustainable Buildings”, Springer, Switzerland 2020, pp. 801-812, doi: https://doi.org/10.1007/978-3-030-