This work was supported by the National Research Foundation of Korea Grant funded by the Korean Government (NRF- 2012S1A5A2A03034237).
* Professor, Department of Geography Education, Dongguk University-Seoul campus(동국대학교 사범대학 지리교육과 교수, [email protected])
Coffee Middlemen in Dak Lak, Vietnam: A key stakeholder of coffee value chain as an intermediary of changes in local economies
Sung-Cheol Lee*
베트남 닥락성의 커피 중개상인: 지역 경제 변화의 매개체로서 역할을 하는 커피 가치 사슬의 주요 이해 관계자
이승철*
Abstract : A series of coffee middlemen has come to be regarded as an exploitative force in the lives of small and poor coffee farmers, which is called ‘coyote’, controlling production, paying unfair prices for labor and goods, and participating in fraudulent practices to maximize their own profits. However, the reality of gains captured by coffee middlemen in the value chain might be exaggerated and even unfair.
Therefore, the main aim of this paper is to reconsider the implication of coffee middlemen for the devel- opment of coffee value chain in Vietnam. It also attempts to identify their characteristics by investigating relations among coffee farmers, middlemen and processing/exporting firms. In terms of middlemen’s margin in the coffee sub-sector, their margin is quite small when compared to other actors higher in the value chain. Rather, coffee middlemen in Vietnam have played a critical role as an intermediary of change in local economies. More specifically, coffee middlemen in Dak Lak has played a significant role as a mar- ket facilitator by stimulating the access of farmers to markets by providing buyers for farmers thanks to changes in institutional environment. Also, they have played a critical role as an agent of sustainable cof- fee production by encouraging sustainable coffee production in accordance with the demand of process- ing and exporting firms.
Key Words : coffee industry, Dak Lak, foreign investment enterprises, middlemen, state-owned enter- prises, value chains, Vietnam
요약 : 일반적으로 커피 중개상인은 이윤을 극대화하기 위하여 농가의 커피 생산 통제, 불공정 커피 가격 지불, 일련의
부당 행위 등을 통하여 소규모 영세 커피 농가의 이윤을 착취하는 이른바 ‘코요테’로 인식되어 왔다. 그러나 베트남 커 피 가치사슬 상에서 중개상인이 획득하는 실질적인 이윤은 과장되었으며, 심지어 부당하다고 볼 수 있다. 따라서 본 연 구의 목적은 커피 농가, 중개상인, 수출가공업체들 간의 관계 및 연계 분석을 통하여 베트남 커피 가치사슬에서 커피 중개상인의 역할과 의미를 재고찰하고자 하였다. 분석 결과, 베트남 커피 중개상인이 획득하는 이윤은 타 커피 관련 주 체들과 비교하여 상대적으로 미미하였으며, 지역 커피 농가의 이윤을 착취하기 보다는 오히려 지역 경제 변화의 매개
1. Introduction
A series of coffee middlemen has come to be re- garded as an exploitative force in the lives of small and poor coffee farmers, which is called ‘coyote’, controlling production, paying unfair prices for labor and goods, and participating in fraudulent practices to maximize their own profits. However, the reality of gains captured by coffee middlemen in the value chain might be exaggerated and even unfair. In terms of middlemen’s margin in the coffee subsector, their margin is quite small when compared to other actors higher in the value chain.
Rather, coffee middlemen in Vietnam have played a critical role as an intermediary of change in local economies.
More specifically, Vietnamese coffee middle- men make local farmers easier to get into the coffee business, and have led them to show reasonable re- sponse to the global coffee business activities related to sustainable coffee production. Therefore, the main aim of this paper is to reconsider the implica- tion of coffee middlemen for the development of coffee value chain in Vietnam. It also attempts to identify their characteristics by investigating rela- tions among coffee farmers, middlemen and pro- cessing/exporting firms (1) stimulating the access of coffee farmers to coffee business, and (2) encour- aging sustainable coffee production in accordance with the demand of processing/exporting firms.
To this end, the paper is divided into three sec- tions. Firstly, it has deal with the emergence of the coffee industry in Vietnam as a new paradigm in the global coffee industry since the 1980s by in- vestigating some trends in coffee production and exports. Secondly, the research has attempted to identify the transition of the coffee production sys- tem and value chains centering around middlemen.
Finally, it has investigated changes in the roles and implications of middlemen for local economies in Dak Lak, Vietnam.
Also, field works took place from November 2012 to April 2013. A questionnaire survey was conduct- ed in the selected two villages, Krong Buk and Ea H’ding in Dak Lak, resulting in 29 questionnaires for middlemen and 6 questionnaires for processing and exporting firms. The research has also carried out in-depth interviews with 5 middlemen and 4 processing and exporting firms in those periods in Dak Lak.
2. The emergence of Vietnam coffee industry as a new paradigm
in the global coffee industry
In Vietnam coffee was introduced in the 1850s in the first time by the French colonial admin- istration, but it has only become significant in 체로서 중요한 역할을 하고 있는 것으로 나타났다. 베트남 닥락 커피 중개상인은 농가에 구매자를 공급해줌으로써 지 역 커피 농가의 글로벌 시장 접근성을 제고시켜 시장 촉진자로서의 역할을 하였다. 또한 글로벌 수출 가공업체의 수요 에 조응하는 지속 가능한 커피 생산을 활성화하여 지속 가능한 커피 생산의 매개체로서 역할을 하였다.
주요어 : 커피산업, 닥락성, 해외투자기업, 중개상인, 국영기업, 가치사슬, 베트남
Vietnam since reunification in 1975 following the Vietnam War that the government set up special economic zones for coffee-growing (de Fontenay and Leung 2002). Most of the world green coffee beans are produced in Latin America, in particu- lar Brazil, which has led world production since 1840 (Roldan-Perez et al 2009). Up to 1990, four countries (Brazil, Colombia, Indonesia, Ethiopia) shared around 56.7% of world coffee production, but Vietnam expanded its production dramatically
throughout the 1990s and it has become the world’s second largest grower since 2002, displacing Co- lombia into third place and Indonesia into fourth (Table 1).
The drought in Brazil in the early 1990s led to rapid decline in coffee production, so that the price of coffee increased dramatically during this period.
It had resulted in significant profits for Vietnamese coffee farmers. As a result, the area of coffee culti- vation expanded around 150% between 1995 and Table 1. Trends of coffee production in world major coffee producers, 1990~2012
Unit: thousand bags*(%)
1990/91 1993/94 1996/97 1999/00 2002/03 2005/06 2008/09 2011/12
Brazil 27,286 28,167 29,197 47,578 48,480 32,944 45,992 43,484
(29.3) (30.7) (28.3) (36.6) (39.4) (29.6) (35.8) (32.0)
Vietnam 1,390 3,020 5,705 11,631 11,574 13,842 18,438 24,058
(1.5) (3.3) (5.5) (8.9)) (9.4) (12.5) (14.3) (17.7)
Indonesia 7,441 7,301 8,235 6,264 6,731 9,159 9,612 8,620
(9.0) (8.0) (8.0) (4.8) (5.5) (8.2) (7.5) (6.3)
Colombia 14,231 11,320 10,876 9,393 11,735 12,564 8,664 7,653
(15.3) (12.3) (10.6) (7.2) (9.5) (11.3) (6.7) (5.6)
Ethiopia 2,909 2,865 3,270 3,505 4,094 4,779 4,949 6,798
(3.1) (3.1) (3.2) (2.7) (3.3) (4.3) (3.9) (5.0)
Honduras 1,568 1,829 2,004 2,985 2,496 3,204 3,450 5,903
(1.7) (2.0) (1.9) (2.3) (2.0) (2.9) (2.7) (4.3)
Peru 937 665 1,806 2,744 3,000 2,489 3,872 5,581
(1.0) (0.7) (1.8) (2.1) (2.4) (2.2) (3.0) (4.1)
India 2,829 3,533 3,417 4,867 4,776 4,090 3,950 5,233
(3.0) (3.8) (3.3) (3.7) (3.9) (3.7) (3.0) (3.9)
Mexico 4,674 5,023 5,110 6,219 4,351 4,225 4,651 4,546
(5.0) (5.5) (4.9) (4.8) (3.5) (3.8) (3.6) (3.3)
Guatemala 3,271 3,536 4,525 5,120 4,070 3,676 3,785 3,840
(3.5) (3.8) (4.4) (3.9) (3.3) (3.3) (2.9) (2.8)
Others 26,717 24,739 28,991 29,699 21,802 20,197 21,259 20,218
(28.7) (26.9) (28.1) (22.8) (17.7) (18.2) (16.5) (14.9)
World 93,253 91,998 103,136 130,005 123,109 111,169 128,622 135,934
(100.0) (100.0) (100.0) (100.0) (100.0) (100.0) (100.0) (100.0)
Note: * One bag includes 60kg of coffee green bean.
Source: ICO
2000. In particular, there was a rapid increase in coffee production area in Dak Lak province, ac- counting 54% of total coffee production area1). The amount of coffee produced in 1990/91 in Vietnam was 1.39 million bags accounting for only 1.5% of world coffee production, but it has rapidly increased to 24.05 million bags in 2011/12, accounting for 17.2% of world coffee production2).
With the expansion of coffee production, exports
of coffee from Vietnam have also dramatically increased in this period. As shown in Table 2, the increase in exports is accounted for in particular by the rise in exports of Vietnamese Robustas since the late 1990s (Table 2). Brazil has been the largest coffee exporter, accounting for 28.8% of total cof- fee exports in the world in 2011/12. Also, Colombia and Indonesia have been major exporting coun- tries, accounting for 16.5% and 9.1% respectively
Table 2. Trends of coffee exports in world major coffee producers, 1990~2012
Unit: thousand bags*(%)
1990/91 1993/94 1996/97 1999/00 2002/03 2005/06 2008/09 2011/12
Brazil 17,863 18,761 17,260 21,186 29,613 25,078 30,285 31,879
(24.1) (25.3) (21.1) (22.9) (32.8) (28.5) (31.7) (28.8)
Vietnam 1,146 2,753 5,422 10,897 11,555 13,122 17,386 23,475
(1.6) (3.7) (6.6) (11.8) (12.8) (14.9) (18.) (21.2)
Colombia 12,212 12,685 11,176 9,036 10,478 10,751 8,716 7,298
(16.5) (17.1) (13.6) (9.8) (11.6) (12.2) (9.1) (6.6)
Indonesia 6,720 5,302 6,772 4,846 4,280 6,795 5,667 6,185
(9.1) (7.1) (8.3) (5.2) (4.7) (7.7) (5.9) (5.6)
India 1,511 2,907 2,476 4,297 3,567 3,410 2,954 5,483
(2.0) (3.9) (3.0) (4.6) (4.0) (3.9) (3.1) (5.0)
Honduras 1,427 1,661 1,825 2,857 2,439 2,929 3,021 5,474
(1.9) (2.2) (2.2) (3.1) (2.7) (3.3) (3.2) (5.0)
Peru 1,004 845 1,528 2,474 2,838 2,272 3,823 5,054
(1.4) (1.1) (1.9) (2.7) (3.1) (2.6) (4.0) (4.6)
Guatemala 2,803 3,139 4,224 4,901 3,965 3,348 3,456 3,721
(3.8) (4.2) (5.2) (5.3) (4.4) (3.8) (3.6) (3.4)
Mexico 3,526 3,271 4,384 5,164 2,562 2,508 2,775 3,375
(4.8) (4.4) (5.4) (5.6) (2.8) (2.9) (2.9) (3.1)
Ethiopia 849 1,332 1,853 2,005 2,277 2,702 1,868 2,832
(1.2) (1.8) (2.3) (2.2) (2.5) (3.1 (2.0) (2.6)
Others 24,925 21,625 25,083 24,981 16,686 15,165 15,510 15,771
(33.7) (29.1 (30.6 (27.0 (18.5 (17.2) (16.3) (14.3)
World 73,986 74,281 82,003 92,644 90,260 88,080 95,461 110,547
(100.0%) (100.0 (100.0 (100.%) (100.0%) (100.0%) (100.0%) (100.0%) Note: * One bag includes 60kg of coffee green bean.
Source: ICO
in 1990/91. However, the proportion of exports from those countries has shown some significant decrease. In particular, Colombia has decreased to 6.6% in 2011/12, and also Brazil has fallen from 32.8% in 2002/03 to 28.8% in 2011/12. The main reason for this is that the export share of Vietnam has impressively increased from 1.6% in 1990/91 to 21.2% in 2011/12, making Vietnam the world’s most important Robusta exporter (Table 2).
The fundamental reason why Vietnam could become the world second largest coffee country is based on strategies for economic development driv- en by the government since ‘doi moi’ effected from 1986. The coffee plantations have their origins in the official re-settlement of nearly one million eth- nic Kinh people (the majority ethnic Vietnamese) to the New Economic Zones in the Central High- lands. Since these provinces border Cambodia and Laos, the Vietnamese government actively promot- ed the migration of ethnic Kinh to ensure national security and protect against subversion by ethnic minorities. Members of indigenous groups (such as the Edeh and Gia Rai) now make up only 25%
of the population of these provinces (Tuan 2008).
Even after official government re-settlement ended, a ‘free flow’ of migrants into the Central Highlands continued, largely because of the promise of wealth in growing coffee. The coffee tree was now called the ‘dollar tree.’ Since 1996 an estimated 400,000 people migrated to Dak Lak to benefit from the cof- fee boom. More than 120,000 hectares was burned and cleared to make way for new coffee plantations (Tuan 2008). As the ancestral forests of the indig- enous people were turned into coffee plantations, many joined the rush to plant the ‘dollar tree’, while others waged a campaign to protect their land. Now an estimated 80% of coffee trees in the
Central Highlands are owned by small-scale private farmers. On average farming households own only one to two hectares (Tran 2009). The other 20% is owned by the subsidiaries of the state-owned Viet- nam National Coffee Corporation (VINA CAFE).
3. Positioning of middlemen in the coffee value chain in Vietnam
The coffee commodity chain in Vietnam could be divided three periods in accordance with chang- es in principal coffee production agents and the role of coffee middlemen. The first period is based on the collective farming system governed by coffee state-owned enterprises (SOEs) before ‘doi moi’.
During this period all coffee in Vietnam was pro- duced by the collective farming system governed by SOEs thanks to the socialist collective production system.
The second period is based on the small scale
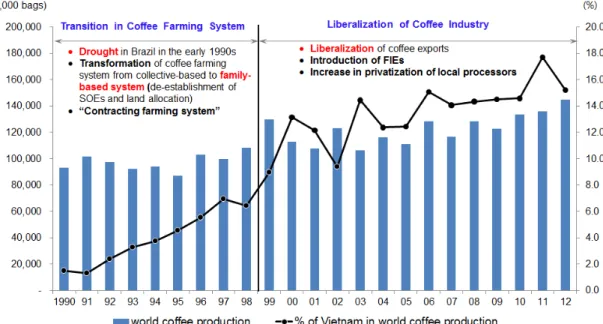
‘contracting farming system’3) de-governed by SOEs and the emergence of small private farm- ers between 1986 and 1998. After doi moi effected from 1986, the coffee farming system had trans- formed from the collective-based to the family- based system, so that coffee SOEs had been de- established and the land owned by SOEs had been allocated to farmers. Therefore, the scale of coffee farming had decreased in accordance with fam- ily units4) (Figure 1). Up to 1998, coffee amounts produced by small scale coffee farmers had been almost 85% of total coffee production in Vietnam (de Fontenay and Leung 2002). Also, some of cof- fee SOEs became subsidiaries of Vina Café, which is one of the biggest coffee SOEs in Vietnam. As a
result, the share of coffee cultivating areas planted and amounts produced by SOEs are only 5% of total coffee cultivating area and 7% of total coffee production in Vietnam (de Fontenay and Leung 2002). An interview with a CEO of a coffee pro- cessing SOE located in Ea Pok, Dak Lak represents changes in principal coffee production agents, con- tracting farming system and the backward linkages of the SOE in Dak Lak after doi moi.
“ … This coffee SOE established in 1976 and has 2,000 ha land for planting coffee. Howev- er, since 1994 some of lands [700 ha] had to be allocated into 435 workers who were working for this coffee plantation owned by this SOE, which average land allocation is 1.6 ha, in ac- cordance with changes in government polices since doi moi. The way in which land is allo- cated is that we lend the land for 25 years maxi-
mum, while workers pay back coffee 1.5 ton per ha vis-à-vis rent or they pay back coffee 2.5 ton per ha with a condition of investments such as supports of fertilizer and irrigation from our SOE. If workers produce coffee over 1.5 ton per ha or 2.5 ton per ha with a condition, they could sell the surplus of coffee in private. Usu- ally, the coffee beans have been purchased by us.” (Interview with Mr. Cao Van Tu in Janu- ary 30, 2013)
Along with these changes in the farming system, it has gone through the emergence of small private coffee farming since the amendment of land law in 1993. In practice, the land law amended in 1987/88 had led to transition for the ownership rights from national to family unit, but the ownership rights of coffee lands were still belong to the government before 1993. However, the real transition of owner-
Figure 1. Transition of coffee farming system into family-based system in Vientam Source: ICO
ship rights to the family unit has experienced since 1993 with the amendment of land law. The amend- ed provision in the land law defined the right of the exchanges of agricultural lands, mortgage, rent, inheritance and so on5) to enforce the right of per- sonal land ownership. As a result, the proportion of Vietnam in world coffee production has increased significantly since 1993 (Figure 1).
However, although coffee farmers who rent land from SOEs could have a number of benefits from SOEs6), they could not sell the land and facilities involved in coffee production. Even the diversifi- cation of crop is not allowed, instead of planting coffee in the land. According to Doutriaux, Geisler and Shively (2008), coffee farmers who rent land from SOEs has also purchased private coffee land to reap benefits from SOEs and private ownership at the same time.
During this period, what is noTable in coffee commodity chains with the emergence of private coffee farming is the linkages of coffee middle- men, who are private coffee assemblers or buying stations. In terms of relations between SOEs and farmers who rent land from SOEs, coffee middle- men had played little roles, because farmers pay back coffee to SOEs directly as a rent. Therefore, the outputs from the state-owned farms bypassed the middlemen and delivered directly to the state- owned processors.
As shown in Figure 2, most of the green coffee beans are delivered by small farmers to middle- men, who were licensed by state-owned processors and exporters, with individual contract between them up to the end of 1998. As exporters provided export prices daily for middlemen, monopsony position was given to them in this contract. How- ever, the monopsony position of middlemen made
possible keeping the farm-gate price as a relatively low percentage of export prices whilst passing the risk of price fluctuations onto the small farmers. In other words, due to the farmers’ isolation and lack of resources, they have little idea about the price of coffee beans they produced and amounts of coffee beans they should sell. For example, the farm gate prices in Vietnam in 1996 were about only 65%
of export prices (Nguyen 1999; de Fontenay and Leung 2002), so that a bulk of profits was captured by middlemen. Furthermore, as monopsony mid- dlemen were designated exclusively by SOEs, most of coffee beans were delivered to SOEs by them.
The monopsony position of middlemen was given by SOEs. It is likely to be that there was the appar- ent ‘cartel’ among state licensed middlemen, state processors and state exporters, which enabled high profits going to them.
The emphasis of the final period could be laid on the emergence of private middlemen unlicensed by SOEs, which are a kind of intermediary between the small private farmer and foreign investment enterprises (FIEs) or local processing firms since 1999 (see also Lee 2007). As shown in Figure 3, cof- fee middlemen in Vietnam could be divided into two types in accordance with the license allowed by SOEs and the relationships with processing and exporting firms. The first type is middlemen or collectors licensed by SOEs, which was only an intermediary before 1999. As it could have exclusive transactions with state or province pro- cessing firms, their market has been sTable up to now. However, private processing firms have been permitted to engage in coffee exports since 1999 in Vietnam. As a result, the proportion of coffee production processed by SOEs has decreased, while there has been a rapid increase in the number of pri-
vate firms.
The liberalization of coffee exports has resulted in the introduction of private middlemen without license from SOEs, which is the second type of middlemen, so that have undermined the cartel of SOEs and state-licensed middlemen that was in existence prior to the liberalization of export marketing channels. In other words, as it has led to the real competition between SOEs-licensed as- semblers and independent private assemblers, the rate of passing the risk of price fluctuations onto the small farmer has decreased. As they have started to share the risk of price fluctuations, the farm gate coffee prices have increased, compared to the sec- ond period. It is likely to represent that middlemen is not able to possess monopsony power any more
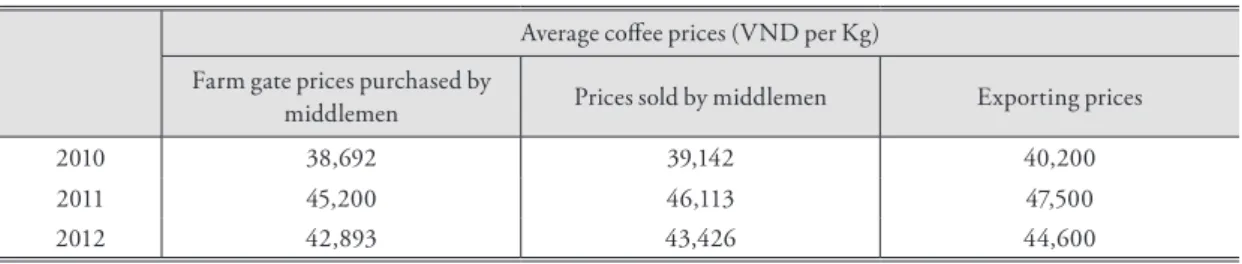
in coffee value chains. According to questionnaire carried out in 2013, the profit margins of middle- men was only Vietnam Dong(VND) 450~913 per kg between 2010 and 2012, and farm gate coffee prices have been almost 96% of exporting prices (see Table 3). An interview with a middleman, who is an owner of buying station located in Krong Pak district, Dak Lak represents changes in trends of middlemen licensed by SOEs since 1999.
“... I have worked as a coffee bean collector since 1995, as a friend of mine recommend that the profit margins from intermediary transac- tions are really high. To be honest, I was not able to be a coffee middleman, because my business was not licensed by SOEs in those Figure 2. Vietnamese coffee commodity chain between 1986 and 1998
Source: Author’s survey, 2013
time. [Thus, transactions with farmers were illegal.] However, as the coffee brokerage busi- ness and processing firms have been privatized and liberalized since 1999, I do not have to be
licensed by SOEs and could have more transac- tions legally with private local or foreign pro- cessing firms than before. However, the profit margin unit has been less than before.” (Inter-
Figure 3. Vietnamese coffee commodity chain since 1999 Source: Author’s survey, 2013
Table 3. Coffee average prices in Dak Lak Average coffee prices (VND per Kg) Farm gate prices purchased by
middlemen Prices sold by middlemen Exporting prices
2010 38,692 39,142 40,200
2011 45,200 46,113 47,500
2012 42,893 43,426 44,600
Note: * Farm gate price purchased by middlemen and price sold by middlemen are an average price of 29 middlemen in Krong Buk and Cu M’gar district, Dak Lak.
** Exporting prices are an average price of 6 foreign and 2 local processing firms surveyed.
Source: Author’s survey, 2013
view with Mr. Tien in April 23, 2013)
The third type of middlemen is exclusive private assemblers who have a kind of local partnerships with processing and exporting firms as state- licensed middlemen have done with SOEs. The main reason why middlemen have exclusive con- tracts with them is that private processing firms could secure sTable and effective coffee bean supply chain management. Processing and exporting firms process coffee beans purchased from all of tiers, and then sell 90% of processed coffee in the interna- tional markets, and 10% in domestic market.
4. Intermediary as an agent of changes in the coffee
value chain in Dak Lak
The main roles of middlemen in coffee value chain in Vietnam are a coffee market facilitator by stimulating the access of coffee farmers to cof- fee business, and an intermediary as an agent of sustainability in coffee supply chains by encourag- ing sustainable coffee production and enhancing capability for coffee cultivation in accordance with the demand of processing/exporting firms. This section would identify the main roles of middlemen in coffee supply chain by investigating the linkages of middlemen as the index of a coffee market facili- tator, and the way in which middlemen deal with the response of coffee farmers to strategies of global coffee processors and exporters in sustainable coffee in Dak Lak.
1) Market facilitator by stimulating the access of coffee farmers
to coffee business
The coffee market is, in general, like pyramid with many farmers at the bottom and fewer assem- blers, processors, and exporters who hold the power at the top (Shannon 2009). In Vietnam, middle- men have played a critical role as a market facilita- tor by stimulating the access of coffee farmers to business in Vietnam. Since 1999 the liberalization of the coffee industry in Vietnam has led to the privatization of SOEs and the introduction of FIEs, especially in processing and exporting sectors, so that there has been significant increases in the number of private independent assemblers. How- ever, new institutional environment effected from the late 1990s has made difficult farmers to access coffee markets directly. Although SOEs-licensed assemblers had played a role as an intermediary be- tween farmers and SOEs before 1999, they have not stimulated the access of coffee farmers to markets.
Their markets were restricted by the structure of the Vietnamese coffee industry governed by SOEs.
Also, the cartel of SOEs and SOEs-licensed assem- blers had kept their profit margins to a minimum.
However, due to changes in the structure of coffee value chains in Vietnam since 1999, the market power monopolized by middlemen has been trans- ferred to farmers partly by sharing the risk of price fluctuations with them. Therefore, it represents that changes in institutional environment centering on the coffee industry in Vietnam has led middlemen to stimulate the access of farmers to processors and exporters by providing buyers for them.
In addition, the source of coffee beans purchase and sales is various in accordance with the type
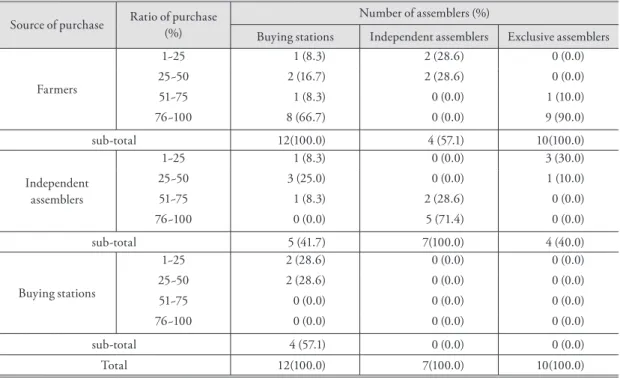
of middlemen, although the main source of them for most stakeholders is farmer. As shown Table 4, the main source of coffee beans purchased by buying stations is farmers. In terms of the propor- tion of buying station by the resource of purchase, although purchases from farmers account for 100%, they also purchase from independent as- semblers and other buying stations, accounting for 41.7% and 57.1% respectively. However, the ratio of purchase from both of them is less than 50%.
Their main markets are other buying stations and processing and exporting firms in Dak Lak (Table 5). All of them sold coffee beans to other buying stations7), and 58% of buying stations sold to pro- cessing and exporting firms.
For Independent assemblers, their main sources of coffee beans purchase are other independent as-
semblers and farmers. All independent assembler purchased coffee beans from other independent assemblers, and 57.1% of them from farmers. More specifically, independent assemblers who purchased over 51% of coffee beans from other independent assemblers accounted for about 100% (Table 4).
It represents independent assemblers surveyed in this research could be divided into 2nd tier and 3rd tier. In other words, it is likely to show 2nd tier as- semblers purchased 3rd tier assemblers8). In terms of markets, they sell coffee beans to all of middle- men and processing and exporting firms (Table 5).
However, although the number of them sold coffee beans to other independent assemblers account only 71.5%, and their ratio of sales is less than 50%.
Unlike this, all of them sold to buying stations, and 58% in the number of them sold coffee beans to
Table 4. Sources of coffee bean purchase by the type of middlemen in Dak Lak Source of purchase Ratio of purchase
(%)
Number of assemblers (%)
Buying stations Independent assemblers Exclusive assemblers Farmers
1~25 1 (8.3) 2 (28.6) 0 (0.0)
25~50 2 (16.7) 2 (28.6) 0 (0.0)
51~75 1 (8.3) 0 (0.0) 1 (10.0)
76~100 8 (66.7) 0 (0.0) 9 (90.0)
sub-total 12(100.0) 4 (57.1) 10(100.0)
Independent assemblers
1~25 1 (8.3) 0 (0.0) 3 (30.0)
25~50 3 (25.0) 0 (0.0) 1 (10.0)
51~75 1 (8.3) 2 (28.6) 0 (0.0)
76~100 0 (0.0) 5 (71.4) 0 (0.0)
sub-total 5 (41.7) 7(100.0) 4 (40.0)
Buying stations
1~25 2 (28.6) 0 (0.0) 0 (0.0)
25~50 2 (28.6) 0 (0.0) 0 (0.0)
51~75 0 (0.0) 0 (0.0) 0 (0.0)
76~100 0 (0.0) 0 (0.0) 0 (0.0)
sub-total 4 (57.1) 0 (0.0) 0 (0.0)
Total 12(100.0) 7(100.0) 10(100.0)
Source: Author’s survey, 2013
processors and exporters.
Exclusive assemblers also purchased coffee beans from farmers directly. All exclusive assembler purchased from farmers, and 40% of them from independent assemblers (Table 4). It is very similar to independent assemblers, in fact, as they are same tier as independent assemblers. However, their main market is fairly different. While the main market of independent assemblers is buying station, the main market of exclusive assemblers is process- ing and exporting firms. All of the one sold coffee beans to buying stations, whereas all of the other sold to processors and exporters (Table 5).
The main reasons why the source of coffee beans purchase and sales by the type of middlemen is var- ious could be laid down strategies of coffee proces- sors and exporters. Processing and exporting firms
have attempted to take advantage of various sources of purchases and sales to cut down costs involved in transactions with farmers. According to survey car- ried out in Dak Lak, the average amounts of coffee beans purchased by middlemen are 2,283 tons per buying station, 1,224 tons per independent assem- bler (391 ton per 3rd tier assembler), and 605 tons per exclusive assembler. The average amounts of coffee beans purchased by processing and exporting firms are around 60,000 tons. Should middlemen are not organized in a hierarchical community, one processing and exporting firms should control over around 100 assemblers to keep up with exist- ing amounts of coffee beans9). It would result in a significant increase in costs involved in transactions with those middlemen. Therefore, processing and exporting firms should have contracts with higher Table 5. Sales of coffee bean by the type of middlemen in Dak Lak
Source of
sales Ratio of purchase (%)
Number of Assemblers (%)
Buying stations Independent assemblers Exclusive assemblers
Independent assemblers
1~25 0 (0.0) 2 (28.6) 2 (20.0)
25~50 0 (0.0) 3 (42.9) 3 (30.0)
51~75 0 (0.0) 0 (0.0) 0 (0.0)
76~100 0 (0.0) 0 (0.0) 0 (0.0)
sub-total 0 (0.0) 5 (71.5) 5 (50.0)
Buying stations
1~25 2 (16.7) 2 (28.6) 1 (10.00
25~50 4 (33.3) 1 (14.3) 0 (0.0)
51~75 2 (16.7) 0 (0.0) 0 (0.0)
76~100 4 (33.3) 4 (57.1) 0 (0.0)
sub-total 12(100.0) 7(100.0) 1 (10.0)
Processors/
Exporters
1~25 2 (16.7) 1 (14.3) 0 (0.0)
25~50 2 (16.7) 0 (0.0) 0 (0.0)
51~75 1 (8.3) 1 (14.3) 3 (30.0)
76~100 2 (16.7) 2 (28.6) 7 (70.0)
sub-total 7 (58.3) 4 (57.1) 10 (100.0)
Total 12(100.0) 7(100.0) 10(100.0)
Source: Author’s survey, 2013
tiers such as buying stations and 2nd tier assemblers to reduce transaction costs. However, the main source of coffee beans for all stakeholder is farm- ers apart from processors and exporters. As shown in Figure 4, in particular the proportion of coffee purchase of buying stations from farmers is over 70%. Also, the main purchase source of processors and exporters is exclusive assemblers. It shows that the use of various type of middlemen in the coffee sales and purchases depends not on transaction costs, but on securing sTable supply coffee chains by facilitating the access of farmers to global coffee markets.
2) An intermediary as an agent of sustainable coffee
Another role of middlemen in Dak Lak is an intermediary as an agent of sustainability in coffee supply chains by encouraging sustainable coffee production and enhancing capability for coffee cultivation in accordance with the demand of processing/exporting firms. Global processors and
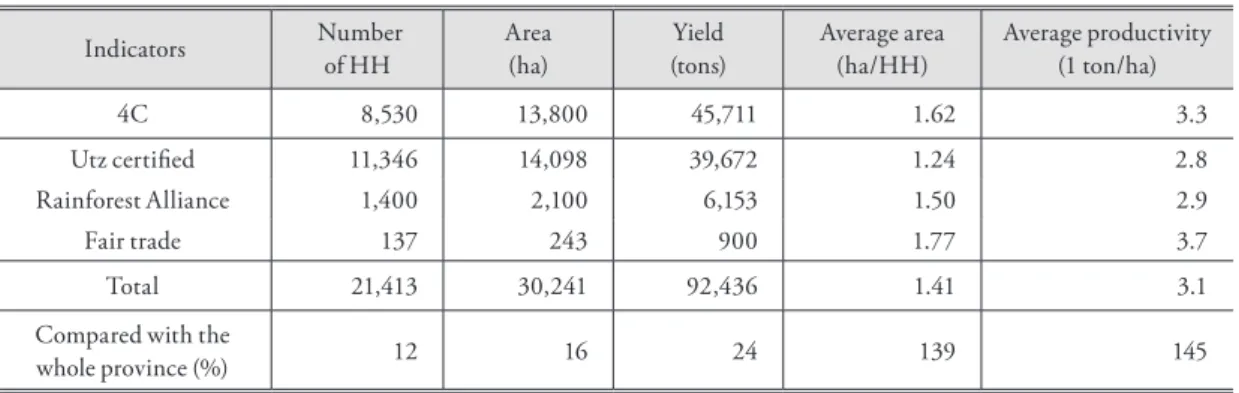
exporters have acted as a facilitator ad supporter for farmers to become sustainable coffee members in Vietnam, because they could have benefits from incentives of sustainable buyers10). Also, sustainable coffee certification itself is regarded as the quality of coffee beans by importers (see COSA 2013). There- fore, processors have enhanced the production of sustainable coffee, so that there has been significant increases in the production of sustainable coffee in Dak Lak (Table 6).
However, as mentioned earlier, FIEs are not able to have direct contract with coffee farmers. Then, how do processors reach thousands of small farm- ers, to control over the quality of coffee beans as certificated sustainable coffee? The way in which control over the quality of coffee beans in accor- dance with the requirement of sustainable coffee is an increase in the use of exclusive assemblers to global processors to secure sTable sustainable cof- fee beans provision. According to survey carried out in 2013, all assembler located in Doan Ket commune has exclusive contract with Dak Man, England-based international trader, and deal with Figure 4. Source of coffee purchase and sales by the type of middlemen in Dak Lak
Note: Flows of purchases and sales are based on transaction amounts by the type of middlemen.
Source: Author’s survey, 2013
sustainable coffee beans ordered by Dak Man. In reality, however, exclusive assemblers have played little roles for enhancing capability for sustainable coffee cultivation, as global coffee processors have provided training directly to farmers on cultivation practices, such as irrigation, fertilization, pruning, weeding, harvesting, and pesticide control (COSA 2013). Nonetheless, an increase in the use of exclu- sive assemblers is a way to create an indirect path to enable FIEs to reach thousands of farmer, so that farming practices have improved in accordance with the certification of sustainable coffee criteria.
5. Conclusion
The research has identified some implications of coffee middlemen as an intermediary of changes in local economies in Dak Lak, Vietnam by investi- gating the transitions in the characteristics of mid- dlemen and coffee value chains centering around middlemen. In terms of changes in the characteris- tics of coffee middlemen in Vientam, as middlemen in Vietnam was licensed by SOEs before 1999, the
‘cartel’ could be established between state licensed middlemen and state exporters, so that it made pos- sible keeping the low farm-gate price by monopoliz- ing information on coffee prices whilst passing the risk of price fluctuations onto the small farmers.
However, since 1999 the liberalization of coffee exports has resulted in the introduction of private middlemen without license from SOEs. It has led to real competitions with SOEs-licensed assemblers, so that the rate of passing the risk of price fluctua- tions onto the small farmer has decreased, and the farm gate coffee prices have increased. It is likely to undermine the cartel of SOEs and state-licensed middlemen. These transitions in Vietnam have some implications for changes in local economies.
Firstly, coffee middlemen in Dak Lak has played a significant role in facilitating the access of farmers to markets by providing buyers for farmers thanks to changes in institutional environment. According to Act 2 issued by the MOT in Vietnam, FIEs is not allowed to buy row materials or subsidiary ma- terials directly from coffee farmers. It has led cof- fee processors and exporters, in particular foreign capitals, to buy coffee beans via assemblers to secure coffee supply chains.
Table 6. Sustainable coffee in Dak Lak, 2011
Indicators Number
of HH
Area (ha)
Yield (tons)
Average area (ha/HH)
Average productivity (1 ton/ha)
4C 8,530 13,800 45,711 1.62 3.3
Utz certified 11,346 14,098 39,672 1.24 2.8
Rainforest Alliance 1,400 2,100 6,153 1.50 2.9
Fair trade 137 243 900 1.77 3.7
Total 21,413 30,241 92,436 1.41 3.1
Compared with the
whole province (%) 12 16 24 139 145
Source: In-house data of the 4C office and UTZ certified & Solidaridad office in Vietnam
What is more, the source of coffee beans pur- chase and sales is various in accordance with the type of middlemen, although the main source of them for most stakeholders is farmers. In general, the lowest tier of middlemen purchase coffee beans from farmers, and other higher tiers attempt to take advantage of lower or same tiers to cut down costs involved in direct transactions with the number of farmers. However, the main source of purchase for exclusive assemblers and buying stations is farmers, rather than other lower tiers of middlemen. The main reasons for this could be laid down strategies of each stakeholder. They prefer direct contracts with farmers to secure sTable coffee supply chains and better quality coffee beans in accordance with the minimum requirements from global processors.
It shows that the use of various type of middlemen in the coffee sales and purchases depends not on transaction costs, but on securing sTable supply coffee chains by facilitating the access of farmers to global coffee markets.
Secondly, middlemen in Vietnam have played a critical role as an agent of sustainable coffee produc- tion. As global processors have benefits from incen- tives of sustainable coffee buyers, and certification coffee itself is regarded as the quality of coffee beans by importers, global processors should act as facili- tators or supporters for farmers to become sustain- able coffee members. However, there is no way to reach thousands of small farmers to control over th quality of coffee beans as certificated coffee. There- fore, global processors have taken advantage of ex- clusive assemblers to secure sTable sustainable cof- fee provisions in value chains. It is a way to create an indirect path to thousands of farmer to improve cooffee farming practices. The role of exclusive as- semblers has been indirect control over farming
practices in accordance with the sustainable coffee certification criteria.
Consequently, the research argues that a series of coffee middlemen in Vietnam has not played as
‘coyote’ which is an exploitative force in the lives of small and poor coffee farmers by controlling over production, paying unfair prices for labor and goods, and participating in fraudulent practices to maximize their own profits, played a critical role as an intermediary of change in local economies by facilitating the access of coffee farmers to global markets and encouraging the sustainability of cof- fee production in local economies.
Acknowledgement
The author would like to appreciate Dr. Phan Viet Ha(Western Highland Agriculture and Sci- ence Institute) and Dr. Ngyuen Huu Ngu(Hue University of Agriculture and Forestry), for their kind cooperations for this research.
Notes
1) This led to the rapid growth in migration to Dak Lak prov- ince. During this period, the number of unofficial migrants was 4 times of official migrants.
2) The coffee harvested area in Vietnam has also increased sig- nificantly from 13.4 thousand ha in 1975 to 119.3 thousand ha in 1990, 265 thousand ha in 2000 and 600 thousand ha in 2012(Thang 2012).
3) This farming system is a kind of a long term contract be- tween SOE and farmer for the land of coffee cultivation.
Coffee farmers who rent land from SOEs could require premium and compensation for the land rights when they entrust other farmers with the right of land or return the
land to SOEs. It is called ‘khon system’ in Vietnamese (Vo Nhan Tri, 1992, 190).
4) In addition to changes to the family-based farming system driven by SOEs, there are three reasons why the scale of private farms has not been expanded since doi moi (Tran 2009). Firstly, small scale coffee farm has not been recog- nized as small in the Vietnamese context. While the aver- age area of agriculture land is 0.24 ha per household, the average area of coffee land is 1.24 ha. Secondly, coffee is required more investment costs compared to other crops.
Finally, as it takes 3 years to harvest coffee beans after coffee plant, during this period farmers are not able to create any profits.
5) Coffee farmers should obtain Red Book, which is the certi- fication of land use, to have these kinds of rights.
6) There are a number of benefits for coffee farmers who rent land from SOEs. They could borrow money from SOEs with same interest rates as SOEs borrow from banks, which is much lower than personal interest rates. Also, they do not have to rush pay back and able to put off debt redemption, as SOEs never press for payment against them. In addition, they could have technology supports, health insurance, fa- cilities maintenance, etc. from SOEs.
7) It is likely to imply that most buying stations surveyed in this research are relatively small size, compared to other buying stations in Dak Lak.
8) Newly emerged middlemen are organized in a hierarchical community. They could be divided into three tiers accord- ing to the geographical scope and size of their business activities. The 1st tier is buying station whose geographical scope is the district or province level in Vietnam. The geo- graphical scope of 2nd and 3rd tier’s business activities are the district or commune level.
9) The average coffee beans amounts of 3rd tier assemblers and processing and exporting firms are calculated from the questionnaire surveyed in Dak Lak.
10) In the case of the Common Code for the Coffee Commu- nity (4C), the incentive from sustainable coffee buyers for the production of sustainable coffee is VND 300 per kg for processors and VND 100 per kg for farmers.
Reference
Agergaard, J., Fold, N. and Gough, K., 2009, Global-local interaction: socioeconomic and spatial dynam- ics in Vietnam’s coffee frontier, The Geographical Journal 175(2), Royal Geographical Society with IBG.
Consumer International, 2005, From bean to cup: how con- sumer choice impacts upon coffee producers and the environment, Consumer International and IIED.
COSA(Committee on Sustainability Assesment), 2013, Vietnam coffee: A COSA survey of UTZ certified farms, COSA.
Doan, T.N., 2005, Vietnamese coffee industry after 5 years crisis and it’s future orientation, ICO www.ico.org/
event_pdfs/wcc2/presentations/nhan.pdf accessed in April, 2013.
Doutriaux, S., Geisler, C. and Shively, G., 2008, Com- peting for coffee space: Development –induced displacement in the central highlands of Vietnam, Rural Sociology 73(4), 528-554.
de Fontenay, P. and Leung, S., 2002, Managing commod- ity price fluctuations in Vietnam’s coffee industry, APSEG Economics and Development Working Papers at the ANU.
Greenfield, G., 2002, Vietnam and the world coffee crisis:
Local coffee riots in a global context, http://focus- web.org/publications/2002 /Vietnam-and-the- world-coffee-crisis.html accessed in May 2013.
Ha, D. T. and Shively, G., 2008, Coffee boom, coffee bust and smallholder response in Vietnam’s central highlands, Review of Development Economics 12(2), 312-326.
ICARD and Oxfam, 2002, The impact of the global coffee trade on Dak Lak Province, Viet Nam: Analysis and policy recommendations, ICARD, Oxfarm Great Britain and Oxfam Hong King.
ICO(International Coffee Organization), www.ico.org ac- cessed in May 2013
Lee, S-C., 2007, Value chain and networks of foreign di-
rect investment firms in transitional economies:
Korean textile and clothing foreign direct invest- ment in Vietnam, Journal of the Economic Geo- graphical Society of Korea 10(2), 93-115.
Lim, H. and Wei, L .T., 2007, Commodity income management: selected southeast Asian econo- mies, International Institute for Sustainable Development(IISD), www.iisd.org/pdf/2007/
trade_price_case_southeastasia.pdf accessed in March 2013.
Loan, D. T., Phong, L.U and Hoa, H.V, 2010, Viet Nam’s Economy: After 20 years of renewal(1986-2006), The Gioi Publisher.
Luong, Q. and Tauer, L., 2006, A real options analysis of coffee planting in Vietnam, Agricultural Economics 35, 49-57.
Marsh, A., 2009, Diversification by smallholder farmers:
Viet Nam robusta coffee, Agricultural manage- ment, marketing and finance working document 19, FAO.
Nam, D. H.(eds.), 2011, Economic Development in Viet- nam: Some issues, The Gioi Publisher.
Nguyen, A.T., 1999, The export of agricultural commodities in developing countries-the case of Vietnam’s coffee industry in period 1986-1998, unpublished Master Thesis, National Economics University.
Roldan-Perez, A et al, 2009, Coffee, cooperation and compe- tition: A comparative study of Colombia and Viet- nam, final draft, UNCTAD.
Rosenberg, D., Eckstein, M. and Brett, C., 2009, Traders as agents of sustainability in coffee and cocoa supply
chains, Dutch Sustainable Trade Initiative.
Shannon, W., 2009, Economic stimulation: the history and hope of coffee in development, Transnational Law & Contemporary Problems 18(169), 170-196.
Thang, T.C., 2012, Introduction to Buon Ma Thout Coffee Exchange Center(BCEC), Institute of Policy and Strategy for Agriculture and Rural Devlopment Vietnam.
Tran, P., 2009, Small is beautiful? Small farms and the Viet- namese coffee expansion, Amherst College.
Tuan, B., 2008, Implementation of coffee value chain for ethnic minorities, Rural Development Dak Lak(RDDL).
Vo Nhan Tri, 1992, Vietnam’s Economic Policy Since 1975, Singapore, Institute of Southeast Asian Studies.
World Bank, 2005, The socialist republic of Vietnam: Coffee sector report, The International Bank for Recon- struction and Development Agriculture & Rural Development Department.
Correspondence: Sung-Cheol Lee, Department of Geog- raphy Education, Dongguk University, Pildong 3, Jung-gu, Seoul, Korea, Tel: 82-2-2260-3402, Fax:
82-2-2285-3409, E-mail: [email protected] 교신: 이승철, 서울시 중구 필동 동국대학교 사범대학 지
리교육과, 전화: 02-2260-3402, 팩스: 02-2285- 3409, 이메일: [email protected]
최초투고일 2013년 7월 5일 수 정 일 2013년 7월 15일 최종접수일 2013년 7월 23일