ISSN 1229-2427 (Print) ISSN 2288-646X (Online) http://dx.doi.org/10.7843/kgs.2014.30.1.17 한국지반공학회논문집 제30권 1호 2014년 1월 pp. 17 ~ 25
JOURNAL OF THE KOREAN GEOTECHNICAL SOCIETY Vol.30, No.1, January 2014 pp. 17 ~ 25
해양 실트질 모래의 비배수 동적 거동에 대한 평균 및 반복전단응력의 영향
Effect of Average and Cyclic Shear Stress on Undrained Cyclic Behavior of Marine Silty Sand
무하마드 사프다르1 Muhammad Safdar
손 수 원2 Son, Su-Won
김 진 만3 Kim, Jin-Man
Abstract
Offshore wind turbine foundations are subjected to wind, current and wave loadings. Hence, both static and cyclic behaviors of foundation’s soil are important for the design of offshore wind turbine foundation. Undrained cyclic behaviors of soils depend upon the number of loading cycles, vertical effective stress, cyclic shear strain, relative density, and the combination of cyclic and average shear stresses. In order to evaluate the effect of average and cyclic shear stresses on the undrained cyclic behavior of marine silty sand, cyclic direct simple shear (CDSS) tests are performed with relative density of 85%, vertical effective stress of 200 and 300 kPa, and failure criteria of either 15% double amplitude cyclic shear strain (γcyc) or permanent shear strain (γp). The results are presented in the form of design graphs or contour diagrams. The undrained cyclic behavior of marine silty sand is found to be dependent on cyclic and average shear stresses and/or the combination of both shear stresses. It is found that when significant average shear stress exists the permanent or progressive shear strain is the govering failure criteria instead of cyclic shear strain.
요 지
해상풍력발전기의 기초는 바람, 조류, 그리고 파도 하중을 받기 때문에 해상풍력발전기 기초를 설계하는 데 있어 반복하중을 받는 기초지반의 전단거동 평가가 필요하다. 지반의 비배수 동적 전단거동은 반복하중 횟수, 수직 유효응 력, 반복 전단변형률, 상대 밀도, 그리고 평균 및 반복전단응력의 조합에 영향을 받는다. 본 연구에서는 해양 실트질 모래의 비배수 동적 거동에 대한 평균 및 반복전단응력의 영향을 평가하기 위하여 반복단순전단시험(CDSS)을 수행하
였으며 상대밀도 85%, 수직 유효응력 200kPa과 300kPa의 시험조건에서 15%의 이중진폭 동적전단변형률(γcyc)과
영구전단변형률(γp)를 파괴 기준으로 적용하였다. 시험결과는 설계 그래프와 등고선도로 나타내었다. 결과에 따르면
해양 실트질 모래의 비배수 동적 거동은 평균 및 반복전단응력과 두가지 전단응력의 조합에 의해 크게 변하는 경향을
보였다. 평균전단응력이 존재하는 경우에는 반복전단변형보다는 영구변형에 의해 파괴가 결정되는 것으로 나타났다.
1 비회원, Graduate Student, Dept. of Civil & Environmental Engrg., Pusan National Univ., Busan, South Korea 2 정회원, Member, Ph.D Candidate, Dept. of Civil & Environmental Engrg., Pusan National Univ., Busan, South Korea
3 정회원, Member, Prof., Dept. of Civil & Environmental Engrg., Pusan National Univ., Busan, South Korea, Tel: +82-51-510-2349, Fax: +82-51-513-9596, [email protected], Corresponding author, 교신저자
* 본 논문에 대한 토의를 원하는 회원은 2014년 7월 31일까지 그 내용을 학회로 보내주시기 바랍니다. 저자의 검토 내용과 함께 논문집에 게재하여 드립니다.
Copyright © 2014 by the Korean Geotechnical Society
This is an Open-Access article distributed under the terms of the Creative Commons Attribution Non-Commercial License (http://creativecommons.org/licenses/by-nc/3.0) which permits unrestricted non-commercial use, distribution, and reproduction in any medium, provided the original work is properly cited.
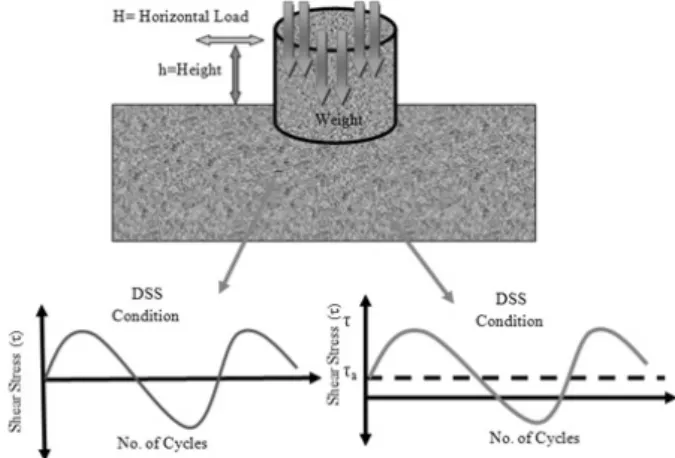
Fig. 1. Simplified stress conditions along a potential failure surface in the soil beneath a structure under cyclic loading (modified from Andersen, 2009)
Keywords : Cyclic Direct Simple Shear (CDSS), Undrained cyclic behavior, Average and cyclic shear stress, Relative density, Marine silty sand
1. Introduction
Offshore wind turbine foundations are built over the marine soil deposits. Marine soils are subjected to severe cyclic loading due to currents and waves. Knowledge about the strength and deformation properties of marine soil deposits subjected to cyclic loading is very vital for design of offshore wind turbine foundation. The cyclic behavior of marine soil deposits has been an important topic over the past few decades, especially at Norwegian Geotechnical Institute (Andersen, 2009). Andersen and his colleagues (1988) studied soil behavior under cyclic loading and presented a database which can be used to determine soil parameters for early feasibility studies of gravity structures on clay. He (1988) also performed undrained cyclic triaxial and direct simple shear tests with various combinations of static and cyclic shear stresses on Drammen clay. Andersen (2009) explains how soil behaves under cyclic loading, and presented diagrams with cyclic shear strength of clay, silt and sand. When designing foundations for offshore wind turbines various methods have been used to include the effect of cyclic loadings in design procedure (Nielsen et al., 2012). One of the methods is design graphs, which accounts for stresses generated by cyclic loads and deformation they lead to. Goulois and his colleagues (1985) studied the effect of average or sustained shear stresses on the cyclic degradation of clay.
This paper presents the effect of average and cyclic shear stress on the undrained cyclic behavior of marine silty sand. The undrained cyclic behavior of marine silty sand is found to be dependent on cyclic and average shear streses, and also the combination of both shear stresses.
2. Theory
2.1 General Response of Soil Subjected to Cyclic Loading A soil can be subjected to many different stress conditions
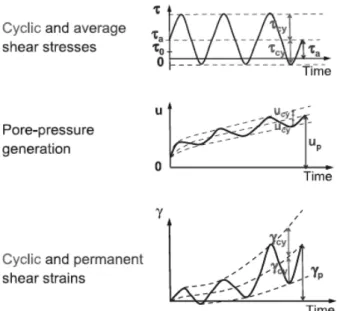
such as purely cyclic stress, static or average stress, or a combination of both. The cyclic load is defined by the cyclic shear stress, τcy, and the average shear stress, τa, with corresponding shear strain, γcy and γp, which is illustrated in Fig. 3. τa consists of two parts: τ0 which is the shear stress obtained from the in-situ condition, and Δτ = τa - τ0, which is the average shear stress from further loading. This can include the self-weight of a structure and the mean shear stress created by cyclic loading. Andersen (2009) shows this clearly in a study on Drammen clays.
Drammen clay samples were tested in cyclic triaxial and cyclic simple shear conditions for different combinations of static or average and cyclic shear stresses. In our study cyclic simple shear tests have been performed with zero static or average shear stress (τa = 0) and with some average shear stress (τa ≠ 0).
The soil under the structure is subjected to various stress conditions such as cyclic and average shear stresses. The structure can also be subjected to various types of loadings such as triaxial and direct simple shear DSS. Fig. 1 shows a simplified image of the stress conditions along a potential failure surface beneath a gravity structure. The development of pore pressure and shear strain is presented in Fig. 2 with time for a soil element subjected to undrained cyclic
Fig. 2. Pore pressure and shear strain as a function of time under undrained cyclic loading, u pore pressure, γ shear strain, τ0 initial consolidation shear stress (Andersen, 2009)
Fig. 3. Stress- Strain behavior under cyclic loading (Andersen, 2009)
(a) (b)
Fig. 4. Number of cycles to failure and failure mode as a function of average and cyclic shear stresses for cyclic DSS tests on normally consolidated Drammen clay (Andersen, 2009)
loading with a constant cyclic shear. The cyclic loading generates permanent and cyclic pore pressure component.
The increase in pore pressure results in increase in permanent (γp) and cyclic (γcy) shear strains.
The general behavior of soil subjected to cyclic loading can be seen in Fig. 3.
2.2 Design Contour Diagram
Importance of the average and cyclic shear stresses for the cyclic behavior was reported by Andersen (2009).
Fig. 4 (a) presents the results of 1 monotonic and 9 cyclic tests and Fig. 4 (b) presents the contour diagram with the same number of cycles to failure based on the data in Fig. 4 (a); τa,f, average shear stress at failure; τcy,f, cyclic shear stress at failure; SuDSS, static shear strength.
The location of the various points is determined by the average and cyclic shear stresses under which the tests were run, and the number along each point gives the number of cycles to failure, Nf, and the ratio of permanent and cyclic shear strains at failure, γp/γcy. Failure was defined as either a permanent or a cyclic shear strain of 15%.
Randolph and Gourvenec (2011) also produced such contour diagrams. They carried out the unsymmetrical cyclic direct simple shear test on normally consolidated Drammen clay with the failure defined by γp or γcy =
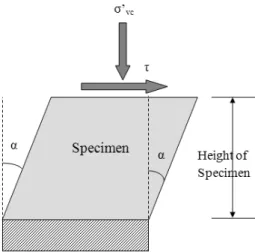
Fig. 5. Simple Shear Condition
15%. Nielsen and his colleagues (2012) compared the normalizing parameters for cyclic and average shear stresses.
When normalizing cyclic and average shear stresses for use in design diagrams, vertical effective stress (σ’vc) was found insufficient to use as a normalization parameter in the undrained case, as it did not take pore pressure into account.
This was important, since the undrained shear strength for dense sand was considered to be governed by cavitation.
Therefore, the undrained shear strength, Cu or Su, was used as the normalization parameter for the modified design graph and was used for other design graphs in the undrained case (Nielsen et al., 2012).
The plot for DSS tests on normally consolidated clay is presented in Fig. 4, which shows the results from one monotonic and 9 cyclic direct simple shear tests. The location of the various points is determined by the average and cyclic shear stresses under which the tests were run, and the numbers along each point give the number of cycles to failure, Nf, and the permanent and cyclic shear strains at failure, γp/γcy , SuDSS is the undrained shear of normally consolidated Drammen Clay. Andersen and Berre (1999) studied the effect of average and cyclic shear stress and produced same design graph using vertical effective stress as a normalization parameter (σ’vc). The tests were conducted on Baskarp sand having relative density (Dr) of 95% with cyclic or permanent shear strain failure criteria of 3%. This paper used vertical effective stress (σ’vc) as a normalizing parameter for cyclic stress and average stress.
While Nielsen et al. (2012) conducted tests with a relative density of 80% in order to simulate offshore conditions where relative densities are relatively high. The purpose was to develop design diagrams, which can be used in estimating the undrained cyclic behavior of Frederikshavn Sand.
2.3 Cyclic Direct Simple Shear Test
In Swedish Geotechnical Institute (SGI) direct simple shear apparatus used the cylindrical sample and was completely surrounded by stack ring. This apparatus’s design was modified by Bjerrum and Landva (1966) and used a wire- reinforced membrane. In this paper, cyclic direct simple shear (CDSS) apparatus using wire-reinforced membrane is employed to investigate the undrained cyclic behavior of marine silty sand. The CDSS test procedure is based on that of a constant-volume direct simple shear testing of soils, which has been studied extensively for half a century and is described in the standard ASTM D6528-07.
The sample is consolidated under a normal load within a wire-reinforced membrane or a stack of thin rings that provide lateral confinement. Once consolidation is complete, a horizontal shear force is applied to one end (Monotonic) or two sides (cyclic) of the sample. The sample height is continuously maintained during shear to ensure constant volume. Rather than measuring pore pressures, which would require complete saturation of the sample, the pore pressure response is inferred from the change in vertical stress which is monitored throughout the test (Baxter et al., 2010).
In this way changes in applied vertical stress (σ’vc), which are required to keep the sample height constant, are assumed to be equal to the excess pore water pressure (Δu) that would develop if the test were truly undrained with pore pressure measurements (Dyvik et al., 1987).
3. Experiment
3.1 Experimental Program
The laboratory testing program for this study is designed to analyse the undrained cyclic behavior of marine silty
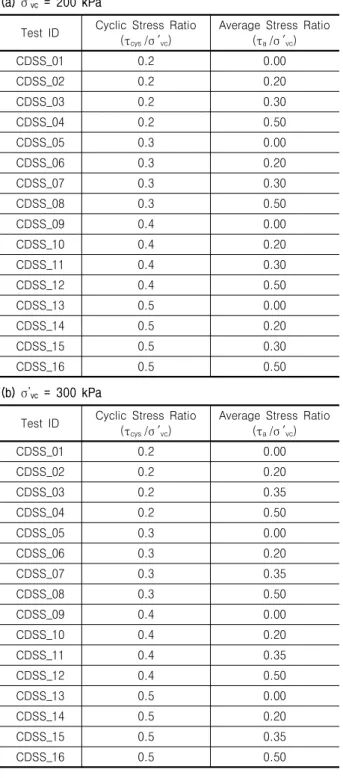
Table 1. Summary of Testing Program (a) σ’vc = 200 kPa
Test ID Cyclic Stress Ratio (τcys/σ ′vc)
Average Stress Ratio (τa/σ ′vc)
CDSS_01 0.2 0.00
CDSS_02 0.2 0.20
CDSS_03 0.2 0.30
CDSS_04 0.2 0.50
CDSS_05 0.3 0.00
CDSS_06 0.3 0.20
CDSS_07 0.3 0.30
CDSS_08 0.3 0.50
CDSS_09 0.4 0.00
CDSS_10 0.4 0.20
CDSS_11 0.4 0.30
CDSS_12 0.4 0.50
CDSS_13 0.5 0.00
CDSS_14 0.5 0.20
CDSS_15 0.5 0.30
CDSS_16 0.5 0.50
(b) σ’vc = 300 kPa
Test ID Cyclic Stress Ratio (τcys/σ ′vc)
Average Stress Ratio (τa/σ ′vc)
CDSS_01 0.2 0.00
CDSS_02 0.2 0.20
CDSS_03 0.2 0.35
CDSS_04 0.2 0.50
CDSS_05 0.3 0.00
CDSS_06 0.3 0.20
CDSS_07 0.3 0.35
CDSS_08 0.3 0.50
CDSS_09 0.4 0.00
CDSS_10 0.4 0.20
CDSS_11 0.4 0.35
CDSS_12 0.4 0.50
CDSS_13 0.5 0.00
CDSS_14 0.5 0.20
CDSS_15 0.5 0.35
CDSS_16 0.5 0.50
sand when subjected to cyclic loads for different combi- nations of parameters such as cyclic shear stress, average shear stress, no. of loading cycles, and relative density.
Cyclic loading from traffic and earthquakes have lower cyclic load periods (~1 s) than wave loading (~10-20 s) and this needs to be taken into account (Andersen, 2009).
Therefore, in this study for marine silty sand, tests are performed at a frequency of 0.1 Hz. All the tests are
performed on relative density of 85%. Nielsen et al. (2012) conducted tests with a relative density of 80% in order to simulate offshore conditions where relative densities are relatively high. The failure criteria of 15% cyclic double amplitude shear strain or permanent shear strain is selected for all the tests. The relative density (85%) is the initial relative density before consolidation step.
Specific gravity of material tested is Gs = 2.65. To produce in-situ (Ko) stress conditions, a vertical consolidation stress must be applied to the sample prior to shearing. Applied vertical stresses simulate the loads from overburden material located over the soil sample. A normal consolidation stress of 200 or 300 kPa is applied in steps for all specimens.
3.2 Sample Preparation
Various studies have shown that soil behavior is highly dependent on laboratory sample preparation techniques (e.g., Mulilus et al., 1977; Miura and Toki, 1982). Several methods of sample preparation are available in the literature.
Most commonly used sample preparation techniques are air pluviation, water pluviation, slurry deposition, dry deposition and moist tamping. The major factors which affect the relative density of air pluviated sands are the height of particle drop (Vaid and Negussey, 1988) and the rate of deposition (Miura and Toki, 1982). Air Pluviation of well-graded sand is not as successful as air pluviation of poorly-graded sand. The oldest laboratory reconstitution technique is moist or dry tamping of soil in layers (Lambe, 1951). Several studies have been conducted to assess the uniformity of moist tamped sample, often with conflicting conclusions as to success of the method (Castro, 1969, 1982). Water pluviation technique has been used by several researchers (Lee and Seed, 1967; Vaid and Negussey, 1984). This technique is similar to the air pluviation technique, but sand is pluviated through boiled de-aired water rather than air, thus ensuring sample saturation.
The water pluviation technique produces uniform sample of poorly graded sand (Vaid and Negussey, 1984) but particle size segregation is an issue in water pluviation of well-graded or silty sand. Kuerbis and Vaid (1988) presented a sand sample preparation named as slurry
Table 2. Properties of Soil tested
Properties of Soil Tested
Min. Void Ratio 0.74
Max. Void Ratio 1.18
Coefficient of Uniformity (mm) 1.8
D10 (mm) 0.08
D30 (mm) 0.09
D60 (mm) 0.14
USCS Silty Sand (SM)
Specific Gravity (GS) 2.62
Fig. 6. Enlarged View of Sample within Wire-Reinforced Membrane
(a)
(b)
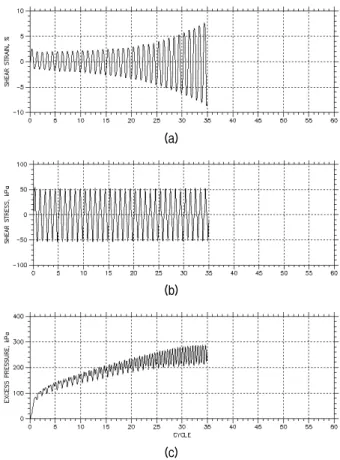
(c)
Fig. 7. (a) Development of cyclic shear strain versus number of loading cycles, (b) Shear stress versus number of loading cycles, (c) Excess pore pressure versus number of loading cycles to reach failure of 15% double amplitude cyclic shear strain or permanent shear strain
deposition method.
Safdar and Kim (2013) studied the cyclic behavior of marine silty sand prepared by using the air pluviation technique followed by the dry tamping technique. On the other hand, in this study dry deposition and dry tamping techniques are successfully used. Table 2 presents the properties of soil tested in this study. A sample weight of 100 g of dry marine silty sand is used and laid in 3~5 layers in a wire-reinforced membrane (diameter = 63.5 mm) to obtain the required relative density (85%). Marine silty sand has minimum voids ratio of 0.74 and maximum voids ratio of 1.18. Fig. 6 shows the sample prepared in the wire-reinforced membrane and ready for the test.
4. Test Results
A total of 32 CDSS tests are performed and effects of average and cyclic shear stresses on the cyclic shear strength are presented in the form of a design graph or
a design diagram as shown in Fig. 13. Fig. 7 (a) shows development of shear strain with the increasing number of loading cycles, and the typical behavior of soil subjected to initial zero consolidation shear stress (τa = 0) or symmetrical loading reaching to cyclic shear strain of 15%.
The 15% of cyclic double amplitude and/or permanent shear strain are taken to be a failure criterion, which has been widely used as a failure criterion (e.g., Anderson, 2009).
In this particular loading case, the shear strain failure (γp = 0 & γcy = 15%) reaches at around 35 number of loading cycles.
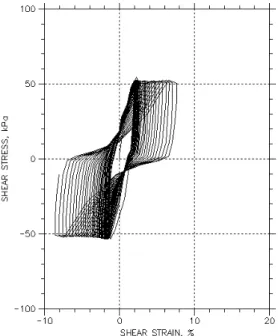
Fig. 8 shows the shear stress versus shear strain with CSR = 0.20, shear strain = 15%, zero average shear stress or symmetrical loading, and vertical effective stress σ’vc
= 300 kPa. The range of cyclic shear stress and average shear stress can be found in Table 1. The corresponding cyclic shear strain and permanent shear strain are shown
Fig. 8. Shear Stress versus shear strain with CSR = 0.20 Shear strain = 15%, (τa = 0) or symmetrical loading, vertical effective stress σ’vc = 300 kPa
Fig. 9. Shear Stress versus normal stress with CSR = 0.20 Shear strain = 15%, (τa = 0) or symmetrical loading, vertical effective stress σ’vc = 300 kPa
(a)
(b)
Fig. 10. (a) Shear stress versus shear strain with CSR = 0.20 Shear strain = 15%, (τa = 105 kPa ) or unsymmetrical loading, vertical effective stress σ’vc = 300 kPa, (b) Shear stress versus normal stress with CSR = 0.20 Shear strain = 15%, (τa = 105 kPa ) or unsymmetrical loading, vertical effective stress σ’vc = 300 kPa
in the design graphs.
Fig. 9 shows the shear stress versus normal stress curve with CSR = 0.20, shear strain = 15%, zero average stress or symmetrical loading, and vertical effective stress σ’vc
= 300 kPa. Cyclic shear strain develops and practically no permanent shear strain is observed in symmetrical loading condition.
Fig. 10 (a) shows the shear stress versus shear strain
curve with CSR = 0.20, shear strain = 15%, average shear stress τa = 105 kPa or unsymmetrical loading, and vertical effective stress σ’vc = 300 kPa. In this particular loading case, cyclic shear strain was developed (γcy = 1.10%) and permanent shear strain (γp = 15%) after 72 number of loading cycles. In genenral, small cyclic shear strain and relatively large permanent shear strain develop with significant average stress ratio.
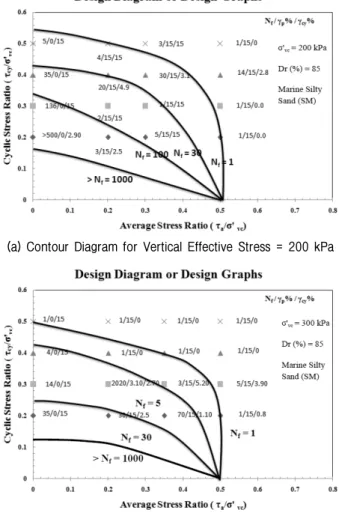
Design diagrams from 32 CDSS tests are presented in Figs. 11 and 12. The location of various points is determined by the average and cyclic shear stresses under which the tests were run, and the numbers along each point represent the number of cycles to failure, Nf, and the permanent and cyclic shear strains at failure, γp/γcy. The maximum shear stress mobilized is the sum of average and cyclic shear stresses at failure. Failure is defined as either a permanent or a double amplitude cyclic shear strain of 15%. Fig. 11 (a) and Fig. 11 (b) shows 16 points separately, subjected to different values of cyclic and average shear stresses. The design contour diagram (Fig. 12) shows that increase of cyclic shear stress generally decreases the number of cycles to reach the shear strain failure criteria.
The contours are extrapolated and drawn to originate from the average shear stress ratio of 0.5 at the condition when
(a) Vertical Effective Stress = 200 kPa
(b) Vertical Effective Stress = 300 kPa
Fig. 11. Design graph or Design Diagram from 32 CDSS tests
(a) Contour Diagram for Vertical Effective Stress = 200 kPa
(b) Contour Diagram for Vertical Effective Stress = 300 kPa Fig. 12. Contour diagram for marine silty sand for number of
cycles Nf to reach either cyclic double amplitude shear strain = 15% or permanent shear strain = 15%
cyclic stress is zero, based on the very few test data near that condition. The origin can be precisely determined through more static and low level cyclic shear stress tests in the future. Almost no permanent shear strain is observed in symmetrical loading condition. As the average shear stress increases, the marine soil deposit fails by progressive or permanent shear strain failure mode. It is also found that when average shear stress ratio increases the cyclic shear strain component decreases and permanent shear strain component increases. The data obtained from these tests agree reasonably well with the data obtained by Andersen (1999, 2004, and 2009). The cyclic shear strength depends on the cyclic and average shear stresses, and a combination of both shear stresses.
5. Summary and Conclusions
Undrained Cyclic behaviors of soils have been known
to depend on the number of loading cycles, vertical effective stress, cyclic shear strain, relative density, and the combination of cyclic and average shear stresses. In order to evaluate the effect of average and cyclic shear stresses on the undrained cyclic behavior of marine silty sand sampled from West coast of Korean peninsula, 32 cyclic direct simple shear (CDSS) tests are performed.
The results are presented in the form of design graphs or contour diagrams. The contours are drawn to begin with the average shear stress ratio of 0.5 at the condition when cyclic stress is zero, based on the limited test data around that condition. Theoretically, the value can be precisely determined through static and low level cyclic shear stress tests.
For specimen preparation, dry deposition and dry tamping techniques are successfully used, without segregation of
fines.
In case of symmetrical loading condition, symmetrical cyclic shear strain develops and practically no permanent shear strain is observed.
In genenral, small cyclic shear strain and relatively large permanent shear strain develop with increase of average shear stress ratio. As average shear stress increases, the marine sily sand fails in progressive or permanent shear strain failure mode. On the other hand, with zero average shear stress, cyclic shear strain failure is the governing failure mode.
The results show that increase of cyclic shear stress generally decreases the number of cycles to reach the defined shear strain failure threshold.
The results agree reasonably well with those from previous research. From the results, it can be concluded that the cyclic shear strength significantly depends on the cyclic and average shear stresses, and a combination of both shear stresses. Therefore, their effects on the cyclic shear strength should be evaluated and be taken into consideration in the design.
In order to comprehensively understand the cyclic shear behavior of marine soil deposits along the West coast of Korean peninsula, further detail and more elaborative experimental program is needed.
Acknowledgements
This research was supported by Basic Science Research Program through the National Research Foundation of Korea (NRF) funded by the Ministry of Education, Science and Technology (No. 2011-0014592).
References
1. Andersen, K. H., Kleven, A., and Heien, D. (1988), “Cyclic soil data for design of gravity structures”, Journal of Geotechnical Engineering, Vol.114, No.5, pp.517-539.
2. Andersen, K. H. and Berre, T. (1999), “Behavior of a dense sand under monotonic and cyclic loading”, In Proceedings of the 12th ECSMGE, Geotechnical Engineering for Transportation Infrastructure, Amsterdam, the Netherlands, 7-10 June 1999.
3. Andresen, L. and Jostad, H.P. (2004), “Analyses of progressive
failure in long natural slopes”, In Numerical Models in Geomechanics:
Proceedings of NUMOG IX, Ottawa, Ont., 25-27 August2004. Edited by G.N. Pande and S. Pietruszczak. Taylor & Francis Group, London. pp. 603-608.
4. Andersen, K. H. (2009), “Bearing capacity under cyclic loading, offshore, along the coast and on land. The 21st Bjerrum Lecture presented in Oslo, 23 November 2007”, Canadian Geotechnical Journal, Vol.46, No.5, pp.513-535
5. Baxter, C. D. P., Bradshaw, A. S., Ochoa-Lavergne, M., and Hankour, R. (2010), “DSS Test Results using Wire-Reinforced Membranes and Stacked Rings”. GeoFlorida 2010 ASCE.
6. Bjerrum, L. and Landva, A. (1966), “Direct-Simple Shear Tests on a Norwegian Quick Clay”, Geotechnique, Vol.16, No.1, pp.1-20 7. Catro, G. (1969), Liquefaction of sands, Ph.D Thesis, Harvard
University, Cambridge, Mass.
8. Dyvik, R., Berre, T., Lacasse, S., and Raadim, B. (1987), “Comparison of truly undrained and constant volume direct simple shear tests”, Geotechnique, Vol.37, No.1, pp.3-10.
9. Goulois, A. M., Whitman, R. W., and Høeg, K. (1985), “Effects of sustained shear stresses on the cyclic degradation of clay”, ASTM Special technical publication, 883, pp.330-351.
10. Kuerbis, R. and Vaid, Y. P. (1988), “Sand Sample Preparation- Slurry Deposition Method”, Soils and Foundations, Vol.28 No.4, pp.107-118.
11. Kuerbis, R. and Vaid, Y. P. (1988), “Sand Sample Preparation- Slurry Deposition Method”, Soils and Foundations, Vol.28, No.4, pp.107-118.
12. Lambe, W. T. (1951), “Soil Testing for Engineers” John Wiley and Sons Inc, New York.
13. Lee, K. and Seed, H. B. (1967), “Dynamic strength of anisotropically consolidated sand”, Journal of Soil Mechanics and Foundation Division, ASCE, pp.169-190
14. Miura, S. and Toki, S. (1982), “A sample preparation method and it effect on static and cyclic deformation-strength properties of sand”, Soils and Foundation, Vol.22, No.1, pp.61-77
15. Mulilus, J. P., Seed, H. B., Chan, C. K., Mitchell, J. K., and Arulanandan, K. (1977), “Effects of sample preparation on sample preparation”, Journal of Getechnical Engineering Division, ASCE 103 (GT2), pp.99-108.
16. Nielsen, S. K., Amir Shajarati, K.W., Sorenson, L. B., Ibsen (2012),
“Behavior of Dense Frederikshavn sand during cyclic Loading”, DCE Technical Memorandum, No.15, pp.1-9
17. Randolph, M. F. and Gouvernec, S. (2011), Offshore Geotechnical Enigineering, Spon Press, UK.
18. Safdar, M. and Kim, J.M. (2013), “Cyclic behavior of marine silty sand”, Electronic Journal of Geotechnical Engineering (EJGE). Vol.18, Pages 209-218
19. Vaid, Y.P. and Negussey, D. (1984), “Relative density of air and water pluviated sand”, Soils and Foundations, Vol.24 No.2, pp.
101-105.
20. Vaid, Y.P., and Negussey, D. (1988), “Preparation of reconstituted sand specimens”, ASTM STP 977.
Received : June 2nd, 2013 Revised : January 14th, 2014 Accepted : January 22nd, 2014