1. Introduction
Exports are to sale domestic goods to foreign countries. The exported goods must first be checked to see if they can be exported, and they must go through
customs export clearance procedures. The export customs clearance procedure is the process from the each port/airport to the transportation of goods between Korea and foreign countries. If the export declaration is passed, it should be loaded on the
Exports Trends by Major Ports⋅Airports and Future Development Direction
Soo-Ho Choi
Division of Business, Sogang University
주요 항만⋅공항별 수출액 동향과 향후 발전 방향
최수호
서강대학교 경영학부 박사수료
Abstract The purpose of this study is to examine the trend of export growth rate and rate of change by each port/airport in Korea. And to analyze which each port/airport are showing a high growth rate. To this end, Incheon Airport, Busan, Incheon, Ulsan, Gwangyang and Pyeongtaek were selected in order of export value. The analysis period for each port/airport was 200 monthly data from September 2001 to April 2018. Pyeongtaek, Incheon and Gwangyang are relatively larger than Busan and Ulsan in the rate of increase and change. This is because export to China and Southeast Asia has increased more than in the US and Japan. As a result of the analysis, exports from Busan, Incheon Airport and Ulsan have recently been shifted to Incheon Airport, Incheon, Gwangyang and Pyeongtaek. In addition, the export portion of Incheon International Airport, which is an aviation logistics service, is growing more and more. In the west coast era, interest and investment in Incheon, Pyeongtaek and Gwangyang seem to be more needed in preparation for import and export to China, Southeast Asia and North Korea.
Key Words : Export, Ports/Airports, Aviation Logistics, Maritime Logistics, Growth Rate, the Rate of Change
요 약 본 연구의 목적은 한국의 항만별/공항별 수출 상승률과 변동률 동향을 살펴보고, 어느 항만/공항의 상승이 높게 나타나고 있는지 분석하는데 있다. 이를 위해 수출금액 순으로 인천공항, 부산, 인천, 울산, 광양, 평택을 선택하였다. 각 항만/
공항별 분석기간은 2001년 9월부터 2018년 4월까지 총 200개 월간자료를 이용하였다. 상승률과 변동률에서, 평택, 인천, 광양 이 부산과 울산에 비해 상대적으로 크게 나타나고 있다. 최근 미국과 일본에 비해 상대적으로 중국과 동남아 수출이 더 많이 증가하기 때문으로 판단된다. 분석결과 기존 부산, 인천공항, 울산의 수출에서 최근 인천공항, 인천, 광양, 평택으로 수출이 서서히 이동하고 있다. 또한, 항공물류인 인천공항의 수출비중이 더욱 커지고 있어 이에 필요한 시설 및 관련 투자가 필요해 보인다. 서해안시대를 맞이하여 중국 및 동남아, 북한으로 수출입에 대비하여 인천, 평택, 광양에 대한 관심과 투자가 더욱 필요해 보인다.
주제어 : 수출, 항만/공항, 항공물류, 해상물류, 성장률, 변동률
*Corresponding Author : Soo-Ho, Choi ([email protected]) Received October 10, 2018
Accepted January 20, 2019
Revised November 29, 2018 Published January 28, 2019
transportation means between Korea and foreign countries. Korea is in the process of export customs clearance at ports and airports.
Korea has aviation logistics at 16 airports including Incheon, Gimhae, Gimpo, Yeosu and maritime logistics at 40 ports including Busan, Incheon, Ulsan, Gwangyang, Pyeongtaek, Daesan, Yeosu. As of 2017, Incheon Airport exports $34.6 billion and imports $73.2 billion, accounting for 10.2% of total trade volume.
Incheon Port exported $25.7 billion and imported $61.5 billion, accounting for 8.3% of total trade volume. The largest export trade country in Incheon port is China (37.7%). Major export items are electronic (21.7%) and machinery (15.9%) [1].
The purpose of this study is to analyze the trends of export growth rate and rate of change by each port/airport in Korea and to analyze which each port/airport rise is high. For this purpose, we chose 6 locations including Incheon Airport, Busan Port, Incheon Port, Ulsan Port, Gwangyang Port, and Pyeongtaek Port in order of export value, accounting for more than 80% of Korea's exports. The analysis period for each port/airport was 200 monthly data from September 2001 to April 2018.
2. Literature Review
Since most exports to Korea are carried out through ports and airports, international logistics means are made up of ships and aircraft. Since the decision on the transportation of major domestic exports is determined by the value of the increase in cargo, we analyze how the ports/airports utilization pattern has changed since 1990 [2]. As a result of looking at the priority of composite logistics cities where ports and airports logistics are complex, airport competitiveness, city competitiveness, and port competitiveness were ranked.
Airport infrastructure in airport competitiveness, economic competence in urban competitiveness and port competitiveness in port infrastructure has analysed
the highest weight [3].
Recently, he analyzed the concentration and liquidity of airports and analyzed the traffic volume structure of major airports in Asia according to changes in the airports. It is suggested that there is a need to continually study the causes of the transition of Northeast Asian airports in the future [4]. It is estimated that the potential demand is very high as a result of estimating the demand for cargo that can be converted from marine transportation to marine/aviation transportation between Korea and China. In order to facilitate ports/airports transportation by converting potential demand to actual demand, we proposed effective strategies such as construction of a port in Incheon Airport, establishment of maritime and air terminal in free trade zone and securing of aircraft space [5].
In order for the national logistics system to operate efficiently, it is suggested that a rational logistics base policy and supply of logistics facilities are necessary.
The priority of the national logistics center project should be carried out so that both efficiency and equity of spatial characteristics can be established [6]. In terms of air freight volume flow, Tokyo Airport has the largest volume of traffic and shows the largest number of linked systems and flow patterns with neighboring cities. Following Tokyo, London, NY, Frankfurt, Singapore, Hong Kong and Seoul are major hub cities [7]
Incheon is building a complex transportation system that has both airports and ports. In terms of combined transportation, the competitiveness scores of major cities were ranked in order of Shanghai (64.8), Hong Kong (64.5), Incheon (62.9) and Busan (60.4).
Therefore, it is highly likely that Incheon will develop as a hub for international multimodal logistics in Northeast Asia [8]. Ports are becoming multifunctional and networked. Incheon Port needs a strategy of logistics complexation and network center strategy in East Asia and metropolitan area to develop the industry in the metropolitan area. Incheon Port is the hub of logistics in the metropolitan area, and as China's rapid
economic growth, the increase in freight volume will serve as a strengthening opportunity [9].
Busan port trade volume showed relatively less effect and less persistence on the change impact of Gwangyang port and Incheon port. Gwangyang Port trade volume was relatively more effective and long lasting than Busan Port and Incheon Port. The traffic volume of Incheon Port was more effective than that of Gwangyang Port. As a result of dispersion and decomposition of the forecast error, it is argued that the trade volume of Incheon Port is the largest part explained in comparison with Gwangyang Port or Busan Port [10]. As a result of analyzing Grandeur causality, Jeonbuk, Busan, Gangwon, Incheon, Jeju, Ulsan and Jeonnam analyzed that industrial production change causes changes in trade volume. At the same time, Incheon, Jeju and Jeonnam suggest that trade volume and industrial production have causal relations with both directions [11].
As a port selection factor, this paper mainly focuses on the service level related to port facilities such as equipment availability, timely delivery, possibility of entry into large ships, and cargo handling capacity [12].
In addition, Slack (1985) proposes port safety as an important selection factor in addition to port proximity and facility efficiency [13]. On the other hand, it suggests a very complex harbor image and expertise of harbor professionals as a factor of harbor choice [14,15,16].
3. Data Collection and Export Trends by each ports/airports
3.1 Data Collection
The purpose of this study is to analyze the trends of export growth rate and rate of change by each ports/airports in Korea and to analyze which each port/airport rise is high. For this, Incheon Airport, Busan Port, Incheon Port, Ulsan Port, Gwangyang Port, and Pyeongtaek Port were selected in order of export.
The data required for this study were collected from the trade statistics of the Korea Customs Service. The analysis period for each ports/airports was 200 monthly data from September 2001 to April 2018.
It is written as follows. Korea's total exports is Korea, Incheon Airport is Incheon Airport, Busan Port is Busan, Incheon Port is Incheon, Ulsan Port is Ulsan, Gwangyang Port is Gwangyang, Pyeongtaek Port is Pyeongtaek. The monthly data used in this study were numerical analysis, index analysis and model analysis using Excel, SPSS and e-views. Through this, we will examine the extent to which Korea's major ports/ports affect Korea's total exports. We will also show the trends and growth rates of exports by each port/airport.
3.2 Import & Export Status by each ports/airports
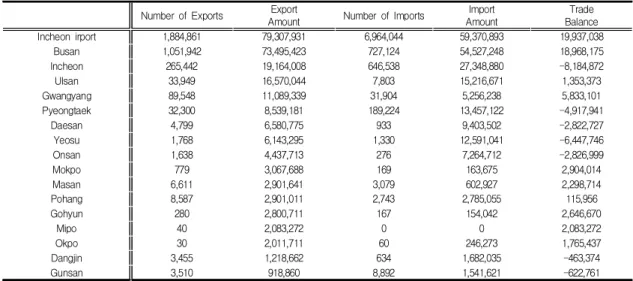
<Table 1> shows the export⋅import performance by ports/airports from January 2018 to May 2018. In the past five months, the number of exports was high in Incheon Airport, Busan, Incheon, Gwangyang, Ulsan and Pyeongtaek. The export amount was in the order of Incheon Airport, Busan, Incheon, Ulsan, Gwangyang, Pyeongtaek. In the case of trade balance, Incheon International Airport, Busan, Gwangyang and Ulsan showed a surplus, while Incheon and Pyeongtaek recorded a deficit [17].
In the month of May 2018, YoY exports and imports increased by 13.2% to $ 50.8 billion, imports rose by 12.7% to $ 44.3 billion, and trade surplus reached $ 6.6 billion. The company has achieved a surplus for 76 consecutive months since February 2012. Among the major export items, semiconductors (43.2%), petroleum products (38.1%) and wireless communication equipment (4.1%) increased, passenger cars (0.9%) and vessels (67.9%) decreased. Among the major export destinations, China (30.0%), the United States (11.8%), the EU (3.7%) and Japan (15.8%) increased while Vietnam (8.5%) and the Middle East (6.3%) decreased [18].
4. Empirical Analysis
4.1 Numerical Analysis
<Table 2> shows export descriptive statistics for Korea and each port/airport. In the average, Pyeongtaek 2.53%, Ulsan 1.85%, Incheon 1.52%, Gwangyang 1.23%, Incheon Airport 1.13%, Korea 1.02% and Busan 1.00%. The standard deviations were Pyeongtaek 18.11, Ulsan 16.25, Incheon 10.92, Busan 9.69, Gwangyang 9.02, Incheon Airport 8.51, Korea 8.15.
The variation width was calculated in order of Pyeongtaek (120 = 79 + 41), Ulsan (102 = 62 + 40),
Incheon (61 = 40 + 21) and Gwangyang (58 = 26 + 32).
In the case of Kurtosis, all of them were larger than 3.0, showing more dense central tendency than the normal distribution. Overall, Pyeongtaek, Ulsan, Incheon, and Gwangyang are gradually growing into ports leading to export to Korea [19].
The export correlation is shown in <Table 3>.
Correlation coefficients for Korea were as follows:
Busan (0.833), Incheon (0.763), Incheon Airport (0.648) and Gwangyang (0.635). Pyeongtaek had the lowest correlation coefficient with other ports/airports, indicating the greatest growth rate and rate of change.
Korea
Incheon
Air Port Busan Incheon Ulsan
Gwang Yang
Pyeong Taek
Mean 1.024 1.132 1.000 1.520 1.858 1.235 2.533
Median 0.304 0.914 0.470 0.511 0.914 0.649 2.194
Maximum 24.918 26.051 29.909 39.618 61.916 26.397 78.980
Minimum -22.28 -27.08 -26.95 -21.16 -39.80 -32.26 -41.16
Std. Dev. 8.150 8.519 9.699 10.928 16.257 9.021 18.115
Skewness 0.192 0.127 0.227 0.652 0.519 0.055 0.650
Kurtosis 3.226 3.752 3.450 4.010 4.161 3.577 4.661
Jarque-Bera 1.657 5.254 3.419 22.689 20.223 2.880 37.133
Probability 0.436 0.072 0.180 0.000 0.000 0.236 0.000
N 200 200 200 200 200 200 200
Table 2. Descriptive statistics
Number of Exports Export
Amount Number of Imports Import
Amount
Trade Balance
Incheon irport 1,884,861 79,307,931 6,964,044 59,370,893 19,937,038
Busan 1,051,942 73,495,423 727,124 54,527,248 18,968,175
Incheon 265,442 19,164,008 646,538 27,348,880 -8,184,872
Ulsan 33,949 16,570,044 7,803 15,216,671 1,353,373
Gwangyang 89,548 11,089,339 31,904 5,256,238 5,833,101
Pyeongtaek 32,300 8,539,181 189,224 13,457,122 -4,917,941
Daesan 4,799 6,580,775 933 9,403,502 -2,822,727
Yeosu 1,768 6,143,295 1,330 12,591,041 -6,447,746
Onsan 1,638 4,437,713 276 7,264,712 -2,826,999
Mokpo 779 3,067,688 169 163,675 2,904,014
Masan 6,611 2,901,641 3,079 602,927 2,298,714
Pohang 8,587 2,901,011 2,743 2,785,055 115,956
Gohyun 280 2,800,711 167 154,042 2,646,670
Mipo 40 2,083,272 0 0 2,083,272
Okpo 30 2,011,711 60 246,273 1,765,437
Dangjin 3,455 1,218,662 634 1,682,035 -463,374
Gunsan 3,510 918,860 8,892 1,541,621 -622,761
Source : https://unipass.customs.go.kr [21]
Table 1. Export & Import Performance by each Ports/Airports
(Unit : 1,000$, period : 20018.1-2018.5)
<Table 4> shows regression analysis where Korea is a dependent variable and each port/airport is an independent variable. Coefficient was large in the following order : Busan (0.372), Incheon International Airport (0.219), Ulsan (0.115), Incheon (0.084). Adjusted R-squared was 0.815, and the variation of the dependent variable Korea showed 81.5% explanatory power. The Durbin- Watson stat is 3.042, meaning a market that is close to 2 and moves independently of each other. The t-statistics and p-value (≤ 0.01) of Incheon International Airport, Busan, Ulsan and
Pyeongtaek were statistically significant except for Gwangyang and Incheon.
<Table 5> shows the analysis of the missing values for Korea and each ports/airports. In <Tab. 5>, Mean, S.D., Missing (Frequency, %), Extreme value number (Lower limit, Upper limit) are shown. Pyeongtaek, Ulsan and Incheon have high mean and high standard deviation. Korea and Incheon airports have 21 frequent missing values (9.5%). The Extreme value number has a lower limit and an upper limit for Ulsan (8, 9) and Incheon (2, 11).
Univariate Statistics
N Mean S.D.
Missing Extreme value number*
Freq. % Lower limit Upper limit
Korea 200 1.03 8.15 21 9.5 2 1
Incheon Air 200 1.13 8.51 21 9.5 3 5
Busan 216 .98 9.33 5 2.3 3 6
Incheon 214 1.45 10.56 7 3.2 2 11
Ulsan 212 1.79 15.79 9 4.1 8 9
Gwangyang 210 1.20 8.80 11 5.0 1 2
Pyeongtaek 208 2.45 17.76 13 5.9 2 6
* : The number of cases out of range (Q1-1.5*IQR, Q3+1.5*IQR).
Table 5. Missing value analysis
Korea Incheon Airport Busan Incheon Ulsan Gwang
yang
Pyeong taek
Korea 1
Incheon Airport 0.648** 1
Busan 0.833** 0.515** 1
Incheon 0.763** 0.590** 0.773** 1
Ulsan 0.602** 0.310** 0.465** 0.453** 1
Gwangyang 0.635** 0.453** 0.703** 0.602** 0.409** 1
Pyeongtaek 0.553** 0.359** 0.530** 0.467** 0.297** 0.262** 1
**. The correlation is significant at level 0.01.
Table 3. Correlation Analysis
Variable Coefficint S. E. t-Stat. Prob.
Incheon AirPort 0.219 0.036 5.972 0.000
Busan 0.372 0.048 7.608 0.000
Incheon 0.084 0.038 2.186 0.030
Ulsan 0.115 0.017 6.534 0.000
Gwangyang 0.025 0.040 0.627 0.530
Pyeongtaek 0.047 0.016 2.861 0.004
R-squared 0.820 Mean dependent var 1.024
Adjusted R-squard 0.815 S.D. dependent var 8.150
S.E. of regression 3.498 Akaike info criterion 5.371
Sum squared resid 2373.83 Schwarz criterion 5.470
Log likelihood -531.182 Hannan-Quinn criter. 5.411
Durbin-Watson stat 3.0421
Table 4. Regression Analysis : Dependent variable - Korea
4.2 Indicator Analysis
Fig. 1. Growth Rate
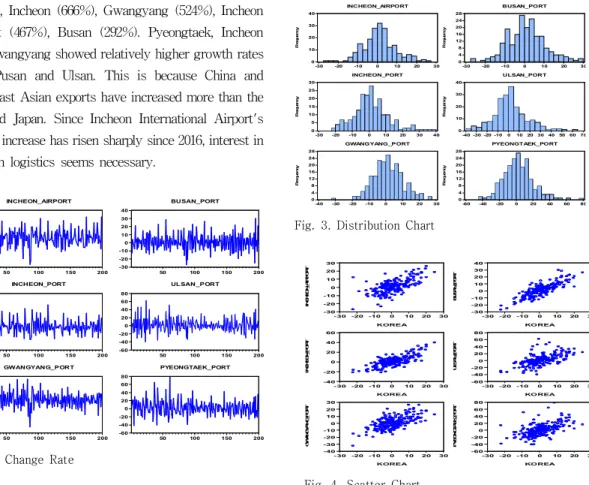
The growth rate of each port/airport is shown in [Fig. 1]. From September 2001 to April 2018, the rate of increase was in the following order : Pyeongtaek (699%), Incheon (666%), Gwangyang (524%), Incheon Airport (467%), Busan (292%). Pyeongtaek, Incheon and Gwangyang showed relatively higher growth rates than Pusan and Ulsan. This is because China and Southeast Asian exports have increased more than the US and Japan. Since Incheon International Airport's rate of increase has risen sharply since 2016, interest in aviation logistics seems necessary.
-30 -20 -10 0 10 20 30
50 100 150 200
INCHEON_AIRPORT
-30 -20 -10 0 10 20 30 40
50 100 150 200
BUSAN_PORT
-40 -20 0 20 40 60
50 100 150 200
INCHEON_PORT
-60 -40 -20 0 20 40 60 80
50 100 150 200
ULSAN_PORT
-40 -30 -20 -10 0 10 20 30
50 100 150 200
GWANGYANG_PORT
-60 -40 -20 0 20 40 60 80
50 100 150 200
PYEONGTAEK_PORT
Fig. 2. Change Rate
[Fig. 2] shows the trend of the change rate in each port/airport. Over the past 200 months, the rate of change in Pyeongtaek (-40~+80%) and Ulsan (-40~+60%) has been about twice as high as that of other ports/airports. There is a need to distinguish between the changes rate in the aviation logistics and the maritime logistics. Looking at the rate of increase and change in Incheon Airport, it is expected that the relative importance of the aviation logistic will increase.
4.3 Model Analysis
[Fig. 3] shows the growth rate distribution chart for each port/airport. The distribution chart were as follows : Pyeongtaek (-60~+80%), Ulsan (-40~+70%), Incheon (-30~+40%), Gwangyang (-40~+30%), Incheon Airport (-30~+30%), Busan (-30~+30%). The overall distribution chart is highly dense with an average (+1~+2.5%).
0 10 20 30 40
-30 -20 -10 0 10 20 30
Frequency
INCHEON_AIRPORT
0 4 8 12 16 20 24 28
-30 -20 -10 0 10 20 30
Frequency
BUSAN_PORT
0 5 10 15 20 25 30
-30 -20 -10 0 10 20 30 40
Frequency
INCHEON_PORT
0 10 20 30 40
-40 -30 -20 -100 10 20 30 40 50 60 70
Frequency
ULSAN_PORT
0 4 8 12 16 20 24 28
-40 -30 -20 -10 0 10 20 30
Frequency
GWANGYANG_PORT
0 4 8 12 16 20 24 28
-60 -40 -20 0 20 40 60 80
Frequency
PYEONGTAEK_PORT
Fig. 3. Distribution Chart
-30 -20 -10 0 10 20 30
- 30-20 -10 0 10 20 30 KOREA
INCHEON_AIRPORT
-30 -20 -10 0 10 20 30 40
-30-20 -10 0 10 20 30 KOREA
BUSAN_PORT
-40 -20 0 20 40 60
- 30-20 -10 0 10 20 30 KOREA
INCHEON_PORT
-60 -40 -20 0 20 40 60 80
-30-20 -10 0 10 20 30 KOREA
ULSAN_PORT
-40 -30 -20 -10 0 10 20 30
- 30-20 -10 0 10 20 30 KOREA
GWANGYANG_PORT
-60 -40 -20 0 20 40 60 80
-30-20 -10 0 10 20 30 KOREA
PYEONGTAEK_PORT
Fig. 4. Scatter Chart
Scatter charts for each port/airport for Korea are shown in [Fig. 4]. The X-axis represents Korea's change rate and the Y-axis represents the change rate for each port/airport. The distribution charts of Busan, Incheon, Incheon Airport, and Gwangyang, which have high correlation coefficients, are generally upward, indicating high coupling behavior.
Time
lag ACF S.D.a
Box-Ljung Statistic value free
degree
p-valueb
1 .074 .032 5.295 1 .021
2 .001 .036 5.296 2 .071
3 .107 .038 13.206 3 .004
4 -.014 .035 13.357 4 .010
5 .101 .036 21.146 5 .001
6 .253 .040 61.642 6 .000
7 .100 .036 69.484 7 .000
8 .056 .035 72.004 8 .000
9 .092 .039 77.717 9 .000
10 .056 .033 80.600 10 .000
11 .064 .039 83.352 11 .000
12 .306 .039 143.531 12 .000
13 .110 .034 153.804 13 .000
14 .090 .034 160.615 14 .000
15 .082 .036 165.803 15 .000
16 -.022 .033 166.252 16 .000
a: The assumed basic process is independent (white noise).
b: It is based on the approximate chi-square approximation.
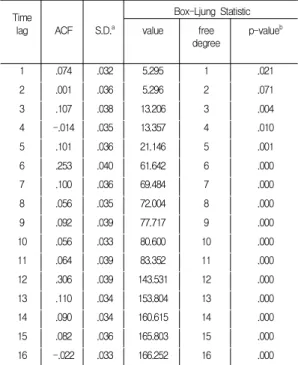
Table 6. Autocorrelation Function : Korea
Fig. 5. Autocorrelation Function : Korea
Fig. 6. ACF : Incheon Airport & Busan
Fig. 7. ACF : Incheon & Ulsan
Fig. 8. ACF : Gwangyang & Pyeongtaek
<Table 6> and [Fig. 5]~[Fig. 8] show the autocorrelation function (ACF) of Korea and each port/airport. The autocorrelation means the expected value M[f(t)∙f(t+τ 0)] of the function product for the other two points t and t+τ0, where the function f(t) fluctuates with time or space. It is considered that ACF of Korea and each
port/airport is not independent according to the time progress because the present condition is closely related to past and future. Therefore, time series data of Korea and each port/airport means that they have autocorrelation. In Korea, the probability of significance in the Box-Ljung statistic is smaller than the significance level (0.05), so that the null hypothesis is rejected and autocorrelation exists. Therefore, it means that there is no random and independent period between time series data.
-30 -20 -10 0 10 20 30
-30 -20 -10 0 10 20 30 Quantiles of INCHEON_AIRPORT
QuantilesofNormal
-30 -20 -10 0 10 20 30
-30 -20 -10 0 10 20 30 40 Quantiles of BUSAN_PORT
QuantilesofNormal
-30 -20 -10 0 10 20 30 40
-40 -20 0 20 40 60 Quantiles of INCHEON_PORT
QuantilesofNormal
-60 -40 -20 0 20 40 60
-60 -40 -20 0 20 40 60 80 Quantiles of ULSAN_PORT
QuantilesofNormal
-30 -20 -10 0 10 20 30
-40 -30 -20 -10 0 10 20 30 Quantiles of GW ANGYANG_PORT
QuantilesofNormal
-60 -40 -20 0 20 40 60
-60 -40 -20 0 20 40 60 80 Quantiles of PYEONGTAEK_PORT
QuantilesofNormal
Fig. 9. Q-Q Charts
[Fig. 9] shows the Quantiles-Quantiles charts for each airport/port. In the Q-Q Charts, the baseline (red line) represents the 1:1 ratio of change in the X and Y axes. Missing and extreme value numbers (Lower limit, Upper limit) in the analysis of missing values in
<Table 5> can be found in [Fig. 9]. In Incheon, Ulsan, Pyeongtaek, Busan, a relatively large upper limit appears at the top, deviating from the baseline [20].
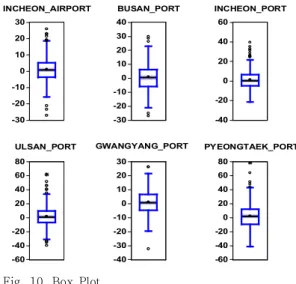
Box Plots for each ports/airports are shown in [Fig.
10]. Box Plot is a method for graphically depicting groups of numerical data through their quartiles.
Pyeongtaek and Ulsan have a fluctuation rate of -40~+40%, which is nearly double the rate of -20~+20%
of other airports/ports. In Incheon, Ulsan and Pyeongtaek, many points (⚪, *) are shown at the top,
resulting in a lot of abnormal surges. Gwangyang seems to have been steadily rising due to relatively small fluctuations.
-30 -20 -10 0 10 20 30
INCHEON_AIRPORT
-30 -20 -10 0 10 20 30 40
BUSAN_PORT
-40 -20 0 20 40 60
INCHEON_PORT
-60 -40 -20 0 20 40 60 80
ULSAN_PORT
-40 -30 -20 -10 0 10 20 30
GWANGYANG_PORT
-60 -40 -20 0 20 40 60 80
PYEONGTAEK_PORT
Fig. 10. Box Plot
5. Conclusion
The purpose of this study is to analyze the trends of export growth rate and rate of change by each port/airport in Korea and to analyze which ports/airports rise is high. For this, Incheon Airport, Busan Port, Incheon Port, Ulsan Port, Gwangyang Port, and Pyeongtaek Port were selected in order of export.
The analysis period for each ports/airports was 200 data from September 2001 to April 2018.
In descriptive statistics, the average were order of Pyeongtaek, Ulsan, Incheon, Gwangyang, Incheon International Airport and the standard deviations were in order of Pyeongtaek, Ulsan, Incheon, Busan, Gwangyang and Incheon airports. Recently, Pyeongtaek, Ulsan and Incheon are showing high growth. Correlation coefficients were higher for Korea in Busan, Incheon, Incheon Airport and Gwangyang. In regression analysis where Korea is a dependent variable, coefficient was in order of Busan, Incheon Airport, Ulsan and Incheon. SO, each port/airport with high export volumes are more likely to affect Korea.
On the other hand, Pyeongtaek has the lowest growth rate and the highest growth rate with the lowest coefficient of correlation.
In the rate of increase over the last 200 months, Pyeongtaek, Incheon and Gwangyang were relatively larger than Busan and Ulsan. The reason for this is that exports to China and Southeast Asia have increased more than in the US and Japan. Since Incheon International Airport's rate of increase has risen sharply since 2016, interest in aviation logistics seems necessary. In terms of the rate of change in Incheon International Airport, which is representative of aviation logistics, and ports representing maritime logistics, As Incheon International Airport's rate of increase and rate of change have increased relatively recently, we believe that the proportion of aviation logistics will increase in the future.
Scatter analysis shows that the distribution charts of Busan, Incheon, Incheon Airport and Gwangyang which have high correlation coefficient are rising to the right on the whole. Therefore, it seems that the symmetry phenomenon with Korea is high. In the autocorrelation function (ACF) of Korea and each port/airport, the current status of the ACF is closely related to the past and the future, and it is judged that it is not independent according to the time progress. Therefore, time series data of Korea and each port/airport are autocorrelated. In the Quantiles-Quantiles Charts, Incheon, Ulsan, Pyeongtaek and Busan have a relatively high upper limit at the top. In the Box Plot, Incheon, Ulsan and Pyeongtaek show a number of points (⚪,*) at the top, showing a number of abnormal surges.
Exports of Busan, Incheon and Ulsan have recently been gradually increasing to Incheon Airport, Incheon, Gwangyang and Pyeongtaek. The export portion of Incheon International Airport, which is an aviation logistics service, is increasing. Therefore, the necessary facilities and related investment seem necessary. In addition, in preparation for the export and import to China, Southeast Asia and North Korea, Interest and
investment in Incheon, Pyeongtaek and Gwangyang seem to be needed more.
With the recent FTA becoming active, it is gradually being transferred from sea logistics to aviation logistics. In addition, logistics centers are shifting from China and Southeast Asia to the US and Japan. Therefore, logistics trends are increasing to Incheon International Airport and west coast ports such as Incheon, Gwangyang and Pyeongtaek. The limitation of this paper is that it does not examine the logistics of each item at each airports/ports. In future research, it is necessary to study logistics by item in each airports/ports logistics.
This study examined the extent to which each airports/ports affected to Korea exports. This study also analyzed which airports/ports are increasing their share of Korea exports. Through numerical analysis, index analysis, and model analysis, this paper suggests that Busan Port, Incheon Port and Incheon Airport have grown into major export bases in Korea. In addition, the growth of Gwangyang Port and Pyeongtaek Port showed a great growth, and it informed the departure of the west coast age in the future. Korea exports need to be diversified from China, USA and Japan to Southeast Asia, India, the Middle East and Europe.
Each airports/ports will have to develop in a balanced way. Previous review have analyzed only specific airports or ports. However, this study selected six major airports/ports in Korea and analyzed them comprehensively. This paper appears to be different from previous review.
REFERENCE
[1] Kim, J. H. (2018), Incheon customs import and export trend in 2017, Department of Customs Export Administration, Press Releases, 1-14.
[2] Lee, J. Y. & Lee, E. J. (2016), Study on the Modal Choice Pattern based on the Unit Weight Value of Export Freights, Korea logistics review, 26(1), 39-49.
[3] Noh, G. J. & Song, S. H. (2016), A Study on
Competitiveness Priorities of Global Complex Logisitcs Hub City, The Korean international commerce review, 31(1), 97-109.
[4] Jung, T. W. (2015), Competitive Composition of Main Airports in North Asia : Focused on Air Cargo, Journal of Korea Port Economic Association, 31(3), 93-105.
[5] Lee, H. S. etc 4, (2006), Sea and air inter-modal transportation network between Korea and China, Korean journal of logistics, 14(1), 213-246.
[6] Lee, J. Y. (2009), A Study on the Policy Transition of National Logistics Hubs in Korea and its Alternative Direction, The geographical journal of Korea, 43(1), 79-89.
[7] Nam, Y. W. & Lee, H. S. (2004), Changes of Global Urban System Reflected in Air Freight Flows, The Journal Of Korea Planners Association, 39(1), 129-143.
[8] Jung, T. W. (2010), A Study on a development plan for multi-transportation in Incheon : Focused on Incheon and main cities in Northern China, Journal of Korea Port Economic Association, 26(1), 259-276.
[9] Seo, M. S. (2011), A Study of the Strategy for Building Inchon Port as Hub for the Centralization of Logistics Integration and Network Building in the Region of Northern-East Asia and the Seoul Capital City Area, Journal of Korea Port Economic Association, 27(4), 291-311.
[10] Choi, B. H. & Kim, S. C. (2010), An Empirical Study on Causality among Trading Volume of Busan, Kawangyang and Incheon port, Journal of Korea Port Economic Association, 26(1), 61-82.
[11] Mo, S. W. & Lee, G. B. (2013), Causality Analysis between Port Trading Volume and Industrial Activity, The journal of shipping and logistics, 29(2), 221-235.
[12] Murphy, P. R., Daley, J. M, and Dalenberg, D. R., (1992), Port Selection Criteria : An Application of a Transportation Research Framework, Logistics &
Transportation Review, 28(3), 237-255.
[13] Slack, B., (1985), Containerization Inter-port Competition and Port Selection, Maritime Policy and Management, 12(4), 293-303.
[14] Lu, C. S., (2000), Logistics services in Taiwanese maritime firms, Transportation Research Part E, 36(2), 79-96.
[15] Jerman, R. E., Anderson, R. D., Constantin, J. A., (1979), Shipper versus carrier perceptions of carrier selection variables, International Journal of Physical Distribution and Materials Management, 9(1), 29-38.
[16] Gibson, B. J., Sink, H. K., Mundy, R. A., (1993),
Shipper-carrier relationships and carrier selection criteria, Logistics and Transportation Review, 29(4), 371-381.
[17] Park, S. M. (2013), Direction toward Economic Development of Southwest Area of Jeonnam Province through Construction of Airport and Port Supporting Complex, Journal of Korea Port Economic Association, 29(3), 39-71.
[18] Lee, J. O. (2018), Monthly import⋅export status in May 2018, Korea Customs Service Customs Planning Division, Press Releases, 1-18.
[19] Choi, J. I. (2017), Volatility & Correlation Analysis of the East Asian Stock Market - Focusing on Korea⋅Japan⋅
China⋅Hong Kong⋅Taiwan, Journal of the Korea Contents Association, 17(5), 165-173.
[20] Choi, S. H. & Choi, J. I. (2017), Analysis of Exchange Rate and Interest Rate Fluctuations Affecting Exports, Journal of the Korea Convergence Society, 8(10), 231-238.
[21] Korea Customs Service: http://www.customs.go.kr
최 수 호(Soo-Ho, Choi) [정회원]
⋅2011년 2월 : 항공대 항공교통물류 학부(이학사)
⋅2016년 2월 : 서강대학교 대학원 경영학부(경영학석사)
⋅2016년 3월 : 서강대학교 대학원 경영학부(경영학박사수료)
⋅2014년 3월 ~ : 서강대학교 경영학부 조교
⋅관심분야 : SCM, GVC, 물류, 서비스경영
⋅E-Mail : [email protected]